![]()

Charlotte, North Carolina
Charlotte is the largest community
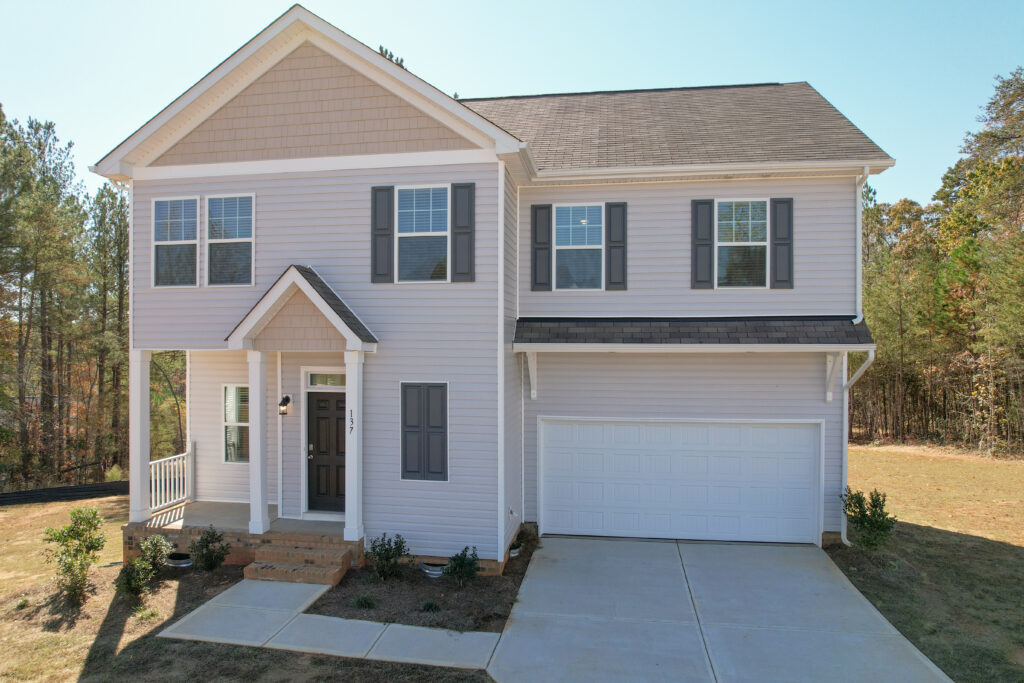


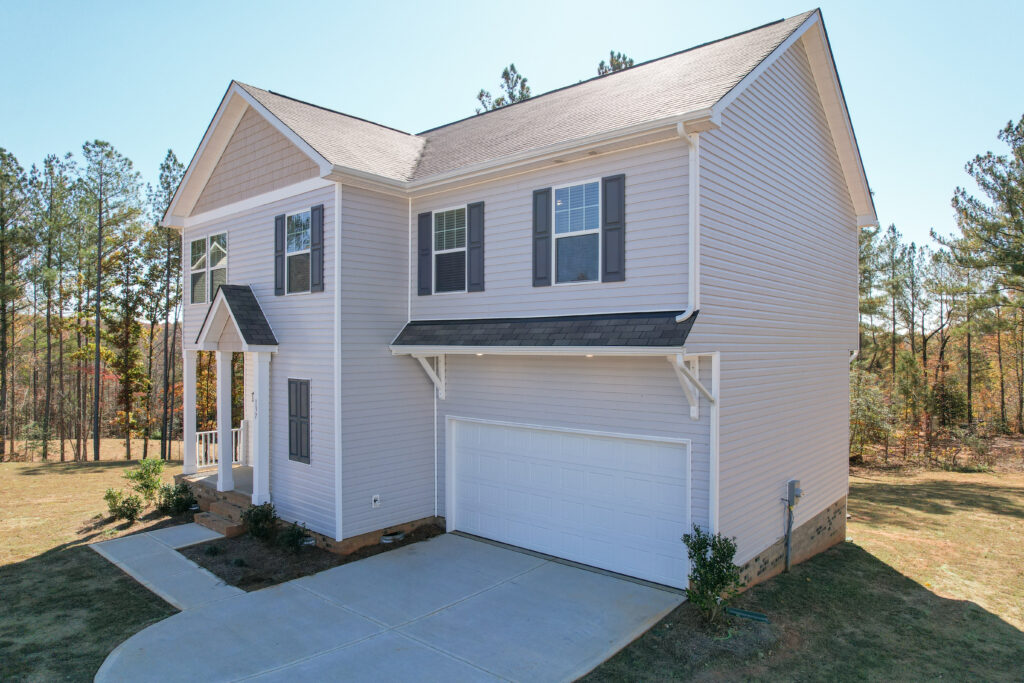
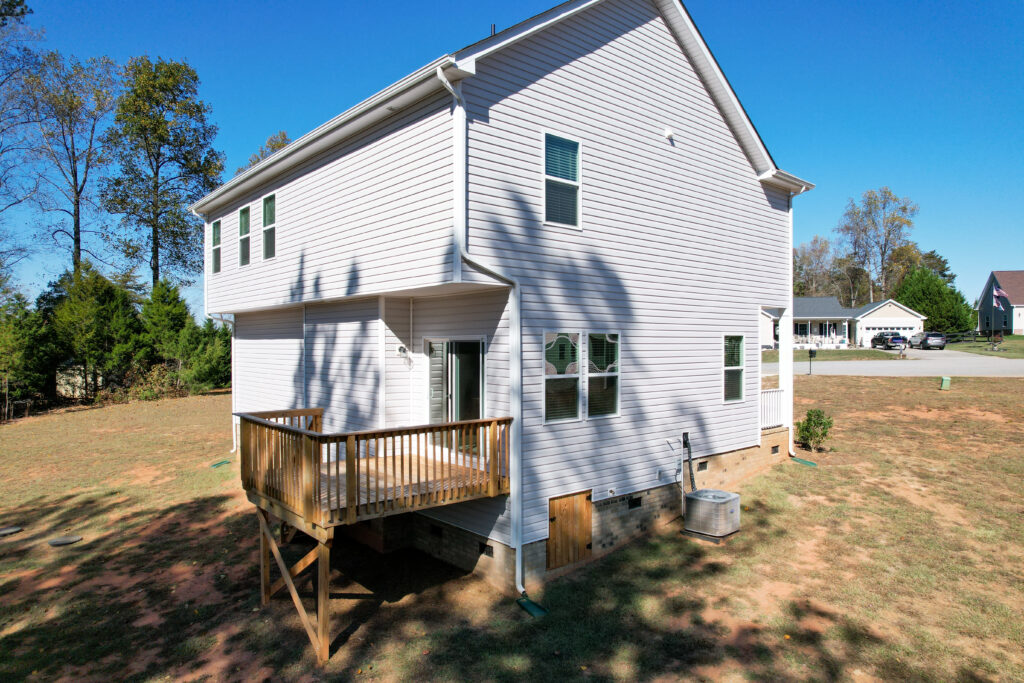
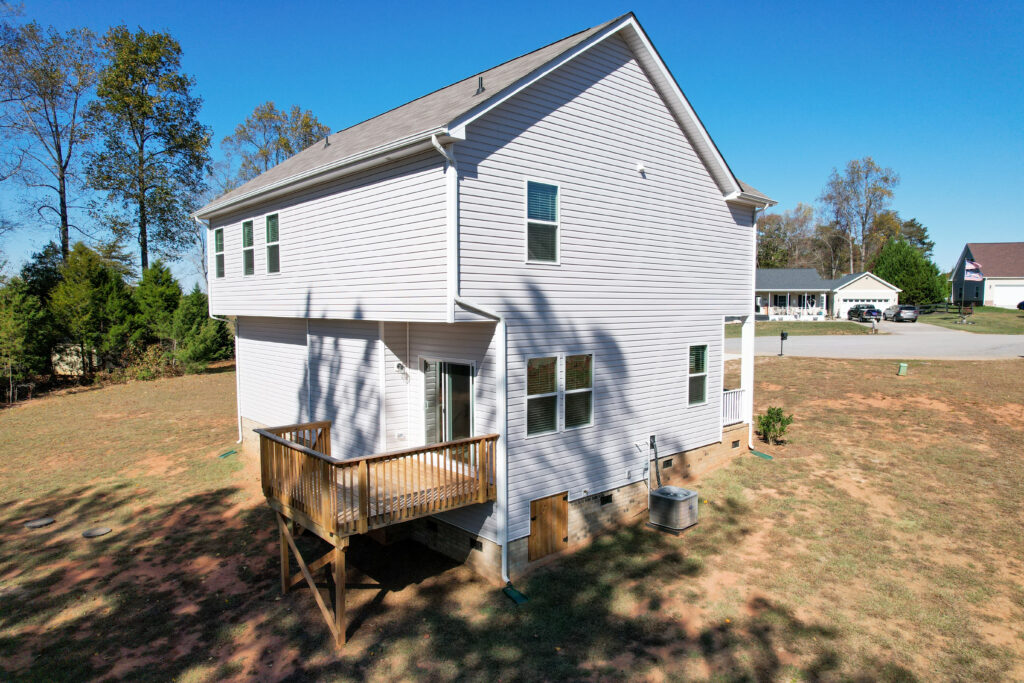
Rolling Hills Drive
Sherrills Ford, North Carolina
$379,900
$2,095
2022
$219
0.6%
A+
6.0%
$1,900
Charlotte is a very large city located in the state of North Carolina. With a population of 872,498 people and 200 constituent neighborhoods, Charlotte is the largest community in North Carolina.
Unlike some cities, Charlotte isn’t mainly white- or blue-collar. Instead, the most prevalent occupations for people in Charlotte are a mix of both white- and blue-collar jobs. Overall, Charlotte is a city of sales and office workers, professionals, and managers. There are especially a lot of people living in Charlotte who work in management occupations (11.72%), sales jobs (11.61%), and office and administrative support (10.81%).
Also of interest is that Charlotte has more people living here who work in computers and math than 95% of the places in the US.
Charlotte is a popular destination for single career-starters. One thing that you will notice when you are out and about town is that there is a large population of people who are young, single, educated, and upwardly-mobile career starters out at restaurants, listening to live music, and enjoying other activities. They are a real visible part of the culture of Charlotte. This makes Charlotte a good place to live for young professionals. With so many people in this demographic, Charlotte presents many opportunities for single professionals to enjoy themselves, socialize, and to create lasting relationships.
One important feature of Charlotte is that it is one of the most car-oriented large cities in the country. In fact, 82.22% of people commute to and from work every day by private automobile, eschewing alternative forms of transportation, which are not widely available in Charlotte anyway. So, if you like to drive, Charlotte is the city for you! The landscape around Charlotte reflects this: wide streets, parking lots, plenty of highways, malls, and shopping centers are what you'll find.
The citizens of Charlotte are among the most well-educated in the nation: 43.52% of adults in Charlotte have a bachelor's degree or even advanced degree, whereas the average US city has 21.84% holding at least a bachelor's degree.
The per capita income in Charlotte in 2010 was $36,426, which is wealthy relative to North Carolina and the nation. This equates to an annual income of $145,704 for a family of four. However, Charlotte contains both very wealthy and poor people as well.
Charlotte is an extremely ethnically-diverse city. The people who call Charlotte home describe themselves as belonging to a variety of racial and ethnic groups. The greatest number of Charlotte residents report their race to be White, followed by Black or African-American. Charlotte also has a sizeable Hispanic population (people of Hispanic origin can be of any race). People of Hispanic or Latino origin account for 13.97% of the city’s residents. Important ancestries of people in Charlotte include German, Irish, English, Italian, and African.
In addition, Charlotte has a lot of people living here who were born outside of the US (16.46%).
The most common language spoken in Charlotte is English. Other important languages spoken here include Spanish and Langs. of India.
Charlotte APPRECIATION RATE
| TIME PERIOD | TOTAL APPRECIATION | AVG. ANNUAL RATE | COMPARED TO State* | COMPARED TO AMERICA* |
|---|---|---|---|---|
| Latest Quarter: 2023 Q3-2023 Q4 |
0.00% | 0.00% | ||
| Last 12 Months: 2022 Q4-2023 Q4 |
0.00% | 0.00% | ||
| Last 2 Years: 2021 Q4-2023 Q4 |
0.00% | 0.00% | ||
| Last 5 Years: 2018 Q4-2023 Q4 |
0.00% | 0.00% | ||
| Last 10 Years: 2013 Q4-2023 Q4 |
0.00% | 0.00% | ||
| Since 2000: Q1-2023 Q4 | 0.00% | 0.00% |
RENT & OWNERSHIP
HOME OWNERSHIP RATE
REGIONAL APPRECIATION POTENTIAL
RATINGS: 1=Very Low 2=Low 3=Moderate 4=High 5=Very High
REGIONAL HOUSING MARKET ANALYSIS
HOUSING AFFORDIBALITY TRENDS: CHARLOTTE METRO AREA
Years of average household income needed to buy average home
0.00
Region Historical Low
0.00
Region Historical High
0.00
Current
REGIONAL 1 AND 2 YEAR GROWTH TRENDS
| REGIONAL TREND | LAST 1 YEAR | COMPARED TO NATION* | LAST 2 YEARS | COMPARED TO NATION* |
|---|---|---|---|---|
| Population Growth | 0.00% | 0.00% | ||
| Job Growth | 0.00% | 0.00% | ||
| Income Trends(Wages) | 0.00% | 0.00% | ||
| Unemployment Trend | 0.00% | 0.00% | ||
| Stock Performance of Region's Industries | 0.00% | 0.00% | ||
| Housing Added | 0.00% | 0.00% | ||
| Vacancy Trend | 0.00% | 0.00% |
Check Back Often for New Investment Opportunities!

Real estate is the most powerful way to accumulate wealth, and more people have become millionaires through real estate than any other means.
This guide has been written in an effort to help educate all real estate investors regardless of their experience.
Dedicated to all investors who want the very best deals!
The advantages of income-generating real estate.
How to analyze properties, cash-flow and returns.
How to choose the best markets and neighborhoods.