 I'm currently reading Dr. Peter Linneman's “Real Estate Finance and Investments” and it includes some great information on how to predict population growth — the number one indicator of real estate price appreciation and rent growth.
Here are some of my notes:
Past Population Growth
Population growth is extremely persistent. The best way to predict a counties' population growth is to look at how much it grew in the past decade. The forces that shape an area's attractiveness have persistent impacts. If a county grew significantly in population last year, it is more likely than not to also grow this year.
Local Amenities
Local amenities include things like shopping experiences, proximity to attractive activities, good schools, good social life, conducive to both work and play. The capacity to generate and retain amenities adds considerably to the appeal of a city. The attraction to a city on the basis of its physical and social environment represents a major paradigm shift; whereas people formally followed jobs, jobs now are also starting to follow workers.
Immigrants
Immigrants tend to concentrate wherever previous immigrants have settled. Kinship ties, shared language, in the existence of common amenities in public goods make; immigrant enclaves; attractive to subsequent immigrants. This might explain the growth of San Francisco's Chinese population, which already has one of the largest Chinatowns outside of China.
Age Distribution
Counties with very young and very old populations tend to grow more slowly. Specifically, we find the population growth is negatively related to both the share of people younger than 25 and the share of people older than 65. So populations grow faster if the share of people between 25 and 60 is significant.
Tax Rates
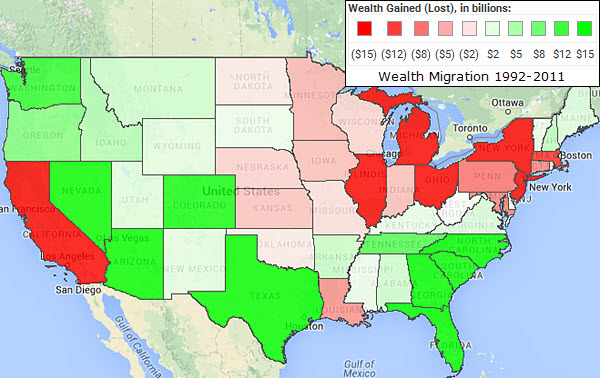
Our statistical analysis reveals that the local sales tax burden is generally associated with slower population growth. Since all tax measures are strongly associated, we tentatively conclude that higher taxation discourages local growth. This explains the growth of Texas, Charlotte, Florida, Nevada, and other low tax states that have created other additional economic incentives to attract large employers.
Here is a map of high tax (red) and low tax (green) states. Not coincidentally, the states losing population are in red and ones significantly growing in population are in green.

Weather
Americans are rapidly leaving cold, damp, and snowy areas for sunnier and drier claimants. The number of sun days in January is the variable that comes out more strongly in our analysis of prediction of population growth.
Atlantic, Pacific and Great Lakes Region
Counties adjacent to the coastlines of the Atlantic, Pacific and Great Lakes tend to grow more slowly then in Lynn County's coastal areas in the west and north east often have restrictive zoning, which raises prices and miscarriages growth.
Altitude
There appears to be no relationship between the altitude of a county and its growth. This is somewhat a surprising finding, as mountain areas are generally popular.
Conclusion
Growth will be concentrated in California, Arizona, New Mexico, Florida, the greater Seattle metropolitan area, Salt Lake City, the Denver North-South corridor, Texas, the Atlantic – Charlotte – Raleigh Corridor, and the Chicago – Madison region. Central cities of many “Rust Belt” metropolitan areas will continue to lose population. Cleveland, Philadelphia, Detroit, Milwaukee, New Haven, and Saint Louis are all expected to lag behind general U.S. population growth patterns through 2020.
The group of major metropolitan areas with a very high expected growth rates include Phoenix, Dallas, Houston, Denver, Orlando, Charlotte, Austin, Raleigh – Durham – Chapel Hill, all of them in the “Sun Belt”.
Past recent growth, the presence of immigrants, the fraction of population older than 25 and younger than 65, low taxes, and good weather are all positively associated with population growth. Our forecast reveals that most growth and real estate development will occur in the West, the Sunbelt, and along the southern I–85 Route. With that said our model only accounts for 75% of the variance in growth. The other 25% is explained by “surprise” events (for example: Walmart headquarters being developed in Bentonville, Arkansas).