![]()

Cape Coral Investment Properties For Sale
Top 10 MSA for Fastest Job Growth (Bloomberg, Aug 2016)
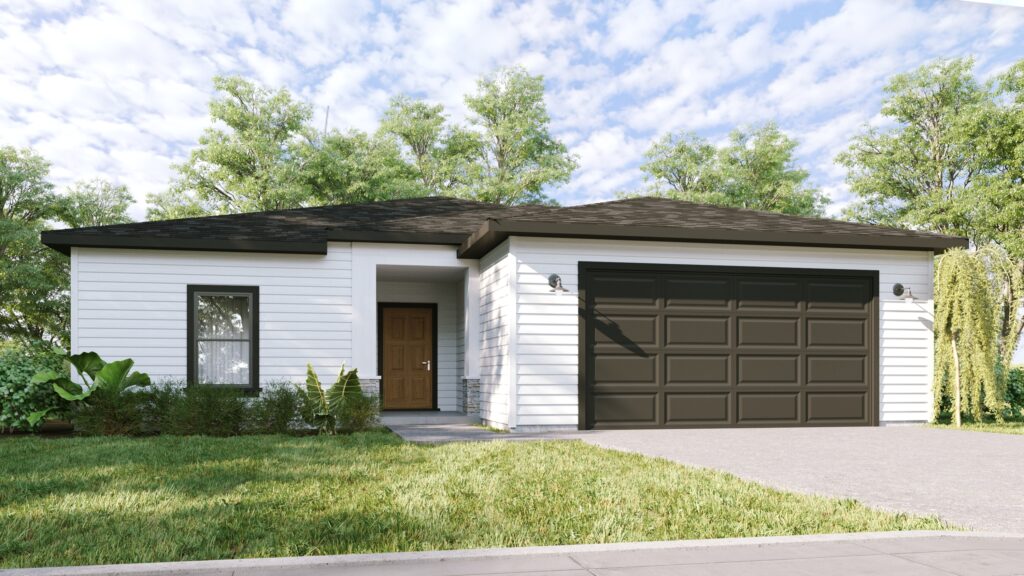


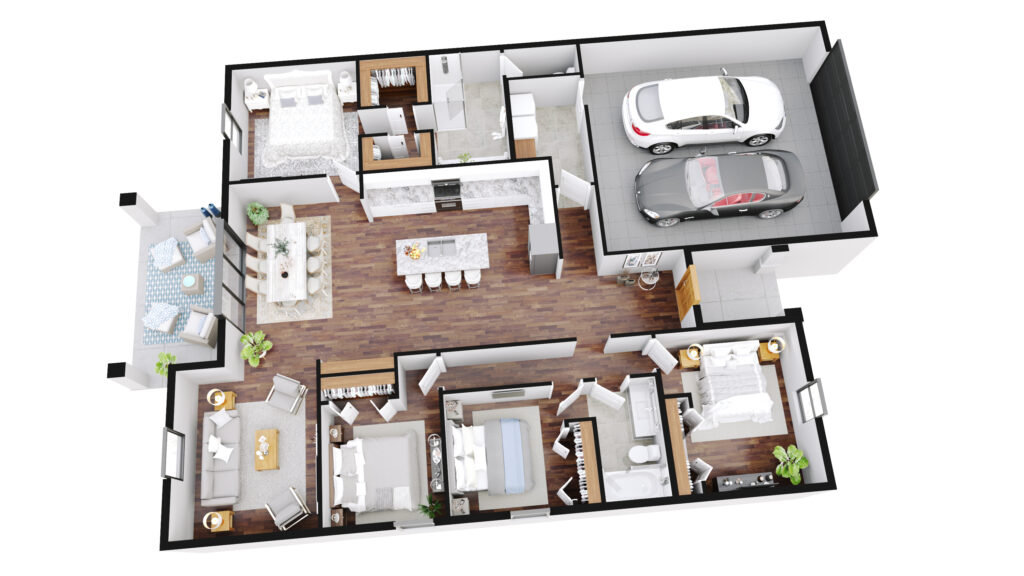
Paxton St
Lehigh Acres, Florida
 2 Parking
 $409,900
$2,600
2023
$214
0.6%
B+
6.0%
$2,054
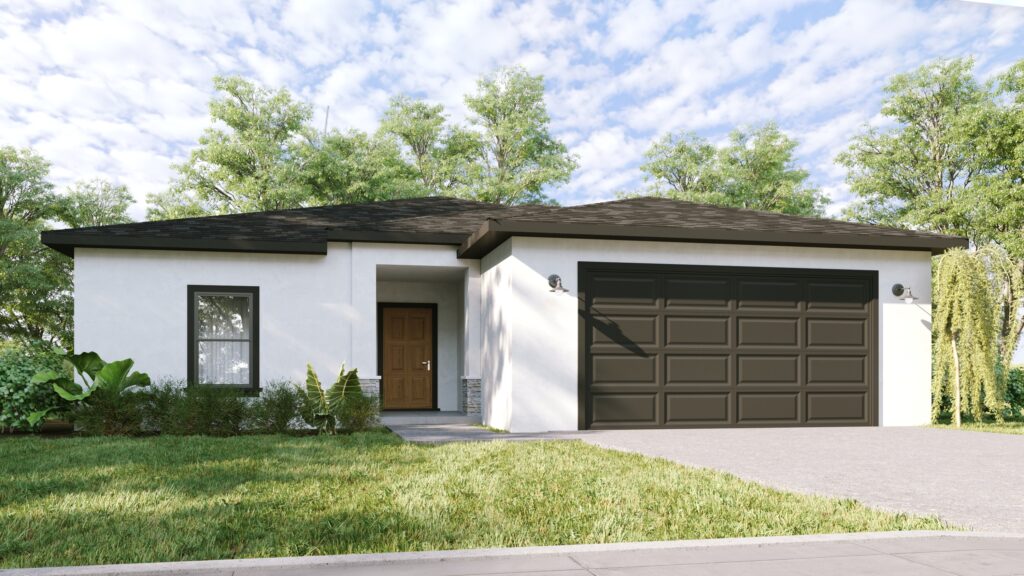
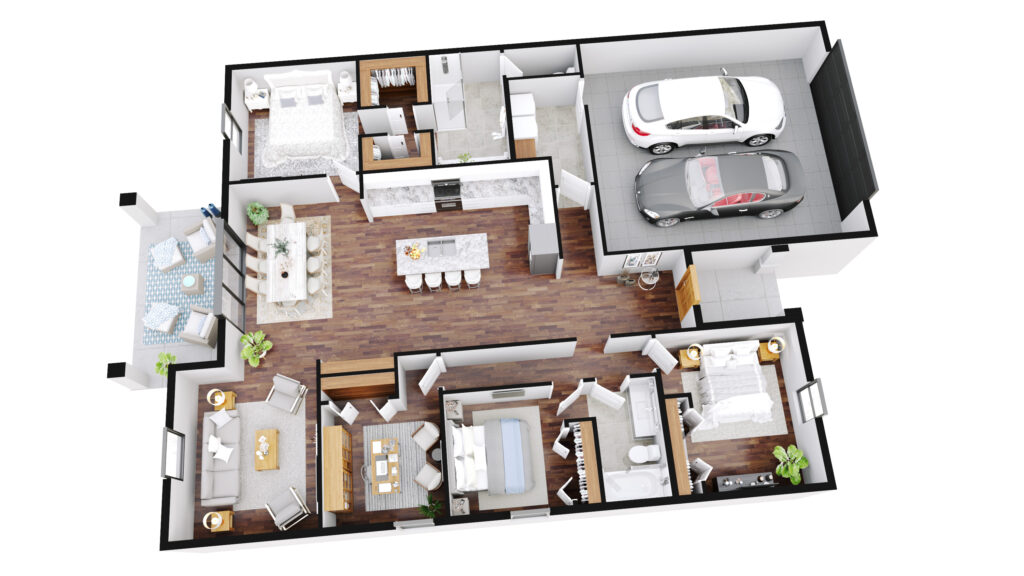
Poplar St
Lehigh Acres, Florida
2 Parking $409,900
$2,700
2023
$214
0.7%
B+
6.3%
$2,149
Pullman
Lehigh Acres, Florida
2 Parking $409,900
$2,700
2023
$214
0.7%
B+
6.3%
$2,149
Peerless St
Lehigh Acres, Florida
2 Parking $409,900
$2,550
2022
$214
0.6%
B+
5.9%
$2,007
Cape Coral is a relatively large coastal city (i.e. on the ocean, a bay, or inlet) located in the state of Florida. With a population of 157,476 people and 29 constituent neighborhoods, Cape Coral is the 11th largest community in Florida.
Unlike some cities where white-collar or blue-collar occupations dominate the local economy, Cape Coral is neither predominantly one nor the other. Instead, it has a mixed workforce of both white- and blue-collar jobs. Overall, Cape Coral is a city of sales and office workers, service providers and professionals. There are especially a lot of people living in Cape Coral who work in office and administrative support (15.89%), sales jobs (14.84%) and management occupations (8.39%).
Because of many things, Cape Coral is a great place for families with children to consider. First of all, many other families with children live here, making Cape Coral a place where both parents and children are more likely to develop social ties with other families, as well as find family-oriented services and community. The city’s good public school district and large population of college-educated adults provide an environment conducive to academic values. With regard to real estate, Cape Coral has a high rate of owner-occupied single family homes, which tends to reflect stability in the local community. Finally, Cape Coral’s overall crime rate is lower than average for the country.
Cape Coral is also nautical, which means that parts of it are somewhat historic and touch the ocean or tidal bodies of water, such as inlets and bays. Such areas are often places that visitors and locals go for waterfront activities or taking in the scenery.
Cape Coral Information and Demographics
In terms of college education, Cape Coral is nearly on par with the US average for all cities of 21.84%: 20.44% of adults 25 and older in Cape Coral have a bachelor's degree or advanced degree.
The per capita income in Cape Coral in 2010 was $25,090, which is middle income relative to Florida, and upper middle income relative to the rest of the US. This equates to an annual income of $100,360 for a family of four. However, Cape Coral contains both very wealthy and poor people as well.
The people who call Cape Coral home describe themselves as belonging to a variety of racial and ethnic groups. The greatest number of Cape Coral residents report their race to be White, followed by Black or African-American. Cape Coral also has a sizeable Hispanic population (people of Hispanic origin can be of any race). People of Hispanic or Latino origin account for 19.45% of the city’s residents. Important ancestries of people in Cape Coral include German, Italian, Irish, English and Polish.
Cape Coral also has a high percentage of its population that was born in another country: 15.27%.
The most common language spoken in Cape Coral is English. Some people also speak Spanish.
Information by Department of Numbers, Bureau of Labor Statistics, U.S. Census Bureau and Locatoin Incorporated are deemed reliable but not guaranteed.
Cape Coral APPRECIATION RATE
| TIME PERIOD | TOTAL APPRECIATION | AVG. ANNUAL RATE | COMPARED TO State* | COMPARED TO AMERICA* |
|---|---|---|---|---|
| Latest Quarter: 2023 Q3-2023 Q4 |
0.00% | 0.00% | ||
| Last 12 Months: 2022 Q4-2023 Q4 |
0.00% | 0.00% | ||
| Last 2 Years: 2021 Q4-2023 Q4 |
0.00% | 0.00% | ||
| Last 5 Years: 2018 Q4-2023 Q4 |
0.00% | 0.00% | ||
| Last 10 Years: 2013 Q4-2023 Q4 |
0.00% | 0.00% | ||
| Since 2000: Q1-2023 Q4 | 0.00% | 0.00% |
RENT & OWNERSHIP
HOME OWNERSHIP RATE
REGIONAL APPRECIATION POTENTIAL
RATINGS: 1=Very Low 2=Low 3=Moderate 4=High 5=Very High
REGIONAL HOUSING MARKET ANALYSIS
HOUSING AFFORDIBALITY TRENDS: CAPE CORAL METRO AREA
Years of average household income needed to buy average home
0.00
Region Historical Low
0.00
Region Historical High
0.00
Current
REGIONAL 1 AND 2 YEAR GROWTH TRENDS
| REGIONAL TREND | LAST 1 YEAR | COMPARED TO NATION* | LAST 2 YEARS | COMPARED TO NATION* |
|---|---|---|---|---|
| Population Growth | 0.00% | 0.00% | ||
| Job Growth | 0.00% | 0.00% | ||
| Income Trends(Wages) | 0.00% | 0.00% | ||
| Unemployment Trend | 0.00% | 0.00% | ||
| Stock Performance of Region's Industries | 0.00% | 0.00% | ||
| Housing Added | 0.00% | 0.00% | ||
| Vacancy Trend | 0.00% | 0.00% |
Check Back Often for New Investment Opportunities!

Real estate is the most powerful way to accumulate wealth, and more people have become millionaires through real estate than any other means.
This guide has been written in an effort to help educate all real estate investors regardless of their experience.
Dedicated to all investors who want the very best deals!
The advantages of income-generating real estate.
How to analyze properties, cash-flow and returns.
How to choose the best markets and neighborhoods.