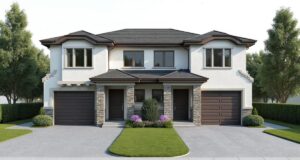
Thinking about investing in real estate for rental income in 2026? If you're looking for a smart way to make your money work for you, buying a duplex or triplex is a fantastic option. These smaller multi-family buildings are often more affordable than large apartment complexes, and they give you the chance to earn money from more than one tenant at a time. This means more income and less risk if one unit happens to be empty. In 2026, I believe several cities offer incredible opportunities for investors looking to get into the duplex and triplex market for solid rental income.
Best Cities to Buy a Duplex or Triplex for Rental Income in 2026
Why Duplexes and Triplexes Make Sense for Investors in 2026
As a real estate investor myself, I've seen firsthand how powerful duplexes and triplexes can be. They're often called “small multifamily properties,” and for good reason. Here’s why I think they’re a winner, especially now:
- More Income, Less Risk: With two or three units under one roof, you get multiple income streams. If one tenant moves out, you still have income from the other unit(s). This is a big deal when it comes to keeping your investment steady.
- House Hacking Potential: This is a game-changer for new investors, or anyone looking to save money. If you live in one of the units, you can often use loans like an FHA loan, which means a lower down payment. Plus, the rent from your other tenants can help pay down your mortgage, significantly reducing your own living expenses. I’ve seen so many people get started this way!
- Economies of Scale: Think about it: one roof, one foundation, and often one water heater for two or three homes. This means that when you need to do repairs or maintenance, the costs are spread out. It’s usually more efficient and cost-effective than owning two separate single-family homes.
- Easier Financing: Because they are considered residential properties when you plan to live in one unit, you can often qualify for owner-occupant loans, which have better terms and lower down payment requirements than purely investment property loans.
- Scalability: Once you get comfortable with one duplex or triplex, you can often use the equity and cash flow from your first property to buy another, building your portfolio steadily.
The real estate market in 2026 is settling down after some wild years. While rent growth might not be sky-high everywhere, new construction is slowing, which should help keep vacancies from getting too bad. I’m seeing the most promise in the Midwest and certain parts of the South, where you can still find affordable properties with good demand from renters.
Top Cities to Consider for Duplex/Triplex Investments in 2026
After looking at a lot of data and market trends, I've identified a few cities that really stand out for investors focused on rental income from duplexes and triplexes. These places offer a good mix of affordability, strong rental demand, and landlord-friendly environments.
| City | State | Average Duplex Price (Est. 2026) | Estimated Gross Yield | Key Industries | Landlord Friendliness |
|---|---|---|---|---|---|
| Cleveland | Ohio | $175,000 – $190,000 | 9-11%+ | Healthcare, Manufacturing | Moderate |
| Detroit | Michigan | $150,000 – $200,000 | 11%+ | Automotive, Manufacturing | Moderate |
| Indianapolis | Indiana | $200,000 – $250,000 | 7-9% | Logistics, Healthcare, Education | High |
| Memphis | Tennessee | $150,000 – $200,000 | 7-8%+ | Healthcare, Logistics, Music/Tourism | High |
| Columbus | Ohio | Varies, good inventory | Competitive | Education, Government, Tech | Moderate |
| San Antonio | Texas | Higher than Midwest, solid yields | 6-8%+ | Military, Energy, Tech | High |
(Note: Prices and yields are estimates based on current market trends and projections for 2026. Always do your own thorough research.)
Let's dive a little deeper into why these cities are on my radar:
1. Cleveland, Ohio
Cleveland is a fantastic choice if you're looking for high yields and don't want to break the bank to get started. I love that you can often find duplexes here for around $175,000 to $190,000. The demand for rentals is strong, thanks in part to major employers like the Cleveland Clinic. Many tenants here are working-class folks, and it's also a solid market for Section 8 rentals. I've seen gross yields in the 9-11% range, and even higher if you find a property that needs a little cosmetic work (what we call “value-add”). Vacancy isn't usually a big problem if you screen your tenants well. It's also a great place to try out house hacking. Property taxes are generally reasonable, but remember that older homes can sometimes mean higher maintenance costs.
2. Detroit, Michigan
If affordability is your top priority, Detroit is hard to beat. You can find duplexes in good neighborhoods for under $200,000, sometimes even under $150,000. This can lead to some of the highest cap rates (which is basically a measure of return on investment) in the multi-family space, often hitting 11% or more. The city has seen a lot of revitalization, and jobs in the auto and manufacturing sectors are steady. There's definitely a strong demand for rentals. However, Detroit can be a bit of a high risk, high reward market. You really need to focus on specific neighborhoods that are either stable or showing signs of growth. Some areas might have higher vacancy rates, so careful research is key. For investors laser-focused on cash flow, Detroit is very compelling.
3. Indianapolis, Indiana
Indianapolis offers a nice balance for investors. It’s a growing city with a steady influx of people and jobs, and the state has policies that are generally good for landlords. You can expect to pay around $200,000 to $250,000 for a duplex. The yields are typically in the 7-9% range, and vacancy rates are usually quite low, around 5%. This makes it a good market for both consistent cash flow and some potential for your property's value to go up over time. The economy is diverse, with strengths in logistics, healthcare, and education. It’s also a more affordable place to live compared to the big coastal cities, with good infrastructure.
4. Memphis, Tennessee
One of the biggest draws of Memphis is that Tennessee has no state income tax. This means more of your rental income stays in your pocket. Properties are affordable, with duplexes often falling between $150,000 and $200,000. Rental demand is high because a large percentage of people rent rather than own. You can expect yields around 7-8%. Key industries include healthcare, logistics, and the famous music and tourism scene. It’s also a city that welcomes Section 8 tenants. Just be prepared to be hands-on with property management, as some neighborhoods might require more attention.
5. Columbus, Ohio
Columbus is another Ohio gem with a robust economy fueled by education (Ohio State University), government, and a growing tech sector. The city is experiencing steady population growth, which naturally leads to good rental demand. While prices might be a bit higher than Cleveland or Detroit, you can still find competitive yields and affordable multi-family options. I see Columbus as a good market for investors looking for a balanced risk profile and long-term investment.
6. San Antonio, Texas
While Texas cities tend to be a bit pricier than those in the Midwest, San Antonio (and some Houston suburbs) offers a strong case for investors. Again, no state income tax is a huge plus. The job market is strong, with significant growth in the military, energy, and tech sectors, and the population is booming. Duplex yields are solid, usually in the 6-8% range, and despite slightly higher property prices, the demand from renters who are priced out of buying is consistently high. It’s a landlord-friendly state overall.
A Word of Caution: I’d advise being a bit cautious in areas of the Sun Belt that saw a massive boom in construction over the last few years. Some of those markets might have oversupply and softening rents in early 2026. Also, the super-expensive coastal cities generally don’t offer the kind of rental yields that make duplexes and triplexes a great income play.
What I Look For Before Buying: My Investor Checklist
Buying a duplex or triplex is more than just picking a city. You have to do your homework! Here’s what I always consider:
- Deep Market Research: I don’t just look at one website. I check local real estate listings (like Zillow or Redfin), talk to local real estate agents who specialize in multi-family properties, and look at vacancy rates. I also drive around the neighborhoods myself to get a feel for them. Are the schools good? Is crime low? Are there good jobs nearby?
- Solid Financial Analysis: My golden rule is often the 1% rule. This means the monthly rent from a property should be at least 1% of the purchase price. For example, if a duplex costs $200,000, I want to see at least $2,000 in monthly rent. I also calculate the capitalization rate (cap rate) and cash-on-cash return to make sure the numbers work. And don't forget to budget for things like insurance (which can be higher in some areas), property taxes, and maintenance. I usually set aside 8-10% of the rental income just for maintenance and repairs.
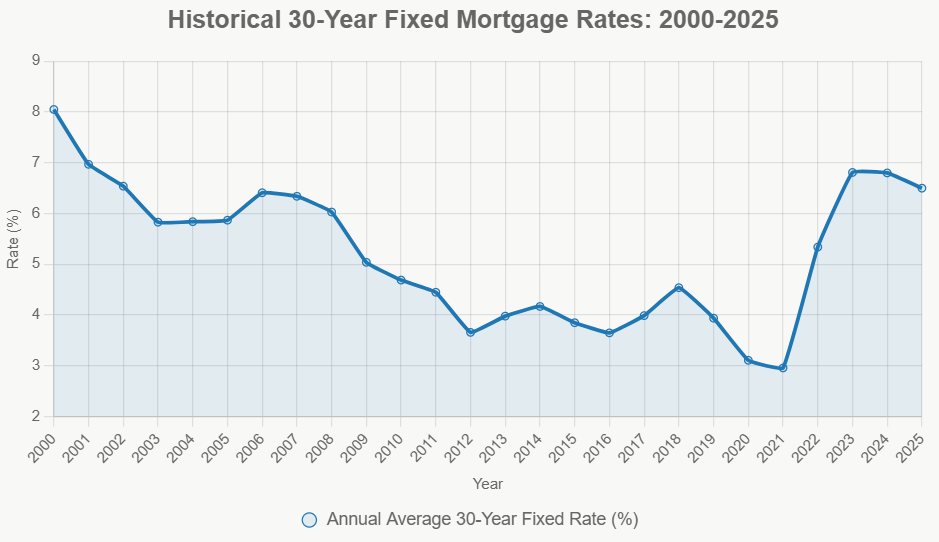
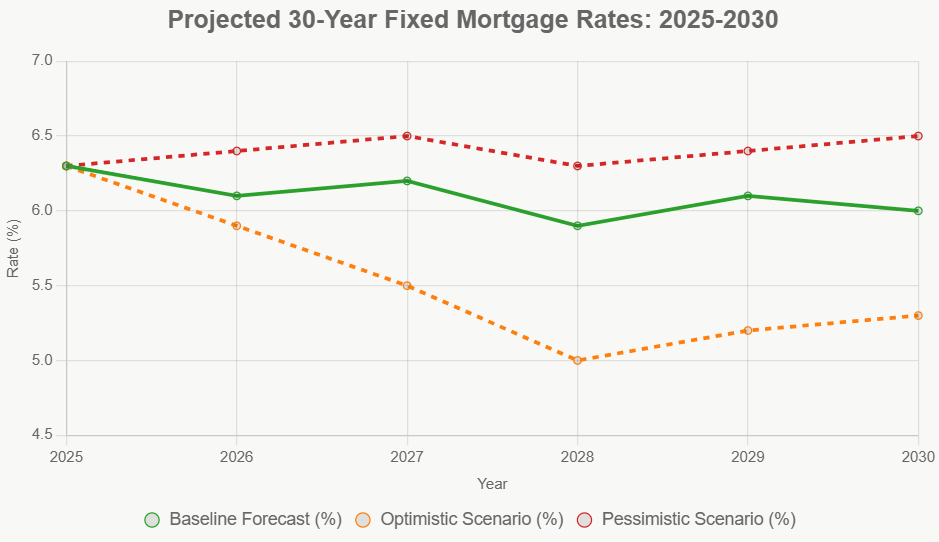
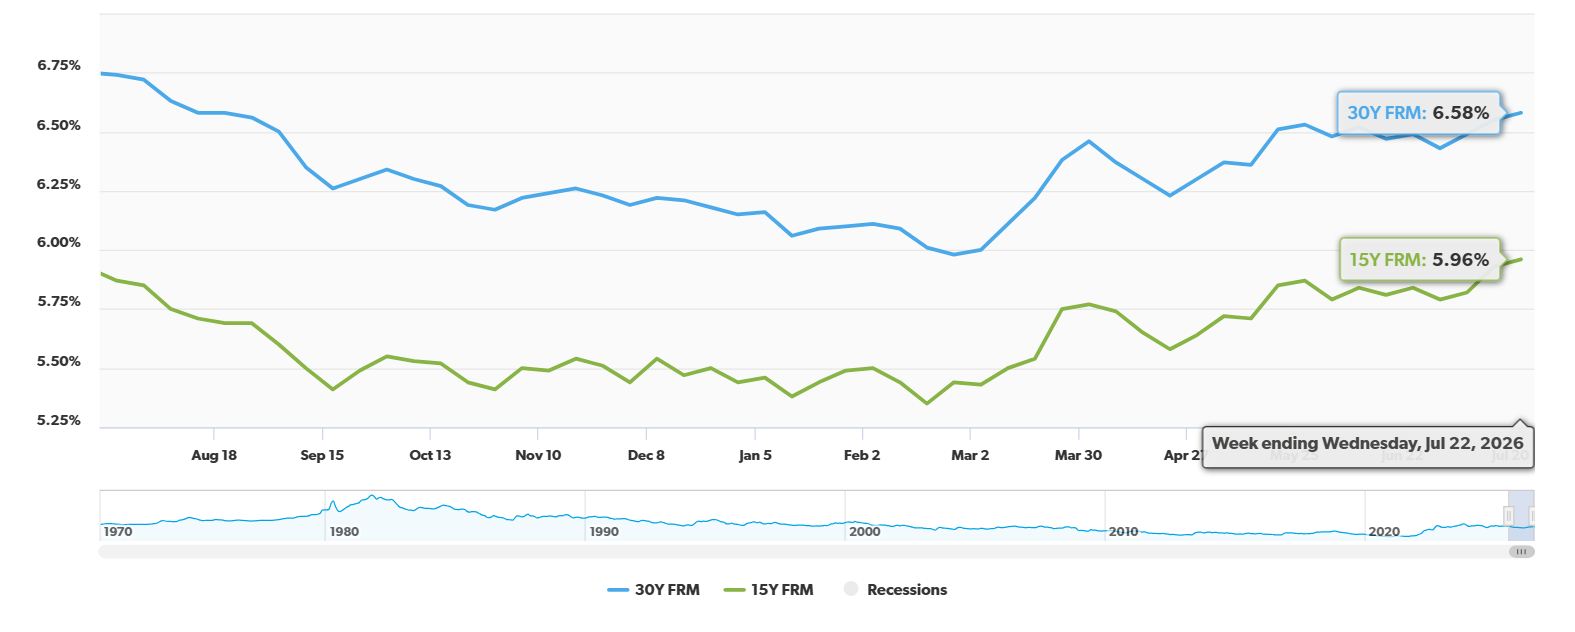
- Smart Financing: If I plan to live in one of the units, I’ll look into FHA loans for the lower down payment. For purely investment properties, I’ll explore conventional loans or portfolio loans. Interest rates in 2026 are expected to be around 6% or higher, so shopping around with different lenders is crucial.
- Thorough Due Diligence: This is super important, especially with older properties. I always get a professional inspection to check the roof, plumbing, electrical systems, and foundation. I also verify that the property is zoned correctly for rental units and check the title for any hidden issues.
- Management Plan: Will I manage the property myself, or will I hire a property manager? For a duplex or triplex, self-management is often doable, especially when you're starting out. Property managers typically charge 8-10% of the monthly rent. Either way, rigorous tenant screening is non-negotiable.
- Tax and Legal Considerations: I make sure to understand the tax benefits, like depreciation, and how I can use strategies like 1031 exchanges if I decide to sell and reinvest. I also check local laws regarding things like eviction processes.
Navigating the 2026 Outlook: Risks and Opportunities
Like any investment, there are risks. Rising interest rates or an economic slowdown could impact tenant’s ability to pay rent. Insurance costs can also increase. However, the opportunities in 2026 are significant. With new construction slowing down, there's a persistent need for housing, and duplexes and triplexes are a cost-effective way to meet that demand.
Ultimately, success in duplex and triplex investing comes down to location within a city (think stable neighborhoods or areas undergoing positive change), running conservative numbers, and being disciplined. These properties offer a powerful way to generate consistent, recession-resilient income and build wealth over time. With the right approach, 2026 is a great year to jump in!
In 2026, select U.S. cities are projected to see surging demand, rising rents, and appreciation—creating prime opportunities for investors seeking passive income and long‑term wealth.
Work with Norada Real Estate to find stable, cash-flowing markets beyond the bubble zones—so you can build wealth without the risks of ultra-competitive areas.
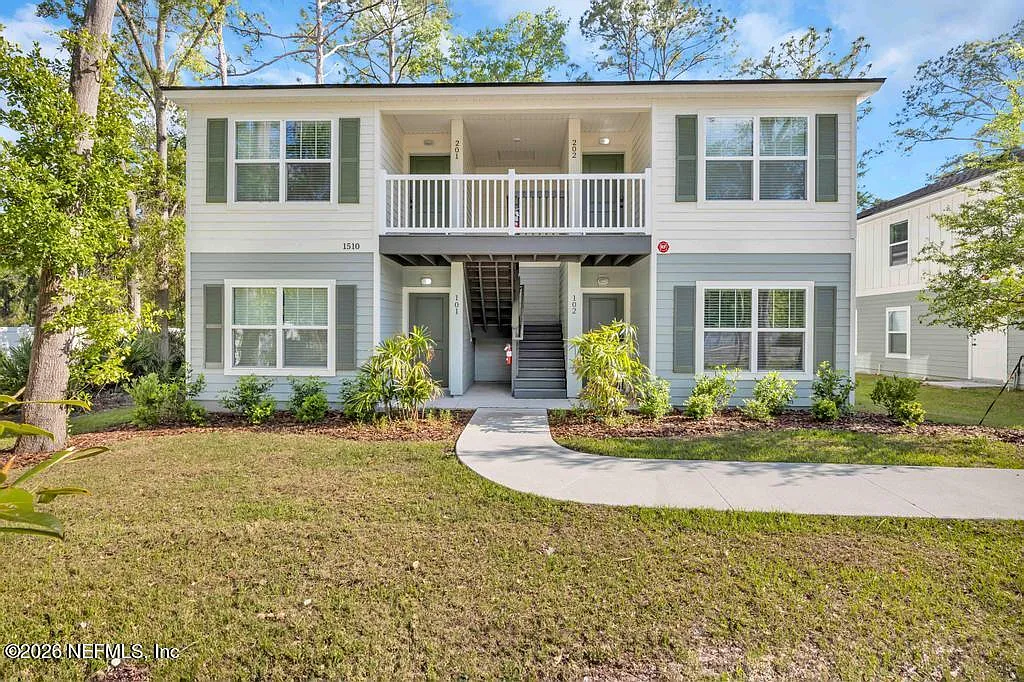
VS
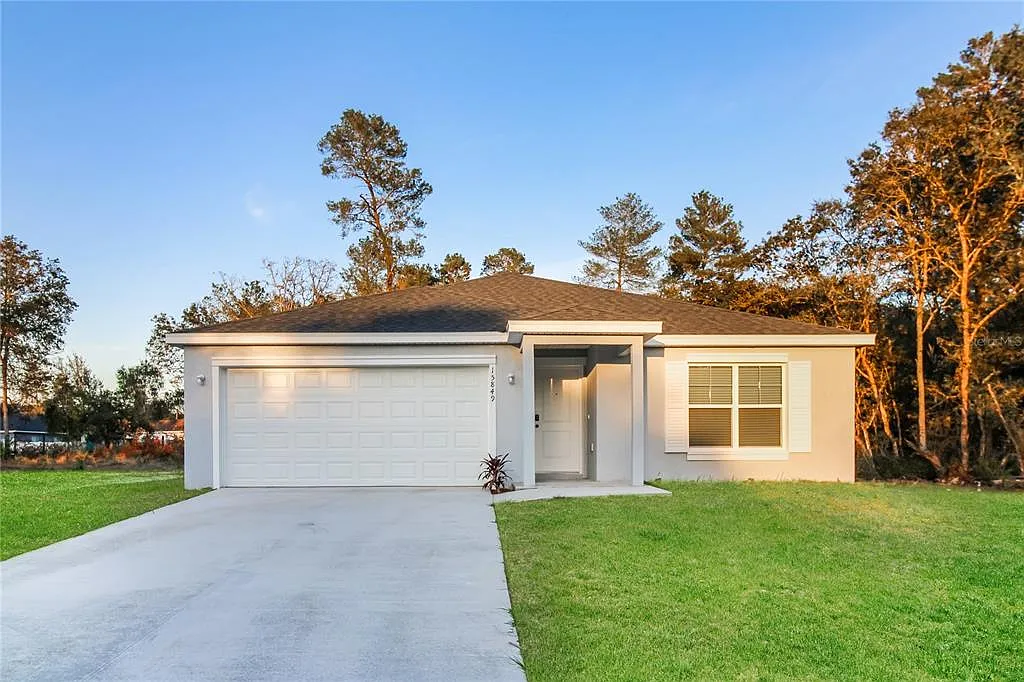
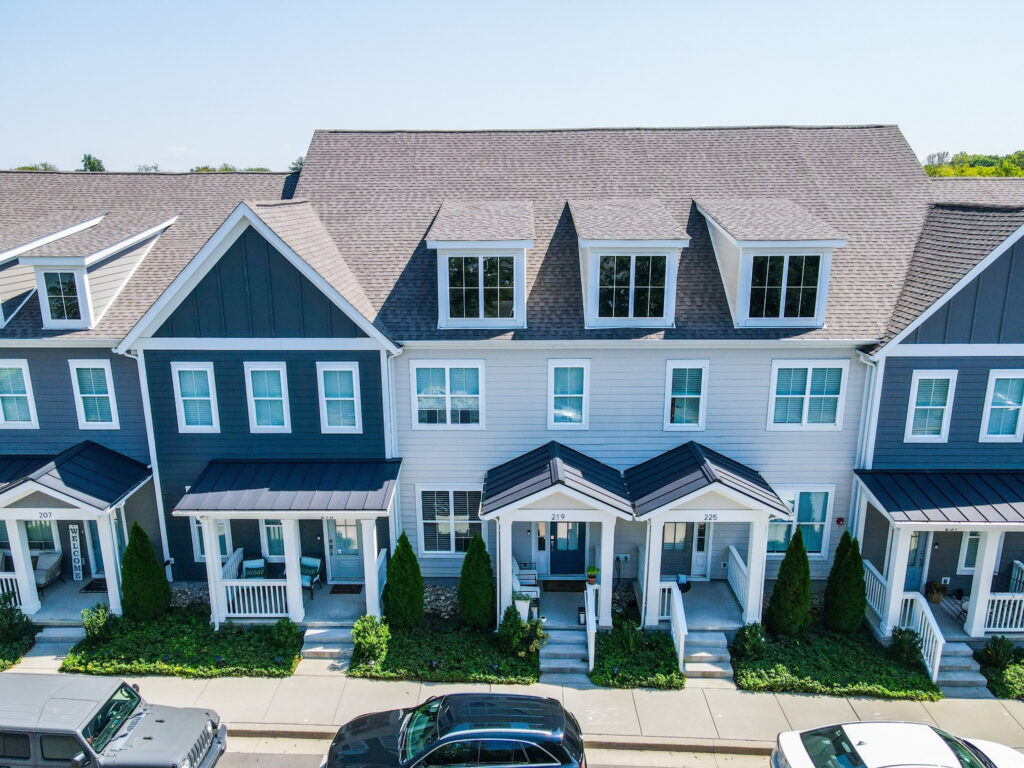
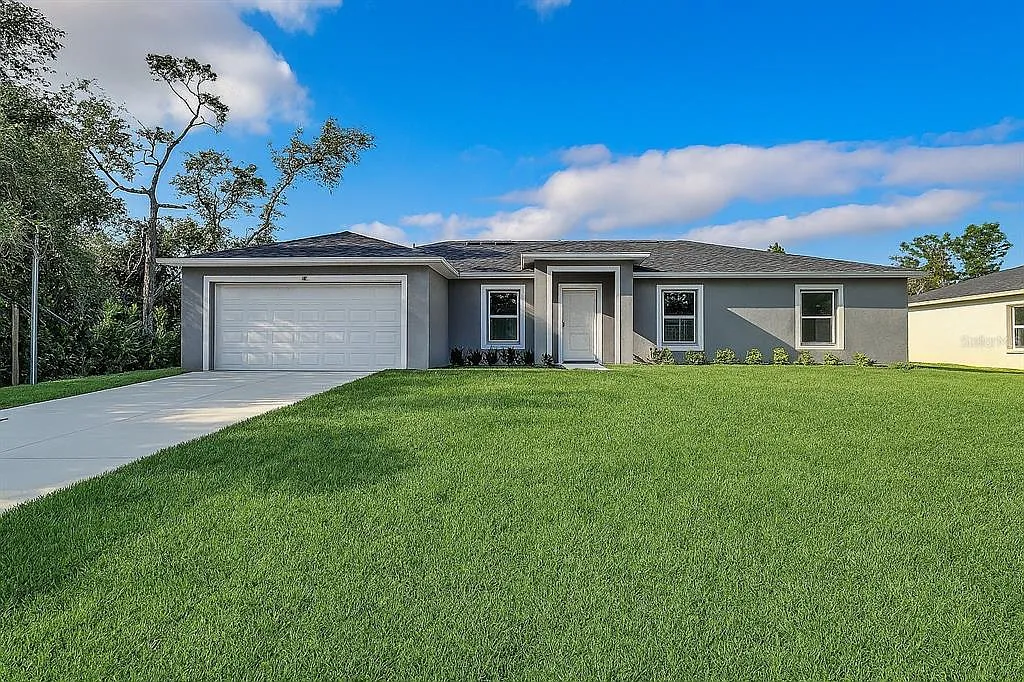
Out‑of‑State investors can compare Jacksonville’s large 8‑bed rental with higher NOI vs Ocala’s newer A‑rated property with steady returns. Which fits YOUR investment strategy?
We have much more inventory available than what you see on our website – Let us know about your requirement.
📈 Choose Your Winner & Contact Us Today!
Speak to a Norada Investment Counselor (No Obligation):
(800) 611-3060
Recommended Read:
- Hottest Housing Markets in 2026: Northeast Leads With Hartford at $475K
- Best Cities in the West to Invest in Real Estate in 2026
- 20 Best Small Cities to Invest in Real Estate in 2026
- Best Places to Invest in Real Estate in 2026
- Top Markets for Out-of-State Real Estate Investing in 2026
- Best Cities to Buy Investment Properties in 2026
- Best Cities to Buy Multi-Family Homes for Investment in 2026
- 10 Cities With the Highest Demand for Rental Properties in 2026
- 20 Cheapest States to Buy a House in 2026
- Best States to Buy a House in 2026
- Best Cities to Buy a House for Investment in 2026
- Best Cities to Buy a House For Rental Income in 2026
- Should You Invest in the Austin or Raleigh Real Estate Market in 2026?
- Dallas vs. Houston: Which City Offers Better Returns for Real Estate Investors
- Single-Family vs. Townhome: Which is the Real Cash Flow Winner for Investors?
- 5 Hottest Florida and Texas Markets for Real Estate Investors in 2025
- Best Places to Invest in Real Estate: November 2024 Hotspots
- How to Secure Your Retirement With Cash-Flowing Rental Properties
- Best Places to Invest in Single-Family Rental Properties in 2025
- 5 Hottest Real Estate Markets for Buyers & Investors in 2025