Thinking about buying or selling a home in Arizona anytime soon? If so, it's crucial to understand that the market is currently experiencing a noticeable cooling, with prices showing a slight decline. However, this doesn't mean it's a bad time to get involved; it simply means opportunities are changing. I believe that by 2026, we'll see a market that's more balanced, offering a steadier, less frenzied environment than what we've witnessed in recent years.
As someone who's been following the Arizona housing scene closely, I can tell you it's a fascinating place right now. It feels less like a runaway train and more like a well-tuned engine humming along. The rapid price surges we saw a few years back have definitely eased up.
According to data from Realtor.com®, as of April 2026, the median listing price in Arizona stands at $468,000, which is actually down 3.51% compared to a year ago. That's a significant shift, and it's creating some breathing room for buyers who might have been priced out.
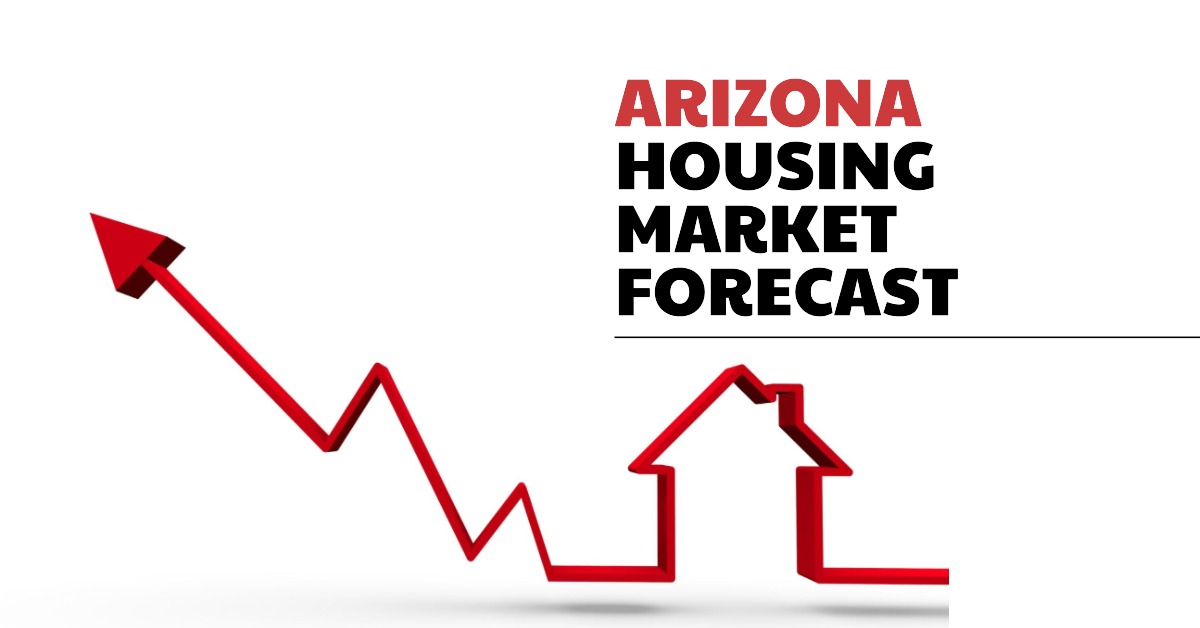
Arizona Housing Market Trends
What's Really Going On in Arizona's Housing World?
Let's dive a bit deeper into what these numbers really mean. The days of bidding wars and homes flying off the market in a matter of days seem to be taking a backseat. Homes are now sitting on the market for an average of 57 days, a slight increase of 7.55% year-over-year. This isn't a dramatic slowdown, but it does signal a shift towards a more typical market where buyers have a bit more time to consider their options.
For sellers, this means it's more important than ever to price their homes realistically and to make sure they're presented in the best possible light. The days of “build it and they will come” are on pause; now it's more about strategic marketing and understanding current buyer expectations.
Key Arizona Market Indicators: A Snapshot
Here's a quick look at some of the most important figures from Realtor.com®'s data library, painted with a broad brush:
| Metric | Statewide | 1-Year Change | 3-Year Change | My Take |
|---|---|---|---|---|
| Median Listing $ | $468,000 | -3.51% | -2.30% | Prices are adjusting, good news for buyers. |
| Median Sold $ | $449,000 | 0.34% | 5.85% | Sold prices are holding up better than list prices. |
| $ per Sq Ft | $262 | -1.50% | 0.77% | Value is still there, but not rising as fast. |
| Active Listings | 69,004 | 3.36% | 43.83% | More homes to choose from, indicating a healthier supply. |
| Median Days on Market | 57 days | 7.55% | 29.55% | Buyers have more time to make decisions. |
| Rental Properties | 31,074 | 21.96% | 158.05% | Rental inventory has exploded. |
| Median Rent | $1,680/mo | -7.13% | -26.64% | Rents have significantly decreased, making it cheaper to rent. |
It's fascinating to see how the number of active listings has jumped by a substantial 43.83% over the last three years. This increased inventory is a direct contributor to the more balanced market we're seeing. Buyers aren't scrambling for the last available house; they have options.
The Rental Market: An Affordable Alternative?
While the sales market is cooling, the rental market has seen some dramatic shifts. The median rent has actually fallen by 7.13% year-over-year, and a massive 26.64% over three years. With 31,074 rental properties listed, a staggering 158.05% increase from three years ago, renters are finding themselves in a much more favorable position. If you're considering your housing options, renting in Arizona right now looks incredibly appealing from a cost perspective. This could be a game-changer for individuals and families looking to save money or those who prefer flexibility.
Arizona Housing Market Forecast for 2026
So, what does this all mean for the Arizona housing market and forecast for 2026? I'm optimistic. My gut feeling, backed by these trends, is that we're moving towards a more sustainable and predictable market.
Here's what I anticipate:
- Stabilized Prices: While drastic price drops are unlikely, I don't foresee a return to the rapid price appreciation of a few years ago. Prices will likely stabilize or see modest growth. This means homes will still be a good investment, but without the speculative frenzy.
- Increased Buyer Confidence: With more inventory and less pressure, buyers will feel more empowered. This could lead to more informed decision-making and a stronger sense of homeownership security. I expect to see a gradual increase in sales as buyers feel more comfortable re-entering the market.
- Continued Rental Affordability: The surge in rental properties and the subsequent drop in rents are likely to continue, at least in the short to medium term. This will remain an attractive option for many and could even influence some who were considering buying to rent for a bit longer.
- Focus on Value: As the market becomes more balanced, buyers will pay closer attention to the overall value. This includes not just the price of the home but also its location, amenities, and potential for future appreciation. The price per square foot ($262 statewide) will become an even more crucial metric for smart shoppers.
- Geographic Nuances: It's important to remember that Arizona is not a monolith. Different cities and regions will experience these trends differently. For example, while Phoenix might see steady demand, areas with a higher concentration of vacation rentals might experience different dynamics.
City-Specific Insights: Where Should You Look?
Let's peek at some of the major players in Arizona's housing scene. This table gives you a raw look at what's happening right now, based on Realtor.com® data:
| City | Median Listing Price | Listing $ / Sq Ft | Median Monthly Rental Price | My Observation |
|---|---|---|---|---|
| Phoenix | $485,000 | $294 | $1,549/mo | Still a major hub, but prices are coming down a bit. Good variety for buyers and renters. |
| Tucson | $369,000 | $229 | $1,329/mo | More affordable option, attractive for those seeking value. Rental prices are quite low here. |
| Scottsdale | $1,059,500 | $460 | $2,345/mo | Remains a high-end market, but even here, price growth has slowed. |
| Mesa | $452,000 | $268 | $1,454/mo | A solid middle-ground, offering good value for money. |
| Surprise | $444,000 | $232 | $1,990/mo | Interesting rental market here with higher median rents. |
| Buckeye | $430,000 | $227 | $2,090/mo | Similar to Surprise, rental prices are on the higher side. |
| San Tan Valley | $449,900 | $222 | $2,030/mo | New developments meaning more options, and competitive rental prices. |
| Prescott | $789,900 | $342 | $2,015/mo | A popular destination with higher price points, attracting a different demographic. |
It's clear that places like Scottsdale continue to command premium prices, but even there, the market dynamics are shifting. For buyers looking for more affordability, Tucson and Yuma are offering significantly lower entry points. What's also intriguing is the variation in rental prices, with some suburban areas like Buckeye and San Tan Valley showing higher median rents than major cities like Phoenix. This could be driven by specific community developments or a lack of rental supply in those particular areas.
My Opinion: Patience and Strategy
My overarching advice for anyone looking at the Arizona housing market in the lead-up to 2026 is to exercise patience and have a clear strategy. It's not the time for impulse buys or desperate selling.
- For Buyers: Get pre-approved for a mortgage and understand your budget. Take your time to explore different neighborhoods and homes. Don't be afraid to negotiate, but also be prepared to make a strong offer on a home you truly love. The increased inventory means you have the luxury of choice.
- For Sellers: Focus on presentation and realistic pricing. Work with a knowledgeable real estate agent who understands current market conditions. The days of simply listing a home and waiting for multiple offers are likely over for now.
The Arizona housing market is a dynamic beast, always evolving. Understanding these trends, combined with a bit of foresight, will put you in a great position whether you're looking to plant roots or sell your current property. The coming years promise a more balanced, predictable, and, in my opinion, a more rewarding experience for buyers and sellers alike.
Beat Inflation & Retire Early with Turnkey Rentals
Turnkey real estate offers powerful tax benefits, monthly cash flow, and long-term equity growth—ideal for early retirement planning.
Norada Real Estate helps you invest in inflation-resistant markets with strong rental demand and built-in tax advantages like depreciation and 1031 exchanges.
🔥 HOT NEW LISTINGS JUST ADDED! 🔥
Talk to a Norada investment counselor today (No Obligation):
(800) 611-3060
Recommended Read:
- Phoenix Housing Market: Trends and Forecast 2025-2026
- 12 Best Places to Live in Arizona
- When Will the Housing Market Crash in Arizona?
- Arizona's Housing Crisis: Young Adults Struggling to Find Home
- Scottsdale Housing Market: Trends and Forecast
- Tucson Housing Market Trends and Forecast
- Top 10 Priciest States to Buy a House by 2030: Expert Predictions
- 10 Best Real Estate Markets for Investors in 2025


