If you're thinking about buying a home, the news isn't exactly sunshine and rainbows right now. The average rate for a 30-year fixed mortgage has crept up to 6.55%, and this jump is making it harder for many folks to afford their dream home. It's a tough pill to swallow when you're ready to put down roots, and seeing those numbers climb can really put a damper on your plans.
30-Year Fixed Mortgage Rate Jumps to 6.55%, Cooling Buyer Demand
What's Happening with Mortgage Rates?
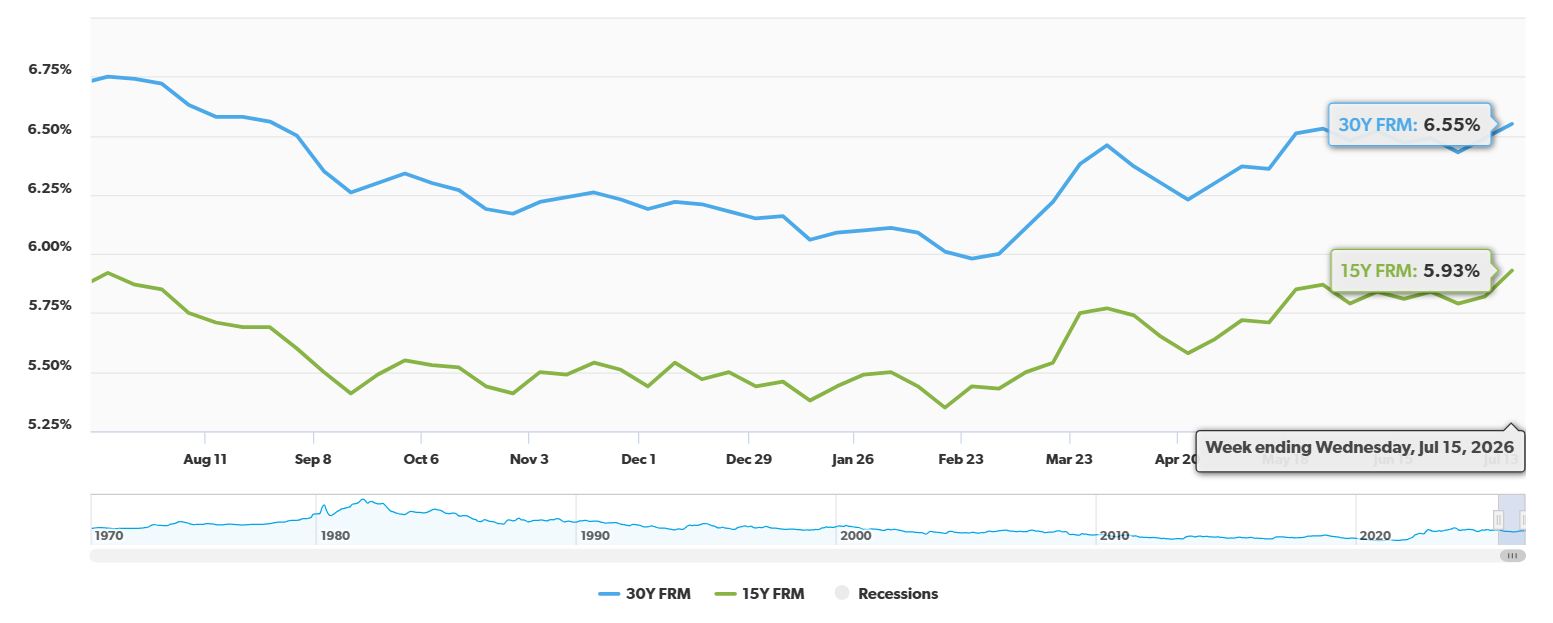
Every week, Freddie Mac puts out a report called the Primary Mortgage Market Survey. It's like the scorekeeper for mortgage rates across the country. This week, the news from their July 16, 2026 report is that the average 30-year fixed-rate mortgage is now 6.55%. Now, that might not sound like a huge jump, but let me tell you, even small increases matter a lot when you're talking about buying a house.
Just last week, that same rate was at 6.49%. So, it's gone up a little. Compared to this time last year, when it was 6.75%, it's actually a bit lower, which is a small silver lining. But the recent upward tick is what's really catching people's attention and making them pause.
It's not just the 30-year loans either. The 15-year fixed-rate mortgage also saw a bump, going from 5.82% last week to 5.93% this week. A year ago, this rate was at 5.92%, so it's also seen a slight rise.
Why This Matters to You
When mortgage rates go up, your monthly payments go up too. This means that for the same house, you'll end up paying more each month to the bank. This extra cost can push a lot of potential buyers out of the market. They might have to look for smaller homes, homes in less desirable areas, or simply put their homeownership dreams on hold until rates come back down. It's like trying to buy a toy when the price suddenly goes up – sometimes you just have to walk away for now.
A Look at the Numbers: Freddie Mac's Survey
To really see what's going on, let's break down the numbers from Freddie Mac's latest survey.
| Loan Type | Average Rate (July 16, 2026) | Change from Last Week | Change from Last Year |
|---|---|---|---|
| 30-Year Fixed-Rate | 6.55% | +0.06% | -0.20% |
| 15-Year Fixed-Rate | 5.93% | +0.11% | +0.01% |
Source: Freddie Mac Primary Mortgage Market Survey, July 16, 2026
As you can see, the 30-year fixed-rate mortgage has nudged up. Even though it's still lower than a year ago, that recent climb is what's causing the current squeeze for buyers.
What the Experts Are Saying
I've been in the real estate game for a while now, and I've seen these kinds of ups and downs before. Sam Khater, the Chief Economist at Freddie Mac, mentioned a few things that are really shaping the market right now.
- Demand is Weakening: He pointed out that people are applying for home loans less often. This makes sense! When the cost of borrowing money goes up, people tend to step back and wait. They might be hoping rates will drop or they're rethinking their budget.
- More Homes Are Available: On the flip side, there are more homes on the market than there used to be. This is actually good news for buyers who are still in the game. It means they have more choices and might not have to rush into a decision or get into bidding wars.
- Affordability is Tricky: While the higher rates are a problem, Khater also noted that when you look at the bigger picture of how affordable homes are, and the fact that there are more homes to choose from, things are modestly improving for buyers. This is a bit of a mixed bag, I know! It's like saying, “Yes, it's harder to get the car you want because the price went up, but hey, there are more cars on the lot now!”
My Take on the Situation
From my experience, this is a pretty common cycle. When interest rates rise, the immediate effect is that people's monthly housing payments increase. For someone with a budget, this can mean they can no longer qualify for the home they were looking at. They might have to settle for something smaller, or delay their purchase.
I often talk to clients who have been saving diligently for a down payment and are pre-approved for a certain loan amount. Then, rates jump, and suddenly that pre-approval amount shrinks, or their desired monthly payment becomes unaffordable. It's frustrating, and I see it firsthand.
However, it's also important to remember that housing inventory is key. When rates were super low, everyone rushed to buy, and there weren't enough homes to go around. Now, with higher rates, some buyers are sitting on the sidelines, which can help ease the competition for those who can still afford to buy. This can lead to less intense bidding wars and sometimes even homes sitting on the market a bit longer, giving buyers more negotiating power.
The long-term trend is what I always tell my clients to focus on. While today's rates might be a hurdle, real estate has historically been a solid investment. The current situation is a test of patience and careful financial planning.
What Should You Do?
If you're a potential homebuyer right now, here's what I'd suggest:
- Talk to a Lender: Get a clear picture of what you can afford at today's rates. Don't rely on old pre-approvals if they're not recent.
- Know Your Budget: Be firm about your maximum monthly payment, including principal, interest, taxes, and insurance.
- Explore Your Options: Look at different neighborhoods or consider homes that might need a little updating if that fits your budget.
- Don't Panic: While the rates are higher, they can also come down. The market is always moving.
- Keep an Eye on Inventory: With more homes available, you might find a great deal.
Looking Ahead
It's a dynamic market, and things can change. While the 30-year fixed mortgage rate rise is definitely impacting buyer demand, it's not the end of the road for everyone. For those who are well-prepared and patient, opportunities will still exist. The key is to stay informed and make smart decisions based on your own financial situation.
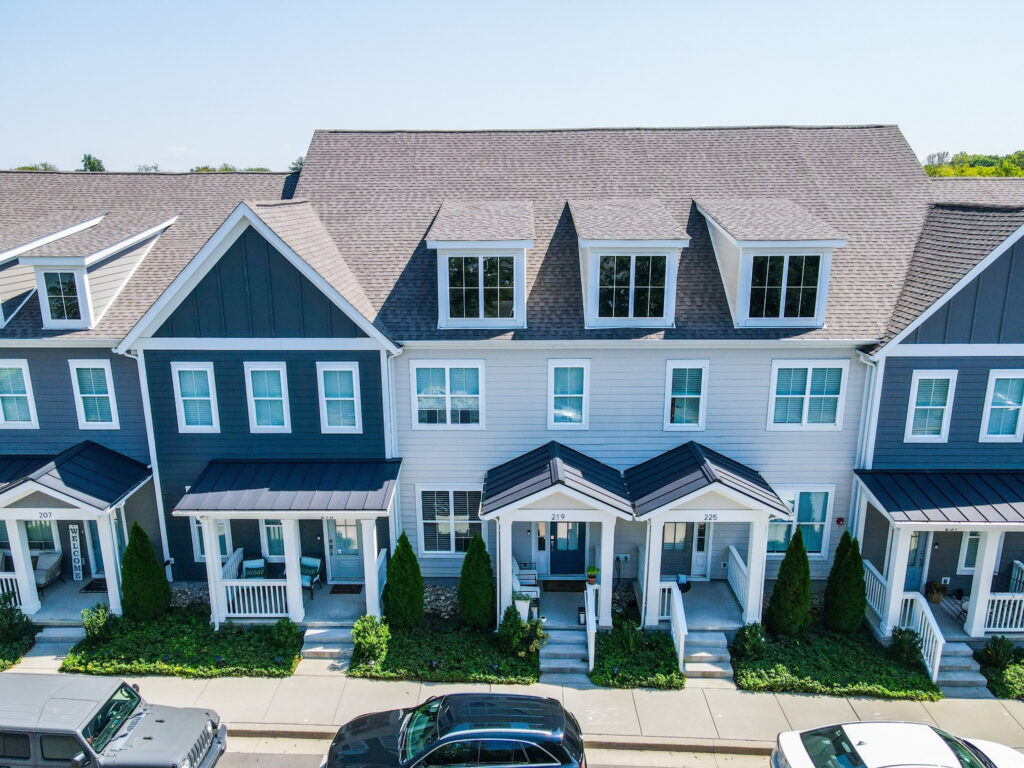
VS
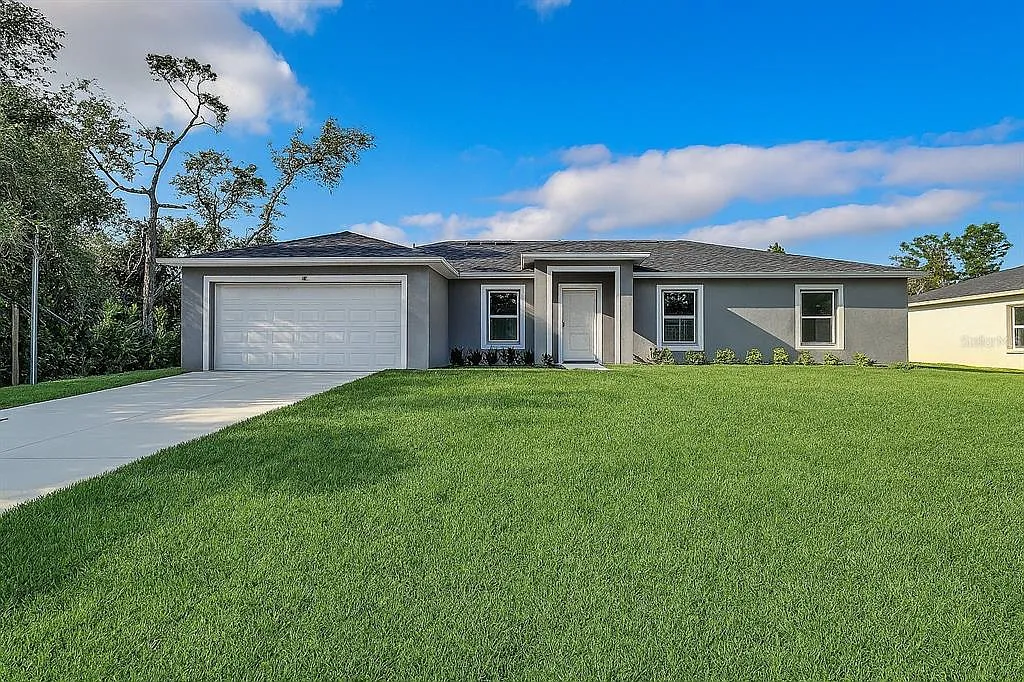
Out‑of‑State investors can compare Tennessee’s newer rental with higher NOI vs Florida’s A+ property with strong yield. Which fits YOUR investment strategy?
We have much more inventory available than what you see on our website – Let us know about your requirement.
📈 Choose Your Winner & Contact Us Today!
Speak to a Norada Investment Counselor (No Obligation):
(800) 611-3060
Mortgage rates remain near 6%, but rental properties continue to deliver strong cash flow and appreciation. Savvy investors know that turnkey real estate is the path to passive income and long‑term wealth.
Norada Real Estate helps you secure turnkey rental properties designed for immediate cash flow and appreciation—so you can invest smartly regardless of interest rate trends.
Also Read:
- Will Mortgage Rates Drop to 5% in 2026: Expert Forecast
- How to Get a 3% Mortgage Rate in 2026 With Assumable Mortgages?
- How to Get a 4% Interest Rate on a Mortgage in 2026?
- What Leading Housing Experts Predict for Mortgage Rates in 2026
- Mortgage Rate Predictions for 2026: What Leading Forecasters Expect
- Mortgage Rate Predictions for the Next 3 Years: 2026, 2027, 2028
- 30-Year Fixed Mortgage Rate Forecast for the Next 5 Years
- 15-Year Fixed Mortgage Rate Predictions for Next 5 Years: 2025-2029
- Will Mortgage Rates Ever Be 3% Again in the Future?
- Mortgage Rates Predictions for Next 2 Years
- Mortgage Rate Predictions for Next 5 Years
- Mortgage Rate Predictions: Why 2% and 3% Rates are Out of Reach
- How Lower Mortgage Rates Can Save You Thousands?
- How to Get a Low Mortgage Interest Rate?
- Will Mortgage Rates Ever Be 4% Again?