Norada Real Estate Investments

  • Home
  • Markets
  • Properties
  • Membership
  • Podcast
  • Learn
  • About
  • Contact

California Housing Market: Forecast and Trends 2025-2026

November 24, 2025 by Marco Santarelli

California Housing Market: Trends and Forecast 2024-2025

The California housing market in October saw a definite uptick in activity, with home sales climbing to their highest point since February. If you're thinking about buying or selling a home in the Golden State, understanding these recent movements is key. The CALIFORNIA ASSOCIATION OF REALTORS® (C.A.R.) reported a solid performance for October 2025, showing that despite some lingering economic worries, the desire for homeownership in California remains strong.

This rise in sales isn't just a minor blip; it indicates a growing momentum in the market. While we're not quite at the level of 300,000 units sold annually, the pace picked up significantly compared to both the previous month and last year. This update delves into what these numbers truly mean for buyers, sellers, and anyone keeping a close eye on California real estate.

The California Housing Market: A Look at October's Trends and What They Mean for You

Home Sales: Picking Up Steam

Let's talk numbers. In October 2025, existing single-family homes in California sold at a seasonally adjusted annualized rate of 282,590. That's a 1.9% increase from 277,410 in September and a notable 4.1% jump from 271,370 in October of the previous year. This consistent growth over two consecutive months, as reported by C.A.R., is a good sign for market health. It shows that demand is not only present but also growing, suggesting that more people are feeling confident enough to make a move.

For the first ten months of 2025, the year-to-date sales figures also showed a modest improvement, up 0.8% compared to the same period in 2024. While this might seem small, consistent, slow growth is often more sustainable than rapid, unpredictable surges. It also means that 37 months have passed since sales were last above the 300,000 benchmark, highlighting the market's steady, albeit not explosive, recovery.

Key Takeaway: More homes are changing hands in California, a positive sign for market activity.

Home Prices: Holding Steady with a Slight Dip

When it comes to prices, October presented a more nuanced picture. The statewide median home price in October 2025 was $886,960. This was a small 0.4% increase from September's $883,640. However, looking back a year, the October 2025 median price was 0.2% lower than October 2024's $888,740.

This slight year-over-year dip is important to note. While prices haven't dramatically fallen, they haven't seen the consistent year-over-year growth we've observed in some past periods. It suggests a market that is stabilizing rather than experiencing rapid appreciation. The median price remains near a record high, which was set about six months ago. This stability is a double-edged sword: good for buyers seeking more predictable costs, but perhaps a little less exciting for sellers hoping for quick, significant gains.

My Take: This price stability is a welcome development in my book. It removes some of the unpredictable inflation that can price people out of the market. It feels like we're moving towards a more balanced, sustainable price point, which is healthier for the long-term market.

Regional Performance: A Mixed Bag

California is a big state with diverse economic landscapes, and its housing market reflects that.

  • Southern California and the Central Valley both saw good year-over-year sales gains, with Southern California up 5.6% and the Central Valley up 4.0%.
  • The Far North led the pack with an impressive 18% increase in sales, showing strong activity in its particular markets.
  • The San Francisco Bay Area, often a hotbed of real estate activity, also posted moderate growth at 2.5%.
  • The Central Coast, however, experienced a slight dip in sales, down 1.5% year-over-year.

When it comes to home prices, the story differs:

  • The Central Coast saw a solid 7.9% price increase year-over-year, reaching a median of $1,068,000.
  • Southern California also saw a modest 1.1% uptick in median price.
  • Conversely, the Far North saw prices decline by 3.8%, and the San Francisco Bay Area experienced a 1.1% drop in median price. The Central Valley saw a very slight decrease of 0.2%.

My Observation: It's fascinating to see how different regions react to broader economic forces. The demand for housing is clearly strong across much of the state, but specific local factors continue to shape individual market performance, especially when it comes to pricing.

Housing Supply: Inventory Easing

A key factor influencing any market is the available supply of homes. In October, we saw the typical seasonal slowdown in new listings. The Unsold Inventory Index (UII), which measures how many months it would take to sell the current active listings at the current sales pace, fell to 3.2 months from 3.6 months in September. This is essentially unchanged from 3.1 months in October 2024.

While the overall number of active listings continues to grow year-over-year (for the 21st consecutive month), the rate of this growth is slowing down. The 10.3% year-over-year increase in active listings was the smallest seen since February 2024. This deceleration in inventory growth, especially as we head into the holiday season, suggests a gradual tightening of supply.

What does this mean? When inventory growth slows, it can signal a market shifting away from an overabundance of homes toward a more balanced situation, or even a slight seller's advantage in some areas.

Days on Market: Homes Taking a Little Longer to Sell

The median number of days it took to sell a California home in October was 32 days. This is up from 25 days in October 2024. This increase in selling time is not surprising given the general seasonal trends and the slight increase in overall available homes. It suggests that buyers have a bit more time to consider their options compared to last year, and sellers might need to be a bit more patient.

However, my experience tells me that this average can be a bit misleading. While some homes may sit for longer, desirable properties in good locations are likely still moving quickly. It's crucial to look at local data to get a true sense of how long homes are actually taking to sell in a specific neighborhood.

Table: Days on Market Snapshot

Region October 2025 (Days) October 2024 (Days) Change
California (Overall) 32 25 +7
San Francisco Bay Area 22 18 +4
Southern California 35 27 +8
Central Coast 30 22 +8
Central Valley 32 24 +8
Far North 34 28 +6

Note: Data compiled from C.A.R. reports. Regional data may vary from county-level figures.

Mortgage Rates: A Volatile Factor

Mortgage rates have been a rollercoaster ride, and October was no exception. The 30-year fixed-mortgage interest rate averaged 6.25% in October, which was down from 6.43% in October 2024. This decrease is generally good news for buyers, as it can make monthly payments more affordable.

However, C.A.R. Senior Vice President and Chief Economist Jordan Levine noted that rates briefly approached their 12-month low in October but have since resumed an upward trajectory. This volatility is a significant factor impacting buyer confidence. When rates are unpredictable, buyers can become hesitant, leading them to either pause their search or try to lock in a rate quickly.

My Two Cents: The average mortgage rate is important, but the direction rates are moving is often more impactful on immediate buyer behavior. The recent uptick is definitely something to watch closely as we move further into the late fall and winter months.

Is California a Buyer's or Seller's Market? A Shifting Balance

So, what does all this mean for market dynamics? Are we in a buyer's or seller's market? Based on the C.A.R. data for October 2025:

  • Sales-to-List Price Ratio: The statewide ratio was 98.3%, meaning homes were selling on average at 98.3% of their asking price. This is down from 99.9% in October 2024. A ratio below 100% indicates that, on average, homes are selling for slightly less than the original list price. This suggests a market leaning slightly towards buyers, as they have a bit more negotiation power.
  • Unsold Inventory Index: At 3.2 months, this is still below the 4-6 months generally considered balanced. This indicates that, overall, supply is still tight enough to favor sellers in many areas.

My Conclusion: It's a transitional market, leaning more towards balanced with seller advantages in many areas. While buyers are starting to gain a little more negotiation ground, as shown by the sales-to-list price ratio, the fundamental issue of low inventory means that sellers with well-priced, desirable homes are still in a strong position. It’s not a strong seller’s market like we saw during the peak of the pandemic housing boom, nor is it a buyer's market where buyers can dictate terms. It's a nuanced environment that requires careful strategy for both parties.

Looking Ahead

C.A.R. President Tamara Suminski noted that “housing demand in California has been steadily improving, with home sales rising for the third month in a row.” She also commented that “home prices are growing at a manageable pace, and we’re seeing a healthier balance between buyers and sellers.” This sentiment suggests that I, as a real estate professional who navigates these numbers daily, see a market that is maturing and moving towards greater stability. While ongoing mortgage rate volatility and economic uncertainty could cause some hesitation, the fundamental demand for California real estate remains a powerful force.

As we wrap up 2025 and look towards 2026, the California housing market update from October reveals a market that is active, stabilizing, and full of opportunity for those who approach it with knowledge and a solid strategy.

California Housing Market Forecast: What to Expect in 2026

California Housing Market Forecast: What to Expect in 2026
Source: C.A.R.

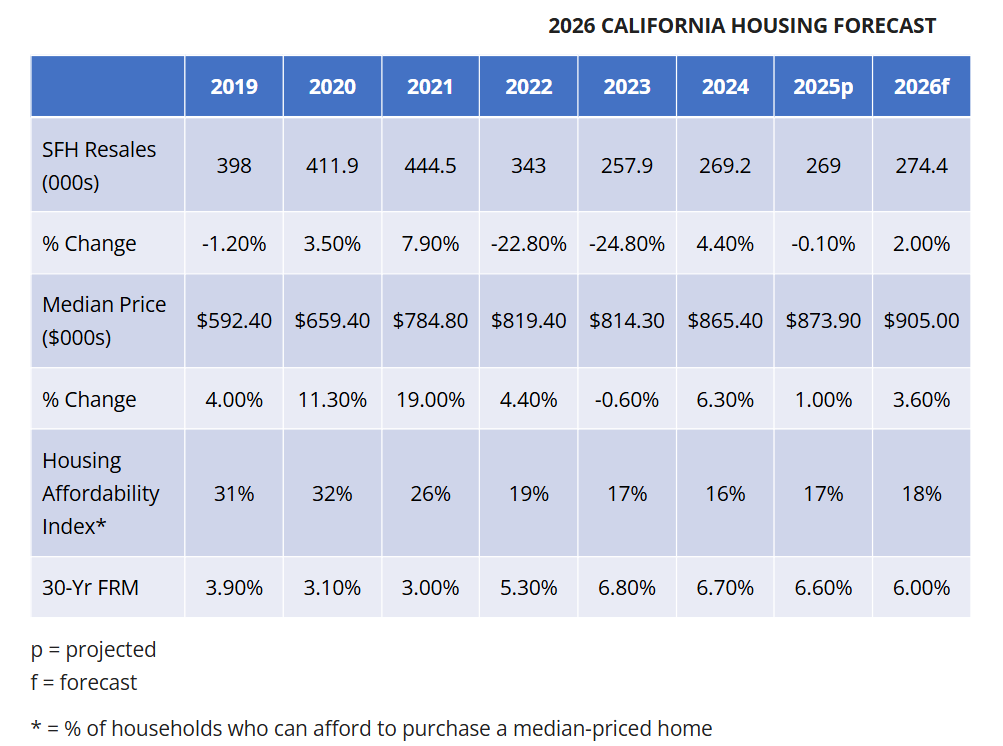
The California housing market is poised for a gentle upturn in 2026, with home sales and the median price expected to inch up slightly. According to the CALIFORNIA ASSOCIATION OF REALTORS® (C.A.R.), we can anticipate existing single-family home sales to reach around 274,400 units, a 2% increase from 2025. The median home price is projected to hit a new record, climbing 3.6% to $905,000. While this might sound like a straightforward prediction, dig a little deeper, and you'll find a more nuanced picture shaped by economic shifts, interest rates, and a slowly improving affordability situation.

My Take on the 2026 Outlook

As someone who's been following the California real estate scene for a while, I can tell you that “inching up” feels like a pretty accurate description. We've seen some wild swings in the past, and frankly, a period of relative stability is what many buyers and sellers are hoping for. C.A.R.'s forecast suggests that stability is on the horizon, but it's not going to be a free-for-all. Affordability is still a major hurdle, but there are glimmers of hope.

A Look at C.A.R.'s Projections

Let's break down what C.A.R. is predicting for the coming years:

Year SFH Resales (000s) % Change Median Price ($) % Change Housing Affordability Index (%) 30-Yr FRM (%)
2024 269.2 4.40% $865,400 6.30% 16% 6.70%
2025p 269.0 -0.10% $873,900 1.00% 17% 6.60%
2026f 274.4 2.00% $905,000 3.60% 18% 6.00%

p = projected, f = forecast

As you can see, 2025 is looking like a bit of a holding pattern, with sales essentially flat compared to 2024. However, the median price is still expected to tick up slightly. The real movement, according to this forecast, is in 2026, where we see both sales and prices showing more noticeable, albeit still moderate, growth.

Why the Gentle Climb?

Several factors are expected to contribute to this gradual ascent:

  • Interest Rates Cooling Down: This is a big one. C.A.R. forecasts the average 30-year fixed mortgage rate to drop to 6.0% in 2026. This is a significant improvement from the averages seen in recent years and even the 6.6% projected for 2025. Lower mortgage rates mean more buying power for consumers. Even though it's still higher than pre-pandemic levels, it's a move in the right direction and, importantly, lower than the 50-year historical average of nearly 8%.
  • Slightly Better Affordability: With lower interest rates and potentially moderate price gains, housing affordability is predicted to inch up. The index is expected to reach 18% in 2026, meaning 18% of households will be able to afford to buy a median-priced home. This is a small but welcome improvement from 16% in 2024 and 17% in 2025. For many Californians, this slight shift could make the dream of homeownership feel a bit more attainable.
  • Increasing Inventory: The forecast indicates that housing supply will continue to improve, with active listings potentially rising by nearly 10% in 2026. When more homes are available, it can ease some of the intense competition we've seen in the market. This could give buyers a bit more breathing room and potentially moderate intense bidding wars.

What About the Economy?

The housing market doesn't exist in a vacuum. The broader economic picture plays a crucial role.

  • Slowing GDP Growth: The U.S. gross domestic product (GDP) is expected to grow at a slower pace in 2026, around 1%, after a projected 1.3% in 2025.
  • Job Growth and Unemployment: California's nonfarm job growth is also projected to slow down, with a 0.3% increase in 2026 after a 0.4% rise in 2025. Consequently, the unemployment rate is expected to creep up to 5.8% in 2026 from 5.6% in 2025 and 5.3% in 2024. While a slight increase in unemployment can be concerning, these numbers suggest the job market, while cooling, isn't collapsing.

C.A.R. President Heather Ozur points out that as economic uncertainty begins to clear and mortgage rates decline, housing sentiment should improve. This is a key piece of the puzzle – people are more likely to make big financial decisions like buying a home when they feel more secure about their jobs and the economy.

Potential Roadblocks and Challenges

It wouldn't be wise to paint an entirely rosy picture. The forecast also highlights several challenges that could still impact the market:

  • Inflation: Inflation is likely to pick up, with the annual average Consumer Price Index (CPI) expected to reach 3.0% in 2026, up from 2.8% in 2025. Higher inflation can erode purchasing power and impact what people can afford.
  • Home Insurance Crisis: The ongoing issues with homeowners insurance in California are a significant concern. Rising premiums and reduced availability of coverage can make homeownership more expensive and less attractive, especially in fire-prone areas.
  • Trade Tensions: Lingering trade tensions between the U.S. and its trading partners can create economic uncertainty, which can ripple through the housing market.
  • Stock Market Volatility: A potential stock market bubble could burst, leading to financial instability and affecting the confidence of high-net-worth individuals who are often significant players in luxury real estate markets.

Senior Vice President and Chief Economist Jordan Levine notes that despite these headwinds, the improving lending environment and clearing economic clouds will be key drivers.

What This Means for You

So, what does all this forecast talk mean for you, whether you're looking to buy, sell, or just keep an eye on your investments?

  • For Buyers: The forecast offers a glimmer of hope. Lower interest rates and a slight increase in inventory in 2026 could make it a more favorable year for buyers than the preceding ones. However, affordability remains a challenge, so smart financial planning and patience will still be crucial. Don't expect a crash, but rather a market that might be slightly less of a seller's dominance.
  • For Sellers: If you've been holding off, 2026 might present a more opportune time to list your home. With stabilizing prices and rising demand, you could see your property fetch a good price. However, the days of astronomical offers might be behind us, and a more realistic pricing strategy will be important.
  • For Homeowners: If you own a home in California, the moderate price appreciation suggests that your home equity is likely to continue growing, albeit at a steadier pace than in boom years.

My personal feeling is that California's housing market, given its fundamental strengths in desirability and economic output, will continue to be resilient. The forecast for 2026 suggests a return to a more sustainable growth pattern. It's not a market for speculators looking for quick flips, but for those looking for long-term value and a place to call home, opportunities will likely emerge.

The key takeaway from C.A.R.'s 2026 California Housing Market Forecast is that we're looking at a period of gradual improvement. Sales and prices are projected to rise modestly, driven by falling interest rates and slightly better affordability, while still navigating economic uncertainties and persistent challenges like insurance costs. It's a market that demands a well-informed approach, but one that holds promise for those looking to enter or move within it.

 From Day One to Decades Ahead: Turnkey Real Estate That Pays

Turnkey properties let you start earning rental income from day one—no renovations, no tenant hunts, no management headaches.

Work with Norada Real Estate to find vetted, cash-flowing markets tailored to your goals—so you can build steady returns without the stress.

HOT NEW LISTINGS JUST ADDED!

Speak with a seasoned Norada investment counselor today (No Obligation):

(800) 611-3060

Get Started Now 

Related Articles:

  • California Housing Market Predictions 2025
  • The Great Recession and California's Housing Market Crash: A Retrospective
  • California Housing Market Cools Down: Is it a Buyer's Market Yet?
  • California Dominates Housing With 7 of Top 10 Priciest Markets
  • Real Estate Forecast Next 5 Years California: Boom or Crash?
  • Anaheim, California Joins Trillion-Dollar Club of Housing Markets
  • California Housing Market: Nearly $174,000 Needed to Buy a Home
  • Most Expensive Housing Markets in California
  • Abandoned Houses for Free California: Can You Own Them?
  • California Housing in High Demand: 19 Golden State Cities Sizzle
  • Homes Under 50k in California: Where to Find Them?
  • Will the California Housing Market Crash in 2024?
  • Will the US Housing Market Crash?
  • California Housing Market Crash: Is a Correction Coming Up?

Filed Under: Growth Markets, Housing Market, Real Estate Market Tagged With: california, Housing Market

California Housing Market Roars as 16 Counties Post Major Sales Growth

November 21, 2025 by Marco Santarelli

California Housing Market Roars as 16 Counties Post Major Sales Growth

If you're thinking about buying or selling a home in the Golden State, you're probably wondering what the current California housing market is up to. Well, here's the good news upfront: home sales in California are showing some healthy momentum. In fact, October saw the highest number of sales since February, according to a recent report from the CALIFORNIA ASSOCIATION OF REALTORS® (C.A.R.). This tells us that despite any ups and downs, people are still actively engaged in buying and selling homes across the state.

For months, we've seen a lot of chatter about rates going up, economic uncertainty, and what that means for affordability. But the October data paints a picture of a market that's finding its footing, with demand showing resilience. The California housing market is complex, a bit like trying to surf on a busy day – there are waves to catch, moments of chop, and periods of smooth sailing.

California Housing Market Roars as 16 Counties Post Major Sales Growth

The October Numbers: A Closer Look at Sales and Prices

Let's dive a bit deeper into what C.A.R.'s report revealed for October 2025. It reported that existing, single-family home sales reached a seasonally adjusted annualized rate of 282,590. Now, what does that really mean? Think of it as a projection: if sales continued at the pace they did in October for the entire year, this is how many homes would be sold. This figure was a 1.9 percent increase from September's sales and a notable 4.1 percent jump compared to October of the previous year. What’s more, year-to-date sales were up by 0.8 percent, showing a steady, albeit modest, upward trend over the year.

Sales Data Snapshot (October 2025):

  • Total Sales: 282,590 (seasonally adjusted annualized rate)
  • Month-over-Month Change: +1.9%
  • Year-over-Year Change: +4.1%
  • Year-to-Date Change: +0.8%

This increase in sales is encouraging because it broke a streak of 37 consecutive months where statewide sales were below the 300,000-unit benchmark. Seeing that number climb, even slightly, suggests that more buyers are finding their way into the market and successfully closing deals.

Now, let's talk about the price tag. The statewide median home price in October was $886,960. This was a very slight uptick of 0.4 percent from September's median price of $883,640. However, year-over-year, the median price saw a small decrease of 0.2 percent, coming in just below October 2024's median of $888,740.

This stabilization in prices, even with a slight dip from last year, is something I watch closely. It means that while homes aren't suddenly becoming drastically cheaper, the rapid price escalations we've seen in the past might be easing. This can create a more balanced environment, giving buyers a bit more breathing room and sellers a realistic expectation of what their home might fetch.

Regional Variations: Where the Action Is

One of the things I love – and sometimes find challenging – about California is its sheer diversity. The same can be said for its housing market. What’s happening in Northern California might be quite different from Southern California, and even within regions, there are significant differences county by county.

C.A.R.'s report highlighted these regional dynamics:

  • Southern California: Steady Growth. This powerhouse region saw a solid 5.6 percent increase in home sales compared to the previous year. The median home price also nudged up by 1.1 percent. This suggests continued strong demand and a robust market in areas like Los Angeles, Orange County, and the Inland Empire.
  • San Francisco Bay Area: A Mixed Bag. The Bay Area experienced a more modest 2.5 percent rise in sales, but its median home price dipped by 1.1 percent year-over-year. The report notes that inventory in the Bay Area is quite tight, with an Unsold Inventory Index of just 2.2 months, indicating a seller's market. Counties like San Francisco and San Mateo saw significant price gains year-over-year, while others like Marin saw slight dips.
  • The Central Valley: Resilience and Opportunity. This region saw a 4.0 percent sales increase. Home prices here are generally more affordable than coastal areas, making it an attractive option for many. While the median price saw a slight dip of 0.2 percent, sales grew. Counties like Kings saw remarkable sales growth, up 52.9 percent year-over-year.
  • The Far North: Leading the Pack. This often-overlooked region had the most impressive sales growth, jumping an astonishing 18 percent year-over-year. This suggests renewed interest and activity in these more rural and scenic parts of the state.
  • Central Coast: Shifting Dynamics. This region saw a slight dip in sales (-1.5 percent) but experienced a significant 7.9 percent increase in median home prices. This could indicate that while fewer homes are changing hands, those that are, are doing so at higher prices, possibly due to limited inventory and high demand in desirable coastal towns.

Table: Regional Performance Snapshot (Year-over-Year Sales & Price Changes)

Region October 2025 Median Price Price Change (YTY) Sales Change (YTY)
California $886,960 -0.2% +4.1%
Southern California $874,240 +1.1% +5.6%
San Francisco Bay Area $1,300,000 -1.1% +2.5%
Central Valley $499,000 -0.2% +4.0%
Far North $375,000 -3.8% +18.0%
Central Coast $1,068,000 +7.9% -1.5%
Inland Empire $599,520 +0.1% +6.4%

It's crucial to remember that these are statewide and regional averages. County-level data showed even more dramatic swings, with places like Trinity County seeing an astonishing 85.7 percent increase in sales year-over-year, while others experienced declines. This highlights why working with a local real estate professional who understands your specific area is so important.

Inventory and Days on Market: A Seller's or Buyer's Market?

The balance between the number of homes available (inventory) and the number of buyers looking is what often dictates whether we're in a seller's or buyer's market. C.A.R. tracks the Unsold Inventory Index (UII), which tells us how many months it would take to sell all the available homes if sales continued at their current pace.

In October, the UII for existing single-family homes was 3.2 months. This is down from 3.6 months in September but essentially unchanged from 3.1 months in October of the previous year. A healthy, balanced market is generally considered to be around 4-6 months of supply. So, with 3.2 months, the California housing market still leans towards a seller's advantage, especially in high-demand areas.

What this means in practical terms is that homes are still selling relatively quickly, though not as fast as they have in previous years. The median number of days it took to sell a home in October was 32 days, up from 25 days in October 2024. This slight increase in time on the market suggests that buyers have a little more time to make decisions, and perhaps fewer bidding wars. However, in some of California's most sought-after regions, like the San Francisco Bay Area, homes are still flying off the shelves, with median days on market often in the teens.

For sellers, this means that while the market might not be as frenzied as it was a year or two ago, a well-priced and well-presented home can still attract multiple offers. For buyers, it emphasizes the need to be prepared and act decisively when a property that meets their needs comes on the market.

The Influence of Mortgage Rates

No discussion about the California housing market is complete without talking about mortgage rates. These are the gatekeepers for many potential buyers. C.A.R. reported that the average 30-year, fixed-mortgage interest rate in October was 6.25 percent, down from 6.43 percent in October 2024.

Now, rates have certainly been a hot topic. While this figure shows a slight decrease year-over-year, market watchers like C.A.R.'s Chief Economist Jordan Levine noted that rates had “resumed an upward trajectory” in late October. This volatility can create uncertainty.

  • Mortgage rates dipping can bring more buyers into the market, as it reduces monthly payments and improves affordability.
  • Mortgage rates rising can sideline some buyers, making them pause their search until rates decrease or their financial situation improves.

The interplay between mortgage rates, housing prices, and income is what ultimately determines affordability. Even with a slight softening in price growth, if mortgage rates climb significantly, affordability can still be a major hurdle. Conversely, if rates were to drop considerably, we might see even more demand and a faster pace of sales.

My Take: What the Data Tells Me

From my perspective, the October report from C.A.R. is a sign of a maturing real estate market. We're moving away from the extreme frenzy of the pandemic-driven boom and settling into a more sustainable rhythm.

Here's what I see:

  1. Resilient Demand: Buyers are still actively participating. The increase in sales shows that Californians are committed to homeownership, adapting to current conditions.
  2. Price Stabilization: The era of rapid, double-digit price appreciation may be on pause. This is a good thing for long-term market health and provides more predictable conditions for both buyers and sellers. Prices are still high, of course, but the rate of growth has slowed to a more manageable pace.
  3. Regional Nuance is Key: You absolutely cannot treat California as a monolith. The data clearly shows that different areas are experiencing different market dynamics due to local economies, job markets, and housing supply.
  4. Inventory is Tight, but Slowly Growing: While still a seller-leaning market overall, the fact that active listings have been growing (even if at a decelerating pace) is a positive sign for buyers. It means more options are becoming available, which can help ease competition.
  5. Economic Factors Still Matter: Mortgage rates, inflation, and broader economic confidence will continue to play a significant role. A government shutdown, as mentioned in the report, can even ripple into and affect market sentiment and rates.

Looking Ahead: What to Expect in the Near Future

As we head further into the holiday season and look towards 2026, C.A.R. President Tamara Suminski believes the trends point to a “promising moment for anyone considering a move.” I generally agree.

We're likely to continue seeing sales hover around the levels reported in October, with the typical seasonal slowdown impacting the market during the winter months. However, the underlying demand remains strong.

  • For Buyers: Be prepared, know your budget, get pre-approved for a mortgage, and work with a knowledgeable agent. You might have slightly more negotiating power than a year ago, but good homes in desirable areas will still move quickly.
  • For Sellers: Pricing your home accurately from the start is critical. Showcase its best features, and understand that while bidding wars might be less common, a well-marketed home will still attract serious buyers.

The California housing market is always evolving. It’s a market that requires patience, research, and expert guidance. The latest data suggests a market that's finding its balance – not red-hot, but definitely not cooling off entirely. It's a market where careful planning and strategic moves can lead to success for both those looking to buy and those looking to sell.

Think Like a Smart Investor—Build Wealth Through Real Estate

Norada helps you navigate volatility by connecting you with turnkey, cash-flowing rental properties in resilient markets—so you can protect purchasing power and pursue steady income regardless of short-term rate moves.

🔥 HOT NEW LISTINGS JUST ADDED! 🔥

Talk to a Norada investment counselor today (No Obligation):

(800) 611-3060

Get Started Now

Related Articles:

  • California Housing Market Rebounds With Sales Growth in 40+ Counties
  • Best Time to Buy a House in California's Largest Metros in 2025
  • California Housing Market Forecast 2026: Will it Crash or Recover?
  • California Housing Market Rebounds Driven by Lower Mortgage Rates
  • Home Prices Drop in 21 Counties in the California Housing Market
  • California Leads With Most At Risk Housing Market Counties in 2025
  • California Housing Market Decline: Sales Drop for 4th Straight Month
  • California Housing Affordability Drops in Q2 2025 Amid High Mortgage Rates
  • Is the California Housing Market Heading for a Crash or Correction?
  • California Housing Market: Forecast and Trends 2025-2026
  • California Housing Market Graph 50 Years
  • The Great Recession and California's Housing Market Crash: A Retrospective
  • California Dominates Housing With 7 of Top 10 Priciest Markets
  • Real Estate Forecast Next 5 Years California: Boom or Crash?
  • Anaheim, California Joins Trillion-Dollar Club of Housing Markets
  • California Housing Market: Nearly $174,000 Needed to Buy a Home
  • Most Expensive Housing Markets in California
  • Abandoned Houses for Free California: Can You Own Them?
  • Homes Under 50k in California: Where to Find Them?

Filed Under: Growth Markets, Housing Market, Real Estate Market Tagged With: california, Housing Market

California Housing Market Rebounds With Sales Growth in 40+ Counties

October 27, 2025 by Marco Santarelli

California Housing Market Bounces Back in September With Stronger Sales

The California housing market made a noticeable comeback in September, with home sales picking up momentum both from the previous month and from the year before. Infact, 40 out of 53 counties posted explosive annual sales growth, signaling widespread recovery. This rebound is a welcome sign for many, suggesting a stabilization after a period of uncertainty. The California housing market rebounds in September with a promising uptick in activity.

California Housing Market Rebounds With Sales Growth in 40+ Counties

As a real estate professional who's seen my share of market ups and downs, I can tell you that September felt different. There was a tangible shift in the air, a sense that potential buyers, who might have been sitting on the sidelines, were starting to feel more comfortable making a move. This isn't just about numbers; it's about the feeling of renewed confidence that permeates the market.

The CALIFORNIA ASSOCIATION OF REALTORS® (C.A.R.) reported that existing, single-family home sales reached a seasonally adjusted annualized rate of 277,410 in September. This is a solid 5 percent increase from August's 264,240 sales and a healthy 6.6 percent jump from September 2024's 260,340 sales. It's the highest sales level we've seen in about seven months, which is a great indicator of renewed activity.

Understanding the September Sales Surge

What's driving this comeback? A few things are coming into play. One significant factor is the slight easing of mortgage interest rates. While they haven't dropped dramatically, they’ve hovered in a more manageable range, making homeownership feel more attainable for a broader group of buyers. As Heather Ozur, a REALTOR® from Palm Springs, noted, “Even though rates have inched up a bit, they’re still in the low 6% range, which should help keep the market steady through the end of the year.” This has been crucial.

Also, after a relatively quiet summer, September often sees a natural increase in activity as families settle back into routines and a sense of urgency to buy before the holidays kicks in. However, this year, it feels like more than just seasonal timing; it's a genuine rekindling of interest.

The Price Picture: Modest Growth Amidst the Rebound

While sales are up, the median home price in California also saw a modest increase, though it dipped slightly compared to August. In September, the statewide median home price stood at $883,640. This is down 1.7 percent from August's $899,130. This monthly dip is pretty typical for this time of year, as the market often cools slightly after the summer.

However, looking at the year-over-year picture is where we see the positive trend. That $883,640 median price is 1.8 percent higher than the $868,150 recorded in September 2024. This marks the second consecutive month where prices have shown year-over-year gains, a sign of underlying strength.

From my perspective, this stabilization in prices is a good thing. It suggests that the market isn't overheating, nor is it in a freefall. It's finding a more balanced ground, which is ultimately healthier for long-term stability.

Jordan Levine, C.A.R. Senior Vice President and Chief Economist, offered some valuable insight here: “The housing market showed modest improvement in September, with both sales and prices up from a year ago. Steady mortgage rates may give demand a small boost heading into the fourth quarter, but broader economic uncertainty—like the ongoing government shutdown and renewed U.S.-China trade tensions—will likely keep the recovery gradual.” This highlights the delicate balance of factors at play.

Regional Variations: Where the Action Is

California is a state of diverse real estate markets, and September's rebound was felt differently across its regions. It's always exciting to see these variations because they tell a more nuanced story.

Looking at year-over-year sales on a non-seasonally adjusted basis, all of California's major regions saw growth. The stars of the show were:

  • Central Coast: A remarkable 11.8 percent increase in sales.
  • Southern California: A strong 11.3 percent increase.
  • Central Valley: A solid 10.2 percent increase.

Even the San Francisco Bay Area (9.8 percent) and the Far North (8 percent) posted healthy gains, showing that the momentum wasn't confined to just one part of the state.

This regional strength is a testament to the diverse economic drivers within California. The Central Coast, for instance, often attracts buyers looking for lifestyle and vacation properties, while the Central Valley offers more affordable entry points. Southern California, a massive and diverse market, always has its own unique pulse.

At the county level, the numbers are even more striking. 40 out of 53 tracked counties saw year-over-year sales gains.

  • Kings County led the pack with an impressive 46.3 percent increase.
  • Calaveras County followed closely with 42 percent growth.
  • Santa Cruz County also saw a significant jump of 37.9 percent.

It's also important to note where sales declined. Trinity County saw a substantial drop of 50 percent, and San Benito County fell by 23.9 percent. These outliers often point to specific local economic factors or inventory issues that are worth digging into.

Home Price Trends Across California: A Mixed Bag

When it comes to prices, most regions saw year-over-year appreciation:

  • Far North: Up 2.9 percent.
  • San Francisco Bay Area: Up 2.7 percent.
  • Southern California: Up 2.3 percent.
  • Central Coast: Up 1.2 percent.

The Central Valley was the only major region to experience a slight annual price dip, down 0.2 percent.

On the county level, the price story is also varied. Mono County saw a massive 53.4 percent increase in its median price, which can sometimes be attributed to very few high-value sales skewing the median. Other notable price gains came from Mariposa County (51.6 percent) and Del Norte County (23 percent).

Conversely, some counties saw price declines. Trinity County experienced the largest drop at 15.2 percent, with Calaveras and San Benito counties also seeing significant decreases. These figures highlight that while the statewide California housing market rebounds in September, local conditions can create very different realities.

Housing Inventory and Time on Market: A Buyers' Market Still?

One of the key metrics I always watch is the Unsold Inventory Index (UII). This tells us how many months it would take to sell all the homes currently on the market if sales continued at the September pace. In September, the UII was 3.6 months, which is a slight dip from August (3.9 months) and unchanged from September 2024.

What does this mean? Generally, a UII below 4 months indicates a seller's market, where demand outstrips supply. However, the fact that active listings have been rising for 20 consecutive months, even though the growth rate is slowing, suggests that while inventory is tight, it's not overwhelmingly restrictive for buyers.

“September marked the fifth straight month of slowing inventory growth, indicating that while supply conditions still favor buyers, momentum on the supply side is easing as the market follows its typical seasonal slowdown in the fourth quarter,” C.A.R. noted. This is a crucial point: the market is shifting, but it hasn't fully tipped into a seller's definitive advantage yet.

The time it takes to sell a home also provides insight. In September, it took an average of 32 days to sell a single-family home. This is up from 24 days in September 2024. This increase in days on market, coupled with steady inventory growth, suggests buyers have a bit more breathing room than they did a year ago. They have more time to consider their options and negotiate.

The sales-price-to-list-price ratio was 98.2 percent in September 2025, down from 100 percent in September 2024. This means that, on average, homes are selling slightly below their asking price, which is another indicator that buyers have some negotiation power.

What's Next for the California Housing Market?

The September data paints a picture of cautious optimism. The California housing market rebounds in September with sales and modest price appreciation, but there are still headwinds. Economic uncertainty, as mentioned by Jordan Levine, remains a significant factor. Geopolitical tensions and domestic policy issues can always cast a shadow over consumer confidence and, by extension, the housing market.

Mortgage rates, while currently in a better range, are always subject to change based on Federal Reserve policy and broader economic performance. A sharp uptick in rates could easily cool the nascent recovery we're seeing.

However, on the positive side, the underlying demand for housing in California remains strong. The state's population continues to grow, and the desirability of its lifestyle and economic opportunities persists. As more buyers feel confident about their financial future and the stability of interest rates, we can expect continued, albeit gradual, growth.

From my experience, the key for buyers right now is to be prepared. Have your financing in order, understand your local market dynamics, and be ready to act when the right opportunity arises. For sellers, understanding that while the market is improving, it’s not the frenzied seller’s market of a couple of years ago, is crucial. Pricing your home competitively and presenting it well will be key to a successful sale.

The September rebound is a positive step. It shows the resilience of the Californian homeowner and the inherent strength of its real estate market. While we should always be mindful of the broader economic context, this September's performance offers a hopeful glimpse into the latter part of the year and beyond.

Think Like a Smart Investor—Build Wealth Through Real Estate

Norada helps you navigate volatility by connecting you with turnkey, cash-flowing rental properties in resilient markets—so you can protect purchasing power and pursue steady income regardless of short-term rate moves.

🔥 HOT NEW LISTINGS JUST ADDED! 🔥

Talk to a Norada investment counselor today (No Obligation):

(800) 611-3060

Get Started Now

Related Articles:

  • Best Time to Buy a House in California's Largest Metros in 2025
  • California Housing Market Forecast 2026: Will it Crash or Recover?
  • California Housing Market Rebounds Driven by Lower Mortgage Rates
  • Home Prices Drop in 21 Counties in the California Housing Market
  • California Leads With Most At Risk Housing Market Counties in 2025
  • California Housing Market Decline: Sales Drop for 4th Straight Month
  • California Housing Affordability Drops in Q2 2025 Amid High Mortgage Rates
  • Is the California Housing Market Heading for a Crash or Correction?
  • California Housing Market: Forecast and Trends 2025-2026
  • California Housing Market Graph 50 Years
  • The Great Recession and California's Housing Market Crash: A Retrospective
  • California Dominates Housing With 7 of Top 10 Priciest Markets
  • Real Estate Forecast Next 5 Years California: Boom or Crash?
  • Anaheim, California Joins Trillion-Dollar Club of Housing Markets
  • California Housing Market: Nearly $174,000 Needed to Buy a Home
  • Most Expensive Housing Markets in California
  • Abandoned Houses for Free California: Can You Own Them?
  • Homes Under 50k in California: Where to Find Them?

Filed Under: Growth Markets, Housing Market, Real Estate Market Tagged With: california, Housing Market

San Francisco Home Values Skyrocket by 300% Over the Last 50 Years

October 25, 2025 by Marco Santarelli

San Francisco Home Values Skyrocket by 300% Over the Last 50 Years

It’s no secret that buying a home in San Francisco feels like a monumental undertaking, a significant financial leap. But if you’ve ever wondered just how much the price of a San Francisco pad has climbed, get ready for a jaw-dropping number: San Francisco home values have risen by almost 300% over the last 50 years. That’s right, a nearly three-fold increase in the real value of your San Francisco property, when you account for inflation. This isn't just a statistic; it’s a story of transformation, economic evolution, and a city that has become a global magnet.

San Francisco Home Values Skyrocket by 300% Over the Last 50 Years

As I’ve spent years navigating the San Francisco real estate market, observing its ebb and flow, I’ve seen firsthand the incredible demand and the often staggering prices. This massive appreciation isn't a random event; it's a direct reflection of profound shifts in the American economy and the unique role San Francisco has carved out for itself on the global stage, particularly as the undisputed capital of technological innovation.

The Shifting Tides of American Economy and Real Estate

From the mid-1970s to the mid-2020s, the United States has undergone a seismic economic transformation. We’ve moved from an era dominated by manufacturing and industry to one driven by service, information, and technology. According to a deep dive by Realtor.com, analyzing five decades of data from the Federal Housing Finance Agency (FHFA), this shift has led to wildly different outcomes for cities across the country.

While home values have increased everywhere, the magnitude of that growth tells a compelling story. We're seeing a stark divide between coastal hubs that have become economic powerhouses and cities that once thrived on manufacturing but have struggled to reinvent themselves.

West Coast: The Undisputed Champions of Home Value Growth

When you look at where home values have skyrocketed, the West Coast, and especially California, stands out like a beacon. It’s no surprise that San Jose, the heart of Silicon Valley, leads the pack. From 1975 to 2024, adjusted for inflation, home values in San Jose soared by a remarkable 396%. This surge is directly tied to the rise of the tech industry, attracting brilliant minds and significant investment, creating high-paying jobs and, consequently, intense demand for housing.

And then there's San Francisco. Following closely behind San Jose, our beloved Golden City saw its home values climb by an astonishing 300% over the same period. What’s particularly insightful here is the proximity of these gains. San Jose and San Francisco, mere miles apart, represent twin pillars of the tech revolution. This close clustering of innovation and industry created a powerful economic vortex, drawing people and capital to the Bay Area like never before.

This isn't just about owning a home; it's about owning a piece of a global innovation engine. The demand for housing in these areas is fueled by more than just a desire for a nice place to live; it’s driven by career opportunities, access to groundbreaking industries, and a lifestyle that embraces forward-thinking innovation.

Table: Top Metros with Highest Inflation-Adjusted Home Value Increases (1975-2024)

Rank Metro Area Inflation-Adjusted Home Value Increase
1 San Jose, CA 396%
2 San Francisco, CA 300%
3 Los Angeles, CA 292%
4 Seattle, WA 280%
6 Boston, MA 196%

The Engine of Tech: Driving San Francisco's Ascent

As someone who has witnessed San Francisco’s evolution, I can attest to the immense impact of the technology sector. Back in the 1970s and 80s, while Silicon Valley was buzzing, San Francisco was also a vibrant city with its own unique culture and economic drivers. However, the explosion of personal computing, the internet, and then mobile technology completely reshaped the economic landscape. Companies like Apple, Google, Facebook (now Meta), and countless others either headquartered themselves or established major operations in the Bay Area.

This concentration of talent and capital created a “winner-take-all” dynamic. Highly skilled workers, drawn by the allure of groundbreaking careers and substantial salaries, flocked to the region. This influx of demand, coupled with the inherent geographical constraints of San Francisco – a peninsula with limited land for expansion – created a perfect storm for skyrocketing property values. Limited new construction, due to zoning laws and the sheer difficulty of building on the hilly terrain, further squeezed supply, pushing prices to astronomical levels.

East Coast Echoes: Finance and Innovation

While the West Coast often grabs the headlines for tech, it's important to note that other major economic hubs also saw significant gains. Cities like Boston and New York, with their strong financial sectors and esteemed universities, benefited from similar economic trends. Boston, a historic hub of education and finance, saw home values increase by a respectable 196%. New York City, the undisputed global financial capital, followed with a 161% appreciation.

These cities, like their West Coast counterparts, experienced a boom in high-paying service and information-based jobs. However, they also faced similar challenges with housing supply. Strict zoning regulations and limited space for new development in established urban cores meant that demand often outstripped supply, leading to sustained price increases.

The Other Side of the Coin: Struggling Housing Markets

The contrast between the booming coastal cities and the struggling industrial heartlands is stark. Cities that were once powered by manufacturing, jobs that have largely moved overseas or been automated, have found it difficult to adapt. Here, home value growth has been minimal, and in some cases, stagnant.

For instance, Memphis, Tennessee, and Cleveland, Ohio, cities with deep roots in manufacturing, saw inflation-adjusted home value increases of a mere 2% over the past 50 years. Birmingham, Alabama, another former industrial powerhouse, experienced a 9% rise. Pittsburgh, once the “Steel City,” saw a slightly better but still modest 26% increase.

What's the common thread here? These cities often lacked the capital—both financial and human—to successfully transition to the new economy. The loss of manufacturing jobs led to economic decline, making it harder to attract the tech and finance industries that have driven growth elsewhere. The housing market in these areas reflects this economic reality; without strong job growth and a vibrant economy, there's little pressure to drive up property values. This is a critical insight: it's not just about location, it's about the economic engine powering that location.

Looking Ahead: What Does This Mean for San Francisco?

The nearly 300% rise in San Francisco home values is a testament to the city's incredible resilience and its pivotal role in the modern economy. However, it also presents ongoing challenges. Affordability remains a major concern for residents, and the question of how to maintain a diverse and vibrant community in the face of such high living costs is a persistent debate.

As I see it, the future of San Francisco's housing market will likely remain tied to the fortunes of the tech industry. While the industry continues to innovate and attract talent, demand for housing will remain high. However, there's a growing conversation about decentralization and the possibility of more remote work impacting the need for everyone to live in the most expensive cities.

Understanding these historical trends, from the boom in tech hubs to the struggles of former industrial centers, gives us a clearer picture of the forces shaping real estate. San Francisco's story over the last 50 years is a powerful illustration of how economic shifts can radically transform a city and its housing market, proving that location, innovation, and economic opportunity are inextricable from the value of a home.

Turnkey Rental Properties = Fast Cash Flow + Lasting Wealth

Turnkey properties let you start earning rental income from day one—no renovations, no tenant hunts, no management headaches.

Work with Norada Real Estate to find vetted, cash-flowing markets tailored to your goals—so you can build steady returns without the stress.

HOT NEW LISTINGS JUST ADDED!

Speak with a seasoned Norada investment counselor today (No Obligation):

(800) 611-3060

Get Started Now

Also Read:

  • San Jose Home Values Rise by Almost 400% Over the Last 50 Years
  • San Jose Housing Market: Trends and Forecast 2025-2026
  • Average Home Price in San Jose Reaches $1.45 Million
  • $2 Million Homes: San Jose's Housing Market Reaches New Height
  • Best Time to Buy a House in California’s Largest Metros in 2025
  • Bay Area Housing Market: Prices, Trends, Forecast 2025
  • Bay Area Housing Market Forecast for the Next 2 Years
  • Bay Area Housing Market Predictions 2030
  • Bay Area Housing Market Booming! Median Prices Hit Record Highs
  • Bay Area Housing Market: What Can You Buy for Half a Million?
  • Bay Area Home Prices Skyrocket: Wealthy Buyers Fuel Market

Filed Under: Housing Market, Real Estate Market Tagged With: Bay Area, california, Housing Market, san jose

San Jose Home Values Rise by Almost 400% Over the Last 50 Years

October 24, 2025 by Marco Santarelli

San Jose Home Values Rise by Almost 400% Over the Last 50 Years

If you lived in the San Jose area over the last 50 years, your home likely became almost four times more valuable, even after accounting for inflation. It’s a staggering number, and it tells a big story about how our country has changed. I’ve been following real estate for a while now, and the meteoric rise of Silicon Valley’s housing market is one of the most compelling economic sagas I’ve ever witnessed. It wasn't just a lucky streak; it was a fundamental shift in the American economy that reshaped places like San Jose into global powerhouses.

San Jose Area Home Values Rise by Almost 400% Over the Last 50 Years

This incredible surge in San Jose’s home values is detailed in a report by Realtor.com, which dug deep into housing data from the Federal Housing Finance Agency (FHFA) spanning from 1975 to 2024. While home values have increased everywhere in the U.S., the scale of the gain in places like San Jose is truly mind-boggling. It highlights a stark divide in how different parts of the country have fared economically over the past half-century.

From Manufacturing Might to Digital Dreams: How the Economy Shifted

As I see it, this massive difference in home value appreciation comes down to a few major economic transformations that have swept across the United States. Back in the 1970s, a lot of our economy was built on making things – think factories, assembly lines, and manufacturing jobs. But over the decades, that started to change. We've moved more and more towards a service and information economy.

Jake Krimmel, a senior economist at Realtor.com, put it perfectly: “The U.S. moved from a manufacturing to a service and information economy, and that evolution impacted different places through their labor and housing markets. Some areas were huge winners from that shift, while some got the short end of the stick.” San Jose, without a doubt, was a huge winner.

The West Coast's Golden Ticket: San Jose Leads the Pack

When we talk about the biggest winners, the West Coast is where you see the most dramatic stories, and San Jose, California, stands head and shoulders above them all. Nestled right in the heart of what we now call Silicon Valley, this area has been the epicenter of the technological revolution. Over the last 50 years, from 1975 to 2024, the typical home in San Jose saw its value skyrocket by an inflation-adjusted 396%. That's almost a 400% increase!

It's no wonder that by 2024, coinciding with the current boom in Artificial Intelligence (AI), San Jose became the first U.S. city to see the median price of a single-family home break the $2 million mark. And this momentum hasn't slowed down. As of September 2025, Realtor.com's latest reports show San Jose as the most expensive housing market in the nation, with a median list price still hovering around a hefty $1.36 million.

Looking at the data, it's clear that California was on fire during this period. Half of the top 10 metro areas that saw the biggest home value jumps were in the Golden State. San Jose’s neighbor, San Francisco, came in second with a remarkable 300% growth, followed by Los Angeles at 292%. Even further north, Seattle, the home of tech giants like Microsoft, saw a fantastic 280% gain, ranking fourth.

Krimmel explains, “The West Coast markets like the Bay Area and Seattle became huge tech hubs thanks to universities, R&D, and key companies that began shaping the information technology world going back to the '80s.” This ecosystem of innovation, research, and leading companies created high-paying jobs and attracted talent from all over the world, driving up demand for housing.

When Opportunity Knocks: East Coast Success Stories

It wasn't just the West Coast that saw impressive home value growth. Traditional hubs in the Northeast also experienced significant gains, especially as finance and business transformed through technology. Boston, for instance, landed the sixth spot with a solid 196% inflation-adjusted increase. New York, the undisputed global financial capital, secured the eighth position with homes appreciating by a remarkable 161% since 1975, mirroring Denver's growth.

According to Krimmel, these East Coast cities benefited from similar trends as their West Coast counterparts. The financial services industry, heavily influenced by modernization and digitization, created highly productive and profitable industries that boosted local job markets and, consequently, real estate values.

What’s particularly interesting about places like Boston and New York is that they also faced a common challenge: limited supply. These cities often have stricter zoning laws and land-use regulations that make it harder to build new homes. So, as demand surged due to booming job markets, the supply of housing couldn’t keep up, pushing prices even higher. This is an ongoing issue, as we're still seeing the Northeast lag in housing inventory growth.

The Tale of Two Cities: Where Growth Stalled

On the flip side of this economic boom, we have cities that were once the powerhouses of America’s manufacturing age but struggled to make the transition to the new economy. These areas, unfortunately, saw very little home value growth over the last 50 years.

Memphis, Tennessee, is a prime example of this struggle. Home values in the Bluff City saw a meager increase of just 2% over the entire 50-year period. This reflects the city's difficulty in shifting from its historical industrial base to high-tech industries. Cleveland, a former heavyweight in the steel and iron industries, experienced a similar fate, with home values creeping up by only 2%.

Birmingham, Alabama, another city with deep roots in iron and steel manufacturing, saw the third-smallest inflation-adjusted gain at 9%. Pittsburgh, famously known as “Steel City,” fared only slightly better, with home values rising by 26%.

Krimmel explains the core reason: “Not only were manufacturing jobs offshored, resulting in job losses and economic plight, but many of these places did not have the capital—financial or human—to reinvent themselves as tech and finance forward hubs.” Without the investment and the skilled workforce needed for sectors like technology and finance, these cities couldn't attract the same kind of economic growth that powered places like San Jose. As a result, even as of late 2025, Pittsburgh lists the nation's lowest median home prices, with Cleveland close behind.

Looking Ahead: What Does This Mean for Homeowners?

The data clearly shows that where you live has played an enormous role in your home's financial growth over the past 50 years. San Jose's incredible appreciation is a direct result of its transformation into a global innovation hub. It’s a testament to how technological advancements and a shift towards knowledge-based industries can profoundly impact local economies and real estate values.

For homeowners in areas that experienced this boom, it means significant wealth creation. For those in struggling areas, it highlights the challenges of economic diversification. As I look at these numbers, it’s a powerful reminder that real estate isn't just about bricks and mortar; it's deeply intertwined with the economic forces shaping our nation.

Build Wealth Faster—Invest in Turnkey Rentals for Cash Flow & Equity

Turnkey properties let you start earning rental income from day one—no renovations, no tenant hunts, no management headaches.

Work with Norada Real Estate to find vetted, cash-flowing markets tailored to your goals—so you can build steady returns without the stress.

HOT NEW LISTINGS JUST ADDED!

Speak with a seasoned Norada investment counselor today (No Obligation):

(800) 611-3060

Get Started Now

Also Read:

  • San Jose Housing Market: Trends and Forecast 2025-2026
  • Average Home Price in San Jose Reaches $1.45 Million
  • $2 Million Homes: San Jose's Housing Market Reaches New Height
  • Best Time to Buy a House in California’s Largest Metros in 2025
  • Bay Area Housing Market: Prices, Trends, Forecast 2025
  • Bay Area Housing Market Forecast for the Next 2 Years
  • Bay Area Housing Market Predictions 2030
  • Bay Area Housing Market Booming! Median Prices Hit Record Highs
  • Bay Area Housing Market: What Can You Buy for Half a Million?
  • Bay Area Home Prices Skyrocket: Wealthy Buyers Fuel Market

Filed Under: Housing Market, Real Estate Market Tagged With: Bay Area, california, Housing Market, san jose

Buyers Return to Orange County—Housing Market Shows New Strength

October 19, 2025 by Marco Santarelli

Buyers Return to Orange County—Housing Market Shows New Strength

If you’re thinking about buying or selling a home in Orange County, you’ve probably been hearing a lot about the housing market lately. And for good reason! The Orange County housing market records strong sales, showing a solid rebound that’s encouraging for many. This isn't just a quick blip; it indicates a market that's finding its footing and offering opportunities for those looking to make a move. As we dive into the numbers from September, it’s clear that Southern California, and Orange County in particular, is a vital part of this positive trend.

Buyers Return to Orange County—Housing Market Shows New Strength

From my perspective as someone deeply involved in real estate, seeing this kind of activity is always a good sign. It means people are confident enough in their financial situations and the economy to invest in a home. This confidence translates into more transactions and a healthier market overall. Let’s break down what September’s report tells us about Orange County and what it might mean for you.

Sales are Up, and Homes Are Moving

One of the most important indicators is the number of homes actually selling. According to the CALIFORNIA ASSOCIATION OF REALTORS, in September, California as a whole saw a nice jump in home sales. Existing single-family home sales across the state increased significantly compared to both the previous month and the year before. This is a trend we’re seeing reflected right here in Orange County.

While the specific county-level numbers for Orange County aren't detailed in the same way as the statewide report, we know that Southern California as a region experienced an 11.3% year-over-year increase in sales. This is a substantial jump and suggests that Orange County, a powerhouse within Southern California, is a major contributor to this growth. I often tell clients that when the larger region shows strength, it’s a good bet that our local markets are following suit, and this data confirms that. It means that even with higher prices, buyers are actively seeking out properties.

Home Prices: A Steady Climb

When sales increase, it often leads to a conversation about prices. Across California, the median home price in September held steady, showing a slight increase from the previous year. For Southern California specifically, prices were up 2.3% year-over-year. Again, Orange County, known for its desirability, likely mirrors this upward trend.

In September, the median home price in Orange County was approximately $1,401,250. This saw a modest increase of 1.2% from August and a 0.3% increase from September of last year. While it might seem like a small annual gain, this stability is actually a positive sign for the market. It suggests that prices aren't skyrocketing out of control, making it a more predictable environment for buyers. For sellers, it means their property value has likely seen a modest, but welcome, appreciation.

Inventory Levels: A Balanced Market?

One of the key metrics I always watch is the Unsold Inventory Index (UII). This tells us how many months it would take to sell all the homes currently on the market if no new homes were listed. In September, the UII for California was 3.6 months. This is considered a healthy market, leaning slightly towards a seller’s advantage.

For Orange County, the UII in September was 3.0 months. This is even more favorable for sellers. A UII below 4.0 months generally indicates that demand is strong, and homes are moving relatively quickly once they are listed. This low inventory means sellers are in a good position to potentially receive multiple offers and negotiate favorable terms. It’s a far cry from the days of overflowing listings, and it’s why pricing your home correctly from the start is so crucial right now.

Median Time on Market: Homes Are Selling Faster

Another strong indicator of market health is how quickly homes are selling. The median time on market for single-family homes in California in September was 32 days. This is an increase from the previous year (24 days), which might seem like a negative. However, when you look at the context of rising sales and solid prices, it represents a market that is active and engaged.

In Orange County specifically, the median time on market in September was 33 days. While this is a slight increase from the 22 days it took last September, it’s still a relatively quick turnaround for a high-value market like ours. What this tells me is that while buyers are taking a little more time to consider their options, they are still actively purchasing. Homes that are well-priced, well-presented, and marketed effectively can still move off the market quite quickly.

What Does This Mean for You?

For Buyers:

  • Opportunities Exist: While prices remain high, the increased sales volume and relatively stable median time on market suggest that with careful planning and a good agent, finding a home is achievable.
  • Be Prepared: With inventory levels favorable to sellers, having your finances in order and being ready to make a competitive offer is key.
  • Consider Your Needs: The diverse price points across different neighborhoods within Orange County mean there are still options for various budgets.

For Sellers:

  • Strong Demand: Your home is likely to attract significant interest. The current market conditions favor sellers, especially in desirable areas.
  • Pricing is Crucial: While it’s a seller’s market, realistic pricing based on comparable sales is still paramount. Overpricing can lead to a home sitting on the market longer than anticipated.
  • Presentation Matters: In a competitive market, making sure your home is staged and presented in the best possible light can make a huge difference.

The Orange County housing market records strong sales not just because people want to buy here, but because the underlying economic indicators are supporting these transactions. From my experience, this shows a market that is resilient and offers significant value for both those looking to buy their dream home and those looking to capitalize on their investment. It’s an exciting time to be involved in real estate here.

Invest in Turnkey Rentals for Reliable Monthly Cash Flow

America's thriving rental market continues to attract investors seeking steady monthly income and long-term appreciation. Turnkey properties offer the easiest way to generate passive cash flow without the day-to-day hassles of management.

Work with Norada Real Estate to access exclusive off-market inventory and invest in fully managed rental properties across high-demand neighborhoods—so you can start earning from day one.

MORE INVENTORY AVAILABLE THAN LISTED ONLINE!

Speak with a seasoned Norada investment counselor today (No Obligation):

(800) 611-3060

Get Started Now 

Recommended Read:

  • Orange County Housing Market: Trends and Forecast 2025-2026
  • Southern California Housing Market Booms With Strong Sales Across Counties
  • Housing Market Slowdown Hits Southern California Hard as Sales Plummet
  • California Housing Market: Trends and Forecast
  • Southern California Housing Market Trends and Forecast
  • Real Estate Forecast Next 5 Years California: Crash or Boom?
  • Will Housing Prices Drop in 2025 in California: Key Insights

Filed Under: Growth Markets, Housing Market Tagged With: california, Housing Market, Orange County

Home Sales Surge in 40 Counties in the California Housing Market

October 19, 2025 by Marco Santarelli

Home Sales Boom in 40 Counties in the California Housing Market

The California housing market rebounds in September, and while the statewide numbers are encouraging, the real excitement is unfolding at the county level. I've spent years navigating these diverse markets, and what I saw in September tells a story of robust recovery, with incredible growth bubbling up from various corners of the state.

Home Sales Surge in 40 Counties in the California Housing Market

The CALIFORNIA ASSOCIATION OF REALTORS® (C.A.R.) report painted a clear picture: 40 out of the 53 counties tracked experienced year-over-year sales gains. But it’s not just about modest increases; a significant chunk of these, more than half (25 counties to be exact), saw double-digit growth. This isn't just a rebound; it's a powerful surge in many areas, showing that the desire for California homes is alive and well, even if it's manifesting differently in each locale.

The Unsung Heroes: Counties Leading the Charge

When we talk about the California housing market rebounds in September, we need to give a shout-out to the counties that are truly leading the charge. These are the places where the market is performing exceptionally well, showcasing strong buyer interest and seller activity.

Leading the pack, and frankly, causing quite a stir, is Kings County. Imagine this: a 46.3 percent increase in year-over-year sales! That's a phenomenal leap, far outpacing the state average and highlighting a region that's clearly hit a sweet spot for buyers.

Hot on its heels is Calaveras County, which recorded an impressive 42 percent jump in sales. This is another gem in the Sierra Nevada foothills, proving that attractive locations and perhaps more accessible price points can drive significant market momentum.

And let's not forget Santa Cruz County. With a 37.9 percent increase in sales, this coastal beauty is showing that even in high-demand, picturesque areas, buyers are finding their way to the market and making deals.

These are just the top three, but the fact that 25 counties achieved double-digit growth tells us this isn't an isolated phenomenon. This broad-based strength is what makes this September rebound so compelling. It suggests a fundamental demand for California living, being met by a willingness to transact across a wide spectrum of communities.

A Deeper Dive: What's Driving This County-Level Excitement?

From my experience, this type of widespread, strong growth in specific counties often points to a few key factors.

  • Affordability and Value: While California is known for its high prices, many of these leading counties likely offer comparatively better value. Kings County, for example, with its agricultural roots and more suburban feel, can provide more home for the money compared to bustling metro areas. Buyers squeezed out of more expensive regions are likely looking to these areas for their first step onto the property ladder or for a more spacious home.
  • Lifestyle Appeal: Counties like Santa Cruz offer a unique blend of coastal living, access to nature, and a vibrant community. For many, the allure of this lifestyle, combined with a market that's moving, becomes irresistible.
  • Improved Inventory: In some of these high-growth counties, there may have been a release of pent-up inventory. When buyers see more options, and these options are priced attractively, sales naturally follow.
  • Remote Work Flexibility: The ongoing trend of remote and hybrid work continues to empower people to choose where they live based on lifestyle and cost rather than strict commute requirements. Counties that offer a desirable lifestyle away from major urban centers are prime beneficiaries.

The Other Side of the Coin: Counties Facing Challenges

It's always important to remember that the real estate market is never uniform. While many counties are thriving, some are still navigating choppy waters. The C.A.R. report also highlights ten counties that experienced annual sales declines in September. Among these, six saw drops of more than 10 percent.

  • Trinity County faced a particularly steep decline, with sales dropping by a significant 50 percent. This type of sharp decrease often points to very specific local economic conditions, a lack of desirable inventory, or perhaps a market that was overvalued previously and is now recalibrating.
  • San Benito County saw a reduction of 23.9 percent in sales.
  • Mono County, known for its stunning natural beauty and proximity to popular tourist destinations, experienced a 22.2 percent decrease in sales.

The Median Sale Price and Sales table from C.A.R. shows some interesting dynamics within these slower markets. For instance, Mono County had a very sharp 53.4% increase in median price, which, when combined with a sales decline, could indicate that a few very high-priced sales might have skewed the median, or that inventory has shifted towards higher-end properties, making it harder to move units. Conversely, Trinity County showed a 15.2% median price decrease.

Understanding these disparities is key. It’s not just about the statewide numbers; it’s about being aware of the granular details that impact specific communities.

What Does This County-Level Data Mean for You?

For anyone involved in the California housing market, this breakout of county-level data offers invaluable insights:

  • For Buyers: If you're looking for opportunities, focus on the counties experiencing strong sales growth. These areas often have energetic markets where well-priced homes sell quickly, but they also indicate demand. Research the specific drivers behind the growth in counties like Kings, Calaveras, and Santa Cruz. Conversely, if you're looking for negotiation power, you might find it in counties still experiencing sales declines, but be sure to understand the reasons behind it.
  • For Sellers: If you're in one of the booming counties, you're likely in a strong position. However, don't get complacent! The increased time on market (32 days statewide, up from 24 last September) means that quality and competitive pricing are still vital. If you're in a county with slower sales, it’s even more critical to price your home strategically and present it impeccably.
  • For Investors: The high growth rates in certain counties present compelling opportunities for investors looking for appreciation and rental income potential. The median price per square foot is another metric to watch closely here. While the statewide median price per square foot was $427 in September (up slightly from $424 a year ago), specific county data will reveal much more localized trends.

The Bigger Picture: A Market Finding Its Footing

While the statewide median price saw a modest 1.8 percent year-over-year gain to $883,640, it's the county-level data that reveals the true dynamism. The fact that sales are climbing so significantly in 40 counties indicates a broad return of buyer confidence and a willingness to engage in the market.

This isn't a uniform recovery, but rather a series of localized successes. The California housing market rebounds in September with energy that's clearly palpable in many communities. As a seasoned observer, I see this as a positive sign. It suggests that the market isn't simply relying on one or two major hubs but is being driven by a more distributed, multifaceted demand across the state.

The key takeaways from September are clear: California's housing market is showing resilience, and its strength is being powered by incredible activity in dozens of its counties. Understanding these local nuances is more critical than ever for making smart real estate decisions.

Looking to Build Wealth Like Smart Real Estate Investors?

Norada helps you navigate volatility by connecting you with turnkey, cash-flowing rental properties in resilient markets—so you can protect purchasing power and pursue steady income regardless of short-term rate moves.

🔥 HOT NEW LISTINGS JUST ADDED! 🔥

Talk to a Norada investment counselor today (No Obligation):

(800) 611-3060

Get Started Now

Related Articles:

  • Best Time to Buy a House in California's Largest Metros in 2025
  • California Housing Market Forecast 2026: Will it Crash or Recover?
  • California Housing Market Rebounds Driven by Lower Mortgage Rates
  • Home Prices Drop in 21 Counties in the California Housing Market
  • California Leads With Most At Risk Housing Market Counties in 2025
  • California Housing Market Decline: Sales Drop for 4th Straight Month
  • California Housing Affordability Drops in Q2 2025 Amid High Mortgage Rates
  • Is the California Housing Market Heading for a Crash or Correction?
  • California Housing Market: Forecast and Trends 2025-2026
  • California Housing Market Graph 50 Years
  • The Great Recession and California's Housing Market Crash: A Retrospective
  • California Dominates Housing With 7 of Top 10 Priciest Markets
  • Real Estate Forecast Next 5 Years California: Boom or Crash?
  • Anaheim, California Joins Trillion-Dollar Club of Housing Markets
  • California Housing Market: Nearly $174,000 Needed to Buy a Home
  • Most Expensive Housing Markets in California
  • Abandoned Houses for Free California: Can You Own Them?
  • Homes Under 50k in California: Where to Find Them?

Filed Under: Growth Markets, Housing Market, Real Estate Market Tagged With: california, Housing Market

Best Time to Buy a House in California’s Largest Metros in 2025

October 13, 2025 by Marco Santarelli

Best Time to Buy a House in California's Largest Metros in 2025

Dreaming of buying a house in the sunny state of California? You're probably wondering, “When is the ultimate time to buy a house in California's housing market?” Well, if you're looking for a sweet spot packed with more choices, potentially better prices, and less competition, you'll want to mark your calendars for late September through October. While national trends point to this fall window, the absolute best week can actually shift depending on the specific California metro area you're eyeing.

It’s not just about how much money you have saved; it’s about understanding the subtle ebbs and flows of the market. Many people think spring is the busiest and best time to buy, but from my experience, that's often when the most competition is – think bidding wars and homes flying off the market. The “best” time, for many, is when you have more power as a buyer, and that often happens when things cool down a bit.

Let's dive deep into what makes this fall period so advantageous here in California, looking at major metro areas from San Diego up to Sacramento, and what you can expect.

Best Time to Buy a Home in California's Housing Market in 2025

Why Fall is California's Secret Buying Season

You might be surprised to learn that fall, specifically late September and October, is often cited as a prime time to buy a house across the nation, and California is no exception. Realtor.com's research often highlights this period for several compelling reasons:

  • Increased Inventory: As the frenzied summer buying season winds down, sellers who might have been holding out might decide to list their homes before the colder, less active winter months. This means more options for you to sift through.
  • Less Competition: The eager buyers who were set on moving before the school year starts or the holidays hit have likely already made their moves. This can lead to fewer offers on the table for the homes you're interested in.
  • Motivated Sellers: Sellers in the fall might be more inclined to negotiate. They have been on the market for a while, and the holiday season is approaching, making them more eager to close a deal.
  • Potentially Better Prices: With less competition and more motivated sellers, there's a greater chance to snag a home at a more favorable price or even negotiate a better deal than you might in the spring or summer.

Of course, owning a home in California is a dream for many, and the market here is known for its unique dynamics. While national trends provide a great baseline, understanding your local California market is crucial.

California Metro Areas: Pinpointing Your Prime Buying Window

California is a vast state with incredibly diverse housing markets. What might be the “best week” to buy in Los Angeles could be different for someone looking in Sacramento or San Diego. Based on research by Realtor.com, we can see some of these regional differences. Let's break it down for some of California's largest metro areas:

  • Los Angeles-Long Beach-Anaheim, CA: According to Realtor.com's findings, the ideal window for this sprawling Southern California market often falls around October 12-18. This means you're looking at late October as a strong contender for finding your new home in this bustling region.
  • San Diego-Chula Vista-Carlsbad, CA: For those eyeing the stunning coastal city of San Diego, the suggested sweet spot is October 12-18. Similar to LA, late October presents a favorable time.
  • San Francisco-Oakland-Fremont, CA: The Bay Area's market is notoriously competitive. Realtor.com data suggests the prime buying time here is October 12-18. This is when you might find a slight edge in inventory and seller willingness.
  • San Jose-Sunnyvale-Santa Clara, CA: Silicon Valley often operates on its own timeline. However, for optimal buying conditions, Realtor.com points to October 19-25. This pushes the ideal window slightly later into October compared to some other major metros.
  • Riverside-San Bernardino-Ontario, CA: This Inland Empire region, often offering more affordable options compared to coastal areas, shows a best buying week of September 28 – October 4. This suggests that early October might be your golden ticket here.
  • Sacramento-Roseville-Folsom, CA: Heading north to the state capital, the prime buying time is identified as October 12-18. This aligns with the general fall trend for many significant California markets.

It's fascinating how these windows are clustered. The overwhelming trend for most of California's major metro areas points towards mid to late October. This gives buyers a very clear target to aim for.

Table: Best Buying Weeks for Key California Metro Areas

Metro Area Best Week to Buy
Los Angeles-Long Beach-Anaheim, CA October 12-18
San Diego-Chula Vista-Carlsbad, CA October 12-18
San Francisco-Oakland-Fremont, CA October 12-18
San Jose-Sunnyvale-Santa Clara, CA October 19-25
Riverside-San Bernardino-Ontario, CA September 28 – October 4
Sacramento-Roseville-Folsom, CA October 12-18

Note: Data is based on Realtor.com's analysis for the top 50 largest metro areas, and specific timing can vary slightly year to year.

Beyond the Calendar: What Else Influences the “Best” Time?

While that specific week in October might be statistically ideal, I always tell my clients that a few other factors you should keep in mind:

  1. Your Personal Readiness: Are you financially ready? This is paramount. Do you have a solid down payment saved, your credit score in good shape, and have you been pre-approved for a mortgage? If not, the calendar date might be less important than getting your personal finances in order. Don't let a “good time” rush you into a situation you're not ready for.
  2. Mortgage Interest Rates: This is a huge variable. While inventory might be up in October, if interest rates are soaring, it could significantly impact your monthly payment and overall affordability. Keeping an eye on interest rate trends is just as important as looking at the calendar. Sometimes, a slightly less “ideal” week with lower rates can be a better financial move.
  3. Local Market Conditions: Every neighborhood can have its own micro-market. Even within Los Angeles, a specific zip code might have different trends. Talk to local real estate agents, attend open houses, and get a feel for how quickly homes are selling in the specific areas you're interested in.
  4. Your Lifestyle and Needs: Do you need to move before the end of the year for a job, to be closer to family, or for school? Your personal deadlines and needs will always trump a generic “best time.”

My Take: The Power of Preparation and Patience

In my years of observing and participating in California real estate, I've seen that preparation and patience are the real keys to success, no matter the season. If you're financially prepared and understand your local market's nuances, you can find a great home at a fair price at almost any time of year.

However, the data suggesting late September and October as a prime buying window for many California metro areas is definitely worth paying attention to. It's a time when the market typically experiences a shift towards being more buyer-friendly. You might find more houses to choose from, and sellers could be more open to negotiation.

So, while that October window is a great indicator, remember to combine that knowledge with your personal readiness and a keen understanding of your target California neighborhood. That combination is what will truly help you find the best time for YOU to buy a house in California.

Looking to Build Wealth Like Smart Real Estate Investors?

Norada helps you navigate volatility by connecting you with turnkey, cash-flowing rental properties in resilient markets—so you can protect purchasing power and pursue steady income regardless of short-term rate moves.

🔥 HOT NEW LISTINGS JUST ADDED! 🔥

Talk to a Norada investment counselor today (No Obligation):

(800) 611-3060

Get Started Now

Related Articles:

  • California Housing Market Forecast 2026: Will it Crash or Recover?
  • California Housing Market Rebounds Driven by Lower Mortgage Rates
  • Home Prices Drop in 21 Counties in the California Housing Market
  • California Leads With Most At Risk Housing Market Counties in 2025
  • California Housing Market Decline: Sales Drop for 4th Straight Month
  • California Housing Affordability Drops in Q2 2025 Amid High Mortgage Rates
  • Is the California Housing Market Heading for a Crash or Correction?
  • California Housing Market: Forecast and Trends 2025-2026
  • California Housing Market Graph 50 Years
  • The Great Recession and California's Housing Market Crash: A Retrospective
  • California Dominates Housing With 7 of Top 10 Priciest Markets
  • Real Estate Forecast Next 5 Years California: Boom or Crash?
  • Anaheim, California Joins Trillion-Dollar Club of Housing Markets
  • California Housing Market: Nearly $174,000 Needed to Buy a Home
  • Most Expensive Housing Markets in California
  • Abandoned Houses for Free California: Can You Own Them?
  • Homes Under 50k in California: Where to Find Them?

Filed Under: Growth Markets, Housing Market, Real Estate Market Tagged With: california, Housing Market

20 Wealthy Neighborhoods in Los Angeles

October 12, 2025 by Marco Santarelli

Wealthy Neighborhoods in Los Angeles

Los Angeles, the City of Angels, is renowned for its glitz, glamour, and opulence. It's a city where dreams are made, and fortunes are found. Among its sprawling metropolis lie enclaves of wealth that are not just homes but statements of luxury and exclusivity. Here's a glimpse into the ten wealthiest neighborhoods in Los Angeles, where the city's elite reside and thrive.

Exploring the Wealthiest Neighborhoods of Los Angeles

1. Bel-Air

Bel-Air stands as the epitome of wealth in Los Angeles. Known for its grand estates and as part of the Platinum Triangle, Bel-Air is a symbol of ultimate luxury. The neighborhood boasts gated communities and exclusive clubs, offering privacy and prestige. The average real estate price here soars to $4.27 million.

2. Pacific Palisades

With its stunning ocean views and pristine landscapes, Pacific Palisades is a coastal paradise. This neighborhood is perfect for those seeking a serene lifestyle with easy access to beaches and nature. The average home value in Pacific Palisades is around $3.8 million.

3. Beverly Hills

Perhaps the most famous of all, Beverly Hills is synonymous with wealth and celebrity. Home to the iconic Rodeo Drive, this neighborhood offers luxury shopping, five-star dining, and palatial homes, with median prices at $3.65 million.

4. Malibu

Malibu is the beachfront haven for the rich and famous. With its long stretches of beach and private coves, residents enjoy a unique blend of laid-back beach life and opulence. The median home price in Malibu is $3.4 million.

5. Beverly Crest

Tucked in the Santa Monica Mountains, Beverly Crest offers secluded luxury with breathtaking views. It's a community that prides itself on privacy and exclusivity, with homes nestled in the hills.

6. Windsor Square

Windsor Square is a historic and affluent neighborhood, known for its well-preserved early 20th-century homes. It's a tight-knit community that exudes old-world charm and elegance.

7. Brentwood

Brentwood is an affluent suburb with a mix of luxury homes, upscale shops, and lush parks. It's a neighborhood that offers a suburban feel with all the amenities of city life.

8. University Park

University Park is an intellectual hub, home to the University of Southern California. It's a neighborhood that combines historic residences with cultural richness.

9. Holmby Hills

Part of the Platinum Triangle, Holmby Hills is known for its large estates and famous landmarks like the Playboy Mansion. It's a neighborhood that represents old Hollywood glamour.

10. Hancock Park

Hancock Park is a historic neighborhood that has maintained its 1920s charm. With its broad lawns and mature trees, it offers a picturesque setting that's steeped in history.

11. Studio City

Studio City is a vibrant neighborhood known for its entertainment industry ties and upscale living. With a median household income of $105,301, it's a place where celebrities and creatives mingle. The median house price hovers around $1.39 million, reflecting the area's desirability.

12. Hollywood Hills

Nestled in the Santa Monica Mountains, Hollywood Hills is synonymous with celebrity culture and luxury. With a median income of $108,400, it offers stunning views and architectural marvels, boasting a median home price of $2 million.

13. West Hills

West Hills, with its suburban charm and community focus, has a median income of $109,439. It's a neighborhood that balances tranquility with accessibility, providing a retreat from the city's hustle while remaining connected.

14. Encino

Encino features wide boulevards lined with palatial homes and is known for its affluent residents and peaceful environment. The neighborhood's median income is significant, reflecting its status as a wealthy enclave.

15. Silver Lake

Silver Lake is a trendy neighborhood that combines modernist architecture with a bohemian atmosphere. It's a hub for artists and entrepreneurs, with property values consistently on the rise.

16. Los Feliz

Los Feliz is a neighborhood with a rich history and a vibrant cultural scene. It boasts grand old homes and a median income that places it among the city's wealthiest areas.

17. Sherman Oaks

Sherman Oaks offers a mix of urban and suburban living, with a variety of high-end shops and restaurants. The neighborhood's affluence is evident in its real estate prices and the lifestyle of its residents.

18. Griffith Park

Griffith Park is not just a neighborhood but a landmark, offering sprawling green spaces and exclusive properties that are coveted by those seeking both luxury and nature.

19. Tarzana

Named after the fictional estate of Tarzan, Tarzana is a neighborhood that exudes a sense of adventure and exclusivity. With its lush landscapes and affluent community, it's a prime location for luxury living.

20. Toluca Lake

Toluca Lake is a small, picturesque neighborhood known for its celebrity residents and tranquil lake. The area's wealth is reflected in its well-maintained properties and the high quality of life enjoyed by its inhabitants.

These neighborhoods, each with their unique character and appeal, contribute to the tapestry of Los Angeles' rich and diverse landscape. They are not just places of residence but are landmarks of success, offering their inhabitants not just a home, but a statement of their achievements and aspirations. In these neighborhoods, the Los Angeles dream of luxury, comfort, and exclusivity becomes a reality.

Each of these neighborhoods tells a story of Los Angeles' evolution from a burgeoning city to a global icon of prosperity. The allure of these neighborhoods goes beyond their price tags; it's about the status, history, and lifestyle that come with residing in some of the most sought-after zip codes in the world.

Whether it's the beachfront opulence of Malibu or the historic elegance of Hancock Park, each neighborhood offers a unique slice of luxury living in the heart of Southern California.

Work with Norada, Your Trusted Source for Turnkey Investment Properties

Discover high-quality, ready-to-rent properties designed to deliver consistent returns.

Contact us today to expand your real estate portfolio with confidence.

Contact our investment counselors (No Obligation):

(800) 611-3060

Get Started Now

Recommended Read:

  • 24 Most Expensive Neighborhoods in California
  • Los Angeles Housing Market: Prices, Trends, Forecast 2025-2026
  • Minimum Qualifying Income to Buy a House in Los Angeles is $219,200
  • Top 5 Richest Cities in the Los Angeles County
  • Most Expensive Real Estate in the World: Top 10 Luxurious Properties
  • 10 Most Expensive Real Estate Markets in the World
  • 22 Cheapest Places to Live in Southern California
  • Cheapest Housing Markets in California: Affordable Cities

Filed Under: Housing Market Tagged With: california, Housing Market, Los Angeles

California Housing Market Forecast 2026: Will it Crash or Recover?

October 1, 2025 by Marco Santarelli

California Housing Market Forecast 2026: What to Expect?

The California housing market in 2026 is shaping up to be a year of modest growth and slightly improved affordability. While we won't see the rapid surges of years past, expect a gentle uptick in home sales and a record-breaking median price that hints at a market finding its footing after more challenging times.

I've seen cycles come and go. It's always tempting to focus on the dramatic swings, but sometimes the most insightful observations come from understanding the subtle shifts. The California Association of Realtors (C.A.R.) latest forecast for 2026 offers a glimpse into a market that's stabilizing, and for many, that stability is actually good news.

California Housing Market Forecast 2026: Will it Crash or Recover?

Sales on the Upswing, But Don't Expect a Frenzy

According to C.A.R., we're looking at an increase of about 2 percent in existing, single-family home sales in 2026. This means an estimated 274,400 units could change hands. This might not sound like headline-grabbing news, especially when you compare it to the booming sales numbers of a few years ago. However, it’s a welcome step up from the projected 269,000 sales for 2025, which itself is a slight dip from the 269,200 homes sold in 2024.

Think of it like this: the market has been catching its breath. After a period of intense activity, it's natural for things to calm down a bit. This projected increase in sales in 2026 signifies a gradual return to normalcy, rather than a mad dash. For buyers who have been priced out or overwhelmed by competition, this could mean more options and a slightly less frantic search.

A New Price Record, But At a Slower Pace

Here's a fact that will likely grab attention: California's median home price is forecast to hit a new projected record of $905,000 in 2026. This represents a 3.6 percent increase from the projected $873,900 in 2025. It’s important to remember that this follows a more modest 1 percent rise in 2025 from the $865,400 median price in 2024.

Now, I know what some of you might be thinking: “More expensive? Great!” But it's crucial to dig a little deeper. This 3.6 percent growth is significantly slower than the double-digit increases we've witnessed in some prior years. This is a key indicator that the market is moving away from rapid appreciation and towards a more sustainable growth pattern. As C.A.R. President Heather Ozur mentioned, “Home prices in California are expected to rise in 2026, but the growth pace will remain mild when compared to rates we’ve seen in past years.” This is a message of moderation, not runaway inflation.

Improved Affordability: A Breath of Fresh Air

One of the most encouraging pieces of the 2026 forecast is the projected increase in housing affordability. We're looking at the Housing Affordability Index inching up to 18 percent in 2026, from a projected 17 percent in 2025, and 16 percent in 2024.

What does this mean for the average Californian? It means a slightly larger percentage of households will be able to afford to buy a median-priced home. This improvement is largely driven by a projected decrease in mortgage interest rates. C.A.R. forecasts the average 30-year, fixed mortgage rate to dip to 6.0 percent in 2026, down from 6.6 percent in 2025. While these rates are still higher than the pre-pandemic era, they represent a significant improvement from recent years and are well below the long-term average of nearly 8 percent. Lower interest rates, combined with a slight uptick in inventory, creates a more favorable environment for buyers.

Economic Undercurrents: What's Driving the Forecast?

It's vital to understand the broader economic forces that are shaping this housing forecast. C.A.R. projects a slight slowdown in U.S. GDP growth to 1 percent in 2026, following a projected 1.3 percent in 2025. California's nonfarm job growth is also expected to be modest at 0.3 percent in 2026, contributing to a projected unemployment rate of 5.8 percent.

This might sound a bit concerning, but in the context of the housing market, it can play a balancing role. A strong, rapidly growing economy can fuel rapid home price appreciation. A more measured economic pace, on the other hand, helps to temper extreme price swings and contribute to the stability we're forecasting.

We also anticipate inflation to average around 3.0 percent in 2026, a slight increase from the projected 2.8 percent in 2025. While higher inflation can erode purchasing power, the projected drop in mortgage rates is expected to offset some of this impact on housing affordability.

Inventory: A Gradual Improvement

A key factor influencing both sales and prices is the availability of homes for sale. The 2026 forecast suggests that housing supply will continue to improve, potentially reaching near pre-pandemic levels. Active listings are expected to be up by nearly 10 percent. This is excellent news for buyers who have been frustrated by the lack of choices.

When there are more homes on the market, sellers have to be more competitive, and buyers have more leverage. This gradual increase in inventory is crucial for sustaining a healthy market. As Jordan Levine, C.A.R.'s Senior Vice President and Chief Economist, pointed out, “Housing sentiment will see some improvement in 2026” as economic uncertainty clears and mortgage rates decline.

Challenges on the Horizon

While the forecast paints a picture of cautious optimism, it's not without its potential hurdles. Levine also highlighted ongoing challenges such as “mounting headwinds such as the ongoing trade tensions between the U.S. and its trading partners, the home insurance crisis, and a potential stock market bubble.”

These are important considerations. The home insurance crisis, in particular, continues to be a significant concern for many homeowners and can impact buying decisions. Trade tensions and stock market volatility can create broader economic uncertainties that could influence consumer confidence and, consequently, the housing market.

My Take: A Market for Savvy Buyers and Patient Sellers

From my perspective, the 2026 California housing market forecast points to a period of balanced conditions. For buyers, this means opportunities. The slight increase in affordability, coupled with a more stable price appreciation and improving inventory, makes it a more approachable market than in recent years. It's a time to be strategic, do your research, and potentially negotiate from a stronger position.

For sellers, it's important to have realistic expectations. While prices are projected to rise and sales are expected to increase, the days of wildly inflated offers might be behind us for now. A well-priced, well-presented home will still attract strong interest, but patience and a clear understanding of current market values will be essential.

The key takeaway for me is that the California housing market is evolving. It's moving away from the extreme volatility of the past and towards a more sustainable, predictable future. It’s less about getting lucky and more about making smart, informed decisions.

2026 California Housing Forecast Summary

Metric 2024 2025 (Projected) 2026 (Forecast) % Change (2025-2026)
SFH Resales (000s) 269.2 269 274.4 2.00%
Median Price ($000s) $865.40 $873.90 $905.00 3.60%
Housing Affordability Index* 16% 17% 18% N/A
30-Yr FRM 6.70% 6.60% 6.00% ↓

*Note: Housing Affordability Index is the percentage of households that can afford to purchase a median-priced home.

Looking to Build Wealth Like Smart Real Estate Investors?

Norada helps you navigate volatility by connecting you with turnkey, cash-flowing rental properties in resilient markets—so you can protect purchasing power and pursue steady income regardless of short-term rate moves.

🔥 HOT NEW LISTINGS JUST ADDED! 🔥

Talk to a Norada investment counselor today (No Obligation):

(800) 611-3060

Get Started Now

Related Articles:

  • California Housing Market Rebounds Driven by Lower Mortgage Rates
  • Home Prices Drop in 21 Counties in the California Housing Market
  • California Leads With Most At Risk Housing Market Counties in 2025
  • California Housing Market Decline: Sales Drop for 4th Straight Month
  • California Housing Affordability Drops in Q2 2025 Amid High Mortgage Rates
  • Is the California Housing Market Heading for a Crash or Correction?
  • California Housing Market: Forecast and Trends 2025-2026
  • California Housing Market Graph 50 Years
  • The Great Recession and California's Housing Market Crash: A Retrospective
  • California Dominates Housing With 7 of Top 10 Priciest Markets
  • Real Estate Forecast Next 5 Years California: Boom or Crash?
  • Anaheim, California Joins Trillion-Dollar Club of Housing Markets
  • California Housing Market: Nearly $174,000 Needed to Buy a Home
  • Most Expensive Housing Markets in California
  • Abandoned Houses for Free California: Can You Own Them?
  • Homes Under 50k in California: Where to Find Them?

Filed Under: Growth Markets, Housing Market, Real Estate Market Tagged With: california, Housing Market

  • 1
  • 2
  • 3
  • …
  • 7
  • Next Page »

Real Estate

  • Birmingham
  • Cape Coral
  • Charlotte
  • Chicago

Quick Links

  • Markets
  • Membership
  • Notes
  • Contact Us

Blog Posts

  • Fed Cuts Rate Today by 25 Basis Points in its Final FOMC Meeting of 2025
    December 10, 2025Marco Santarelli
  • Today’s Mortgage Rates, Dec 10: Rates Move Higher as Markets Brace for Fed Decision
    December 10, 2025Marco Santarelli
  • Mortgage Rate Predictions for Next 5 Years: 2026-2030
    December 10, 2025Marco Santarelli

Contact

Norada Real Estate Investments 30251 Golden Lantern, Suite E-261 Laguna Niguel, CA 92677

(949) 218-6668
(800) 611-3060
BBB
  • Terms of Use
  • |
  • Privacy Policy
  • |
  • Testimonials
  • |
  • Suggestions?
  • |
  • Home

Copyright 2018 Norada Real Estate Investments

Loading...