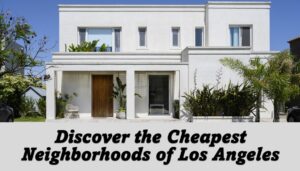
Dreaming of living in the City of Angels but worried about your wallet? You're not alone! Los Angeles is famously glamorous and can feel notoriously expensive, with the citywide median home price sitting around a hefty $970,000 and average one-bedroom rents hovering near $2,700. However, I've dug into the numbers, and I can tell you definitively that finding an affordable spot in LA is absolutely possible.
The key is knowing where to look beyond the shiny brochures and famous zip codes. This guide dives deep into the 10 cheapest neighborhoods in Los Angeles, where you can snag a home for around $625,000 to $855,000 and rent a one-bedroom for roughly $1,100 to $2,200, offering a fantastic gateway into the LA lifestyle without breaking the bank.
As a longtime observer and frequent explorer of this sprawling metropolis, I've seen firsthand how much prices can swing from one block to the next. It often feels like a detective mission to uncover these hidden gems.
The data from sources like Zillow, Redfin, and Apartment List consistently points to certain pockets that offer a far better bang for your buck. These aren't just places with lower prices; they are vibrant communities with their own unique character, rich cultural tapestries, and surprisingly good access to everything LA has to offer.
We’re talking about areas that, even as the LA housing market saw a modest increase in median sale prices to over $1 million by late 2025, continued to offer accessible entry points. In fact, rents even saw a slight dip in late 2025, which is fantastic news for anyone looking for affordability.
What I find most compelling is that these affordable neighborhoods often hold the real heart of Los Angeles – the diverse communities, the incredible food, the burgeoning arts scenes, and the genuine neighborly spirit that sometimes gets lost in the glossier parts of town. Of course, no place is perfect. Sometimes, a lower price tag might mean a slightly longer commute or being mindful of safety statistics.
But that's precisely why I've broken down each neighborhood, giving you the inside scoop on what to expect, the good and the… well, the areas that might require a bit more thought. So, let’s get started on this exciting journey to find your affordable LA dream.
Understanding Affordability: It's More Than Just Rent
I always tell people that affordability in a city like Los Angeles is a balancing act. It's not just about the monthly rent or the mortgage payment. It’s about the whole package: how much your groceries cost, how much you spend on gas or public transit, your utility bills, and, importantly, the quality of life you get for your money.
In 2025, LA's overall cost of living was about 50% higher than the national average, with housing often eating up a huge chunk of people's budgets – sometimes 40-50%.
The neighborhoods we're looking at tend to score much better on affordability indexes. Why? Usually, it's a combination of factors: lower property taxes (around 0.8% of the home's value), more budget-friendly supermarkets, and readily available public transportation options that can cut down on car expenses.
Of course, you'll still be looking at utilities that might add up to $200 a month, and gas prices weren't exactly cheap either, hovering around $4.50 a gallon.
When you look at the demographics, these areas are incredibly diverse. Many have a significant Latino population, often making up 60-80% of residents, with median household incomes typically in the $50,000 to $70,000 range. This is a bit lower than LA's citywide median of around $75,000, which just goes to show how these neighborhoods offer a more accessible price point.
Now, about safety: it’s true that some urban areas can have higher crime rates than quieter suburbs, but many of these neighborhoods are experiencing positive trends thanks to community policing efforts and local initiatives. And commutes?
On average, expect to spend anywhere from 30 to 50 minutes getting to Downtown LA, either by car on the freeways or using the Metro system. Schools are generally rated around a 5-7 out of 10 on sites like GreatSchools, with a growing number of charter schools offering alternative options.
Looking ahead, the real estate market is always a bit of a guessing game, but even with mortgage rates around 6.3% in late 2025, experts were predicting modest price growth of 3-4% for 2026. This could mean these already undervalued spots might see some nice appreciation. For renters, rent stabilization policies, capping increases at 4% for older buildings, provide some much-needed predictability.
Here’s a quick snapshot comparing these neighborhoods to the city as a whole and the national average:
Comparative Affordability Table (2025 Data)
| Metric | Citywide Average | These Neighborhoods Avg. | National Avg. |
|---|---|---|---|
| Median Home Price | $970,000 | $725,000 | $400,000 |
| Avg 1BR Rent | $2,700 | $1,800 | $1,450 |
| Cost of Living Index | 150 | 130-140 | 100 |
| Median Income | $75,000 | $60,000 | $68,000 |
| Property Tax Rate | 0.8% | 0.8% | 1.1% |
10 Cheapest Neighborhoods in Los Angeles
Let's dive into the specific areas that are making LA more accessible. I’ve tried to capture the essence of each place, giving you more than just numbers.
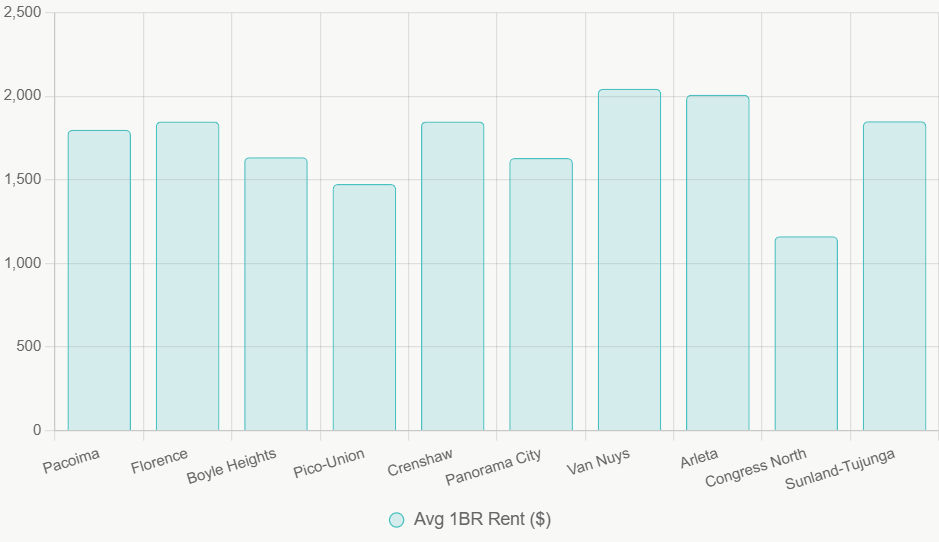
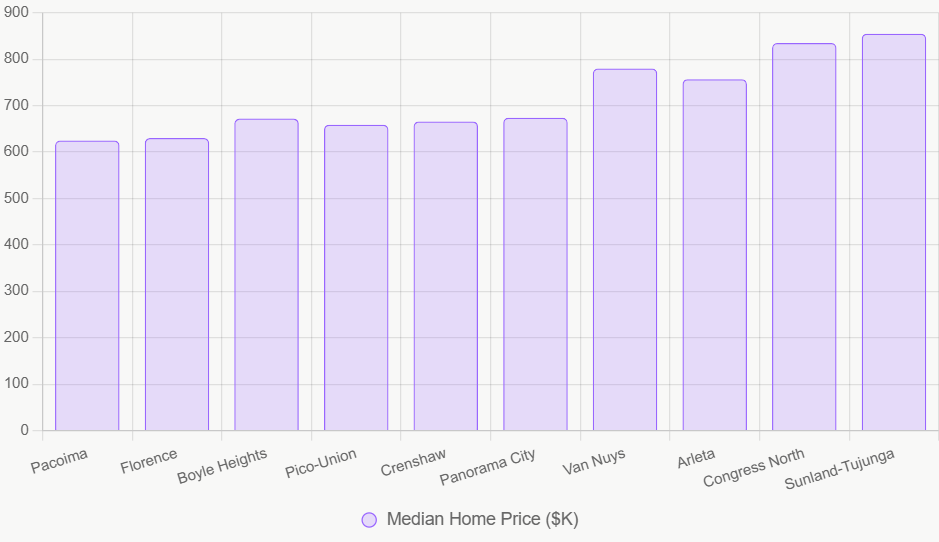
Quick Comparison Table of the 10 Cheapest Neighborhoods
| Neighborhood | Avg 1BR Rent (2025) | Median Home Price (2025) | Key Appeal |
|---|---|---|---|
| Pacoima | $1,800 | $625,000 | Family-focused, parks |
| Florence | ~$1,850 | $630,000 | South LA culture, transit |
| Boyle Heights | $1,636 | ~$672,000 | Murals, taquerias, arts |
| Pico-Union | $1,475 | $659,000 | Historic, central access |
| Crenshaw | $1,850 | $666,000 | African-American art hub |
| Panorama City | $1,631 | $674,000 | Valley value, recreation |
| Van Nuys | $2,045 | $780,000 | Transit hub, diverse food |
| Arleta | $2,010 | $757,000 | Quiet residential, yards |
| Congress North | $1,163 | $835,000 | Walkable, near Expo Line |
| Sunland-Tujunga | $1,851 | $855,000 | Nature trails, suburban feel |
1. Pacoima
Location: Northeast San Fernando Valley
Median Home Price: ~$625,000 (Reports show a decrease of about 12.6% year-over-year as of November 2025)
Average 1BR Rent: ~$1,800
Pacoima feels like a classic, family-oriented neighborhood with deep roots, especially within its predominantly Latino community (80% of residents). It’s the kind of place where neighbors know each other. If you're looking for space and a strong sense of community, this might be your spot.
- Demographics: Median age is around 32, with household incomes averaging about $65,000.
- Safety: While crime rates are a bit higher than the city average, community programs are actively working to improve things, with a focus on property crimes.
- Amenities: You’ve got great local spots like Branford Park for sports and picnics, and local markets like Vallarta Supermarket for groceries. For outdoor adventures, Hansen Dam is a popular spot for hiking.
- Commute: Getting to Downtown LA will take you about 45-60 minutes via the I-5 or 118 freeways. Public transit options are available through bus lines, but it's more car-dependent.
- Schools: Pacoima Middle School gets a 6/10, and there are charter options like Discovery Charter Prep that score an 8/10.
- My Take: Pacoima offers excellent value, especially for families. The community events, like the vibrant Dia de los Muertos festivals, are truly special. The main drawbacks are that you'll likely need a car, and air quality can be a concern due to nearby airports. I see potential here, with new retail developments suggesting good growth prospects for home values, maybe around 5% in 2026.
2. Florence
Location: South LA
Median Home Price: ~$630,000 (Reported a slight decrease of 3.1% year-over-year)
Average 1BR Rent: ~$1,850
Florence offers a raw, authentic LA experience. It’s a neighborhood with a strong community spirit and a gritty charm that many residents cherish. If you want to experience South LA's rich culture, this is a great starting point.
- Demographics: Richly diverse with about 70% Latino and 20% Black residents. Median income is around $55,000, with the median age at 30.
- Safety: Crime rates can be a concern, particularly violent crime. However, the LAPD has made efforts, reportedly reducing incidents by about 10% since 2024.
- Amenities: You'll find local parks, various markets, and you're not far from landmarks like the Watts Towers. The casual dining scene is great, with plenty of soul food spots.
- Commute: A quick 30-45 minute trip to Downtown LA is possible via the Metro A Line or the I-110 freeway.
- Schools: Florence Avenue Elementary has a rating of 5/10.
- My Take: Florence is all about culture and improving transit. It’s not the place for a bustling nightlife, and it’s definitely a dense urban environment. However, ongoing redevelopment projects could slowly nudge property values upward.
3. Boyle Heights
Location: East of Downtown LA
Median Home Price: ~$672,000 (This is an average, with Zillow at $629k and Redfin at $715k)
Average 1BR Rent: ~$1,636
Boyle Heights is a living museum of Mexican-American history and culture. Walking through its streets, you’ll see stunning murals, smell incredible food, and feel the pulse of a community that has shaped so much of LA's identity.
- Demographics: Overwhelmingly Latino (about 85%), with a median income of $52,000 and a median age of 31.
- Safety: Crime is moderate, often involving property theft. Interestingly, the vibrant community murals seem to act as a deterrent to vandalism.
- Amenities: Mariachi Plaza is a cultural landmark, and you can’t miss the authentic taquerias like Guisados. The Gold Line is a convenient way to get around. It also boasts a walk score of 78.
- Commute: Just a 20-30 minute hop to Downtown LA.
- Schools: Roosevelt High School scores a 6/10.
- My Take: Boyle Heights is a gem for its arts scene and family-friendly markets. The main challenges are traffic congestion and the pressures of gentrification. I believe its strong cultural identity will help it remain a stable and desirable place to live.
4. Pico-Union
Location: West of Downtown LA
Median Home Price: ~$659,000
Average 1BR Rent: ~$1,475
As one of LA's oldest neighborhoods, Pico-Union has a rich history and a strong Central American influence. It’s a vibrant, bustling area that offers a true urban living experience.
- Demographics: Around 75% Latino, with a median income of $48,000 and a median age of 29.
- Safety: Crime rates are on the higher side, but its central location means that policing is generally more present.
- Amenities: You'll find fantastic pupuserias, historic churches, and plenty of discount stores. The Metro system is easily accessible here. Its walk score is a solid 80.
- Commute: Downtown LA is incredibly close, just a 15-25 minute trip.
- Schools: Berendo Middle School rates a 5/10.
- My Take: Pico-Union has so much historic charm and is wonderfully walkable. The downsides are the scarcity of parking and the general density. However, its proximity to USC is starting to make it more attractive for potential value appreciation.
5. Crenshaw
Location: South LA
Median Home Price: ~$666,000
Average 1BR Rent: ~$1,850
Crenshaw is a cultural powerhouse, especially significant for its African-American heritage. It’s a historically rich area that’s also experiencing a modern renaissance, with a cool, laid-back vibe.
- Demographics: A mix of 60% Black and 30% Latino residents, with a median income of $60,000 and a median age of 35.
- Safety: Like many urban areas, property crime is an issue, but community hubs are actively working to improve safety.
- Amenities: Leimert Park Village is a must-visit for art and music lovers. Don't miss out on legendary spots like Dulan's soul food. Commuting is easy via the Expo Line.
- Commute: About a 30-minute ride to Downtown via the Expo Line.
- Schools: Crenshaw High School scores a respectable 7/10.
- My Take: Crenshaw offers a unique blend of trendy yet calm, with a growing number of art galleries. The limited high-end shopping might be a drawback for some, but its cultural significance and rising interest mean property prices are likely to see about a 4% increase.
6. Panorama City
Location: Central San Fernando Valley
Median Home Price: ~$674,000
Average 1BR Rent: ~$1,631
If you're looking for more space for your buck in the San Fernando Valley, Panorama City is worth checking out. It's a diverse and generally quieter part of the valley.
- Demographics: Quite diverse, with about 70% Latino residents. Median income is around $62,000.
- Safety: Generally considered average. The presence of rec centers helps keep youth engaged.
- Amenities: You have the Sepulveda Recreation Center for sports and activities, and the Panorama Mall for shopping. Its walk score is 69.
- Commute: You're looking at a 35-50 minute drive to Downtown LA, primarily via the I-405 freeway.
- Schools: Vista Middle School gets a 6/10.
- My Take: This neighborhood is a good choice if you prefer a slightly less hectic pace and access to sports facilities. The main flip side is being dependent on a car for most errands. I expect steady growth here as the Valley remains an attractive area for many.
7. Van Nuys
Location: San Fernando Valley
Median Home Price: ~$780,000
Average 1BR Rent: ~$2,045
Van Nuys is a key hub in the Valley, known for its excellent public transit connections and a diverse food scene that reflects its multicultural population.
- Demographics: A mixed population, with about 50% Latino residents. Median income is around $65,000.
- Safety: Crime is moderate. The presence of a government center contributes to a sense of security.
- Amenities: It boasts beautiful Lake Balboa Park, countless taco trucks and diverse eateries, and the Metrolink station. Its walk score is 71.
- Commute: A manageable 30-45 minute commute to Downtown.
- Schools: Van Nuys High School is rated 7/10.
- My Take: Van Nuys offers a fantastic variety of food and great park access. The streets can be busy, but upcoming infrastructure upgrades could make it even more appealing.
8. Arleta
Location: San Fernando Valley
Median Home Price: ~$757,000
Average 1BR Rent: ~$2,010
Arleta offers a more traditional, quiet residential feel within the San Fernando Valley. If you're looking for a place with yards and a bit more privacy, this is a contender.
- Demographics: Predominantly Latino, at about 75%, with a median income of $68,000.
- Safety: Known for low crime rates, making it very family-friendly.
- Amenities: Branford Park is nearby, and the streets are generally wider and less congested than in more urban areas. It has a walk score of 51.
- Commute: About a 40-minute drive to Downtown via the CA-170 freeway.
- Schools: Arleta High School scores a 6/10.
- My Take: Arleta is all about peace, quiet, and space. The downside is that it's quite car-dependent. Its suburban stability is its main draw.
9. Congress North
Location: Near West Adams
Median Home Price: ~$835,000
Average 1BR Rent: ~$1,163
This is a particularly interesting find, offering some of the lowest rents I've seen. It's a compact area right near the vibrant West Adams neighborhood, known for its revitalization.
- Demographics: Diverse population, with a median income around $58,000.
- Safety: Safety is improving as the area sees more development.
- Amenities: You'll find a growing number of cozy cafes and importantly, it's very close to the Expo Line, making transit a breeze. It has an excellent walk score of 80.
- Commute: Downtown LA is only about 20 minutes away.
- Schools: Residents often have access to excellent schools near USC.
- My Take: The budget-friendly rents here are a huge draw. While parking can be a challenge, its walkability and proximity to transit and developing areas make it a very shrewd choice. I anticipate this area will continue to gentrify.
10. Sunland-Tujunga
Location: Foothills of the San Gabriel Mountains
Median Home Price: ~$855,000
Average 1BR Rent: ~$1,851
For those who love nature and a suburban feel, Sunland-Tujunga offers an escape into the foothills. It’s a peaceful area with access to incredible hiking trails.
- Demographics: A mix of about 60% White and 30% Latino residents, with a median income around $70,000.
- Safety: Generally very safe, with a quiet, almost rural atmosphere.
- Amenities: The Angeles National Forest is your backyard, offering endless outdoor activities. You'll find charming cottage-style homes. Its walk score is 56.
- Commute: It's a bit more remote, with a 45-60 minute commute to Downtown LA.
- Schools: Verdugo Hills High School gets a 7/10.
- My Take: This is the place for tranquility and nature lovers. Its distance from the city center is the main trade-off. The growing interest in eco-friendly living could make this area even more appealing in the future.
Broader Insights and Tips for Navigating LA on a Budget
Living in these neighborhoods means embracing the real, diverse Los Angeles. I’ve found that they often offer a more authentic experience than the more touristy or affluent areas. For potential homebuyers, the good news is that in early 2025, about 17% of households could actually afford the median home prices in these areas, which was an improvement from previous years. Renters, you're in a good spot too, with rents stabilizing, though competition is always a factor in LA.
When you're on the hunt, I highly recommend using tools like RentCafe to find listings and checking local crime maps on LAPD websites for the most up-to-date safety information. If you're considering buying in the Valley, be aware that Homeowners Associations (HOAs) are common and can add $200-$400 per month to your costs.
It's also worth considering the environmental factors. The Valley can experience intense heat waves, and some South LA areas might have air quality concerns. On the economic front, many of these neighborhoods offer good proximity to job centers, whether it's logistics in the Valley or educational and healthcare jobs near areas like USC.
In summary, while the Los Angeles housing market continues to evolve, these ten neighborhoods stand out as viable, affordable options. They offer a chance to live the LA dream without the overwhelming financial strain. My best advice? Visit them, walk around, talk to locals, and see where you feel most at home. Consulting with local real estate agents who specialize in these areas can also provide invaluable personalized advice. Happy house hunting!
Want stronger returns? Invest where the housing market’s growing. In 2026, select U.S. cities are projected to see surging demand, rising rents, and appreciation—creating prime opportunities for investors seeking passive income and long‑term wealth.
Work with Norada Real Estate to find stable, cash-flowing markets beyond the bubble zones—so you can build wealth without the risks of ultra-competitive areas.
Recommended Read:
- 24 Most Expensive Neighborhoods in California
- Los Angeles Housing Market: Prices, Trends, Forecast 2025-2026
- Minimum Qualifying Income to Buy a House in Los Angeles is $219,200
- Top 5 Richest Cities in the Los Angeles County
- Most Expensive Real Estate in the World: Top 10 Luxurious Properties
- 10 Most Expensive Real Estate Markets in the World
- 22 Cheapest Places to Live in Southern California
- Cheapest Housing Markets in California: Affordable Cities