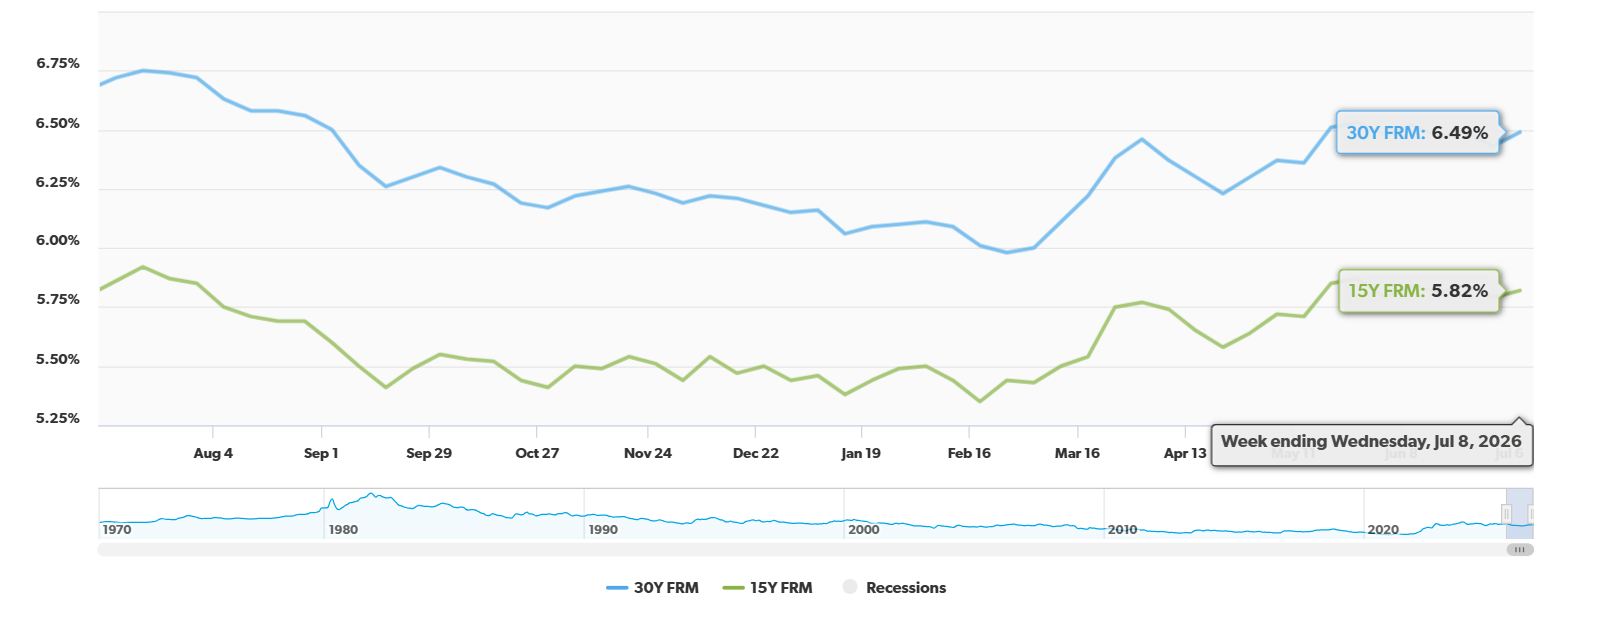
If you're thinking about buying a home or refinancing your current one, you're probably wondering about today's mortgage rates for July 14. Well, I've got the quick answer for you: According to Zillow, the average 30-year fixed mortgage rate is 6.42% today. This is a small dip from yesterday, which is good news for some!
Today's Mortgage Rates, July 14: 30‑Year Fixed Drops to 6.42% While ARMs Edge Higher
Here’s a quick look at some of the most common mortgage rates, as reported by Zillow for today, July 14, 2026:
| Loan Type | Current Rate |
|---|---|
| 30-year fixed | 6.42% |
| 20-year fixed | 6.19% |
| 15-year fixed | 5.92% |
| 5/1 ARM | 6.57% |
| 7/1 ARM | 6.36% |
| 30-year VA | 5.94% |
| 15-year VA | 5.63% |
| 5/1 VA | 5.77% |
Basis points are just a small way of measuring changes. 100 basis points equals 1%. So, a dip of 2 basis points means the rate went down by a tiny, tiny bit, like 0.02%.
Understanding the Most Popular Rates
When most people talk about mortgages, they usually mean one of these three:
- The 30-Year Fixed-Rate Mortgage: This is the most popular choice for a reason. You pay your mortgage for 30 years, and your interest rate stays the same the whole time. This means your monthly payment for the principal and interest part of your loan will never change. It’s like having a steady friend. You might pay a little more interest over the full 30 years compared to a shorter loan, but your monthly payments are usually lower, which makes it easier to afford a home. Today, it’s at 6.42%.
- The 15-Year Fixed-Rate Mortgage: This loan is paid off in half the time, 15 years. Because you're paying it off faster, the interest rate is usually lower than a 30-year loan. Today, it’s at 5.92%. The trade-off? Your monthly payments will be higher. It’s a great option if you can comfortably afford those bigger payments and want to be debt-free sooner, saving a lot of money on interest in the long run.
- The 5/1 Adjustable-Rate Mortgage (ARM): This one is a bit different. For the first 5 years, you get a fixed interest rate. After those 5 years are up, the rate can change, usually once a year, based on what’s happening in the economy. It might start with a lower rate than a fixed loan (today it’s at 6.57%, which is higher than the 30-year fixed, so that’s interesting!), but you have to be ready for your payments to go up or down later on. It’s a good option if you plan to sell your home or refinance before the fixed period ends, or if you're comfortable with the possibility of changing payments.
Why Are Rates Doing This? My Take.
It’s easy to get lost in the numbers, but what's really driving these changes? From my experience, it’s rarely just one thing. Today, we're seeing a lot of big global and economic forces at play:
- Worries in the World: There's been some tension overseas, particularly involving the U.S. and Iran. This can mess with how much oil costs. When oil prices go up, it often makes everything else cost a bit more, too. It’s like a ripple effect.
- Inflation Making a Comeback: Remember when things were getting cheaper, or at least not getting much more expensive? Well, with those higher energy costs, inflation is showing its face again. Recent reports show prices went up a bit more than people expected. This makes people a bit nervous that the economy isn't quite as stable as we hoped.
- The Federal Reserve's Balancing Act: The people in charge of our country's money, the Federal Reserve, have been trying to keep things steady. They cut rates a bit before, but now they're holding back on more cuts. They’re worried about this inflation sticking around, so they’re keeping the main interest rate high to try and cool things down. This means the hope for even lower mortgage rates right now might be a bit dashed.
- Bond Market Jitters: Mortgage rates are very closely tied to something called the 10-year U.S. Treasury yield. Think of it like this: when investors are worried about inflation, they want to get paid more for lending their money out. So, the yield on these government bonds goes up. When that goes up, mortgage rates usually follow. Today, that yield is around 4.58%, and it’s pulling mortgage rates up with it.
- New Boss at the Fed: There’s a new person leading the Federal Reserve, and their approach to fighting inflation seems a bit more serious. They’re not as chatty about their plans, which can make the markets a bit jumpy. When there’s uncertainty, markets can swing more dramatically, affecting mortgage rates quickly.
Will Rates Go Up or Down?
This is the million-dollar question, right? Based on what I'm seeing and hearing from economic experts, it's tough to say for sure. The Federal Reserve seems determined to keep inflation under control, which means they might keep interest rates higher for longer. However, if economic growth slows down more than expected, or if those global tensions ease up significantly, we could see rates start to tick down again.
For now, expect continued choppiness. It’s wise to stay informed and be ready to act if you see a rate that works for your budget.
What Does This Mean for You?
If you’re in the market for a home, these fluctuating rates mean it’s more important than ever to shop around and compare offers from different lenders. Even a small difference in the rate can save you thousands of dollars over the life of your loan.
- Get Pre-Approved: This is crucial! Knowing how much you can borrow helps you focus your house hunt and shows sellers you're serious.
- Lock in a Rate: If you find a rate you like, ask your lender about locking it in. This protects you if rates go up while you're in the process of buying.
- Consider Your Timeline: Are you planning to stay in your home for many years, or just a few? This can help you decide if a fixed-rate or an ARM might be better.
I truly believe that understanding these pieces – the current rates, what they mean, and why they’re moving – empowers you to make a confident decision. Don't just look at the headlines; dig a little deeper, and you’ll be in a much better position.
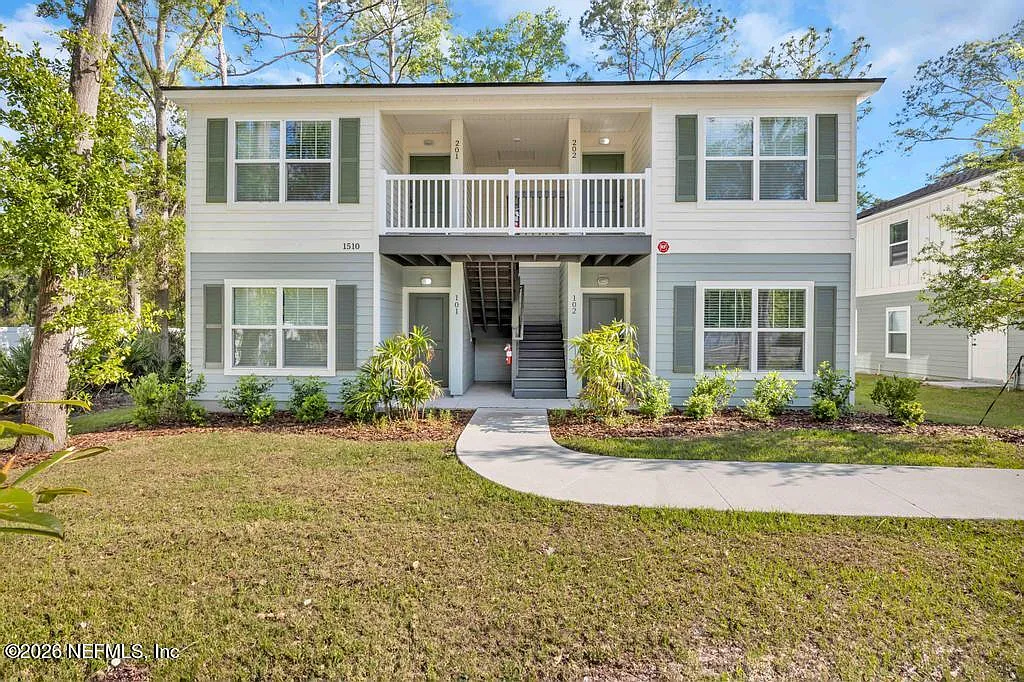
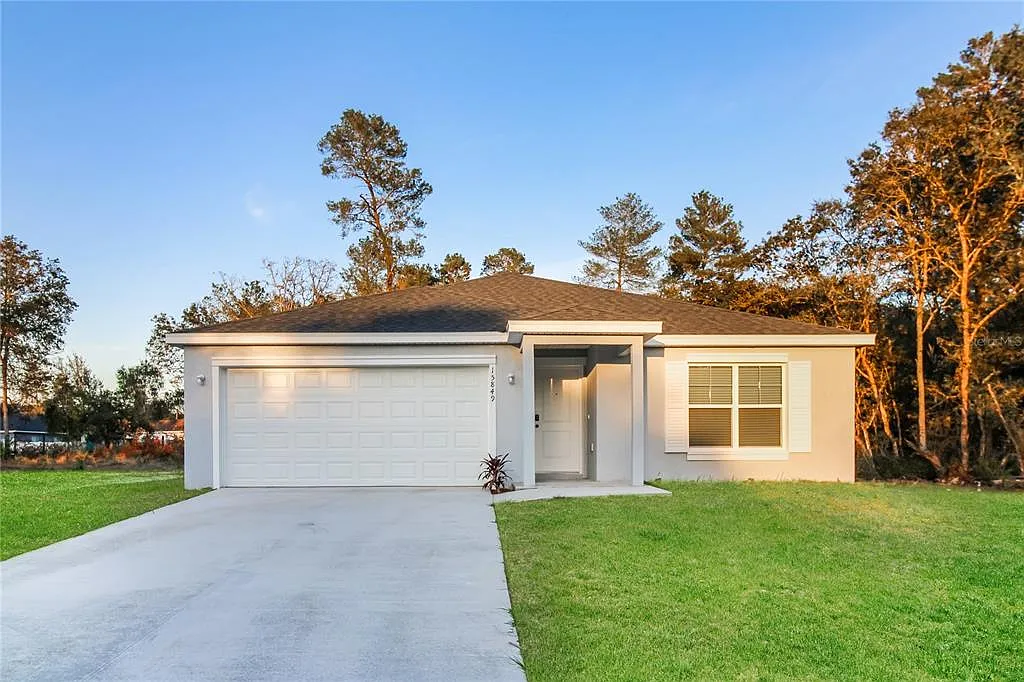
VS
Out‑of‑State investors can compare Tennessee’s newer rental with higher NOI vs Florida’s A+ property with strong yield. Which fits YOUR investment strategy?
We have much more inventory available than what you see on our website – Let us know about your requirement.
📈 Choose Your Winner & Contact Us Today!
Speak to a Norada Investment Counselor (No Obligation):
(800) 611-3060
Mortgage rates remain high in 2026, but rental properties continue to deliver strong cash flow and appreciation. Savvy investors know that turnkey real estate is the path to passive income and long‑term wealth.
Norada Real Estate helps you secure turnkey rental properties designed for immediate cash flow and appreciation—so you can invest smartly regardless of interest rate trends.
Also Read:
- Mortgage Rates Predictions Backed by 7 Leading Experts: 2025–2026
- Mortgage Rate Predictions for the Next 3 Years: 2026, 2027, 2028
- 30-Year Fixed Mortgage Rate Forecast for the Next 5 Years
- 15-Year Fixed Mortgage Rate Predictions for Next 5 Years: 2025-2029
- Will Mortgage Rates Ever Be 3% Again in the Future?
- Mortgage Rates Predictions for Next 2 Years
- Mortgage Rate Predictions for Next 5 Years
- Mortgage Rate Predictions: Why 2% and 3% Rates are Out of Reach
- How Lower Mortgage Rates Can Save You Thousands?
- How to Get a Low Mortgage Interest Rate?
- Will Mortgage Rates Ever Be 4% Again?