Thinking about buying or selling a home in Southern California? You're not alone! The current Southern California housing market is showing signs of life, with sales picking up in June and prices holding steady, and this trend is likely to continue, with a hopeful outlook for 2026.
It's been a rollercoaster ride for our housing market, hasn't it? Just when you think you've got a handle on things, the numbers shift. I've been watching this market for years, and I've seen it all. Right now, it feels like things are starting to find a more comfortable rhythm. We saw a nice bump in home sales in June, which is great news for folks looking to move. And while prices aren't soaring like they once were, they're not dropping either. This stability is a good sign.
Southern California Housing Market: What's Happening Now?
What the Numbers Are Telling Us (June 2026)
Let's break down what we're seeing in Southern California based on the latest report from the California Association of Realtors. It's like looking at a puzzle where the pieces are finally starting to fit together.
- More Homes are Selling: In June, the number of existing, single-family homes sold across California went up. This is a big deal because it means more people are actually buying houses. For Southern California specifically, sales jumped by a healthy 10.8% compared to the year before. That's a strong showing!
- Prices Are Staying Put (Mostly): While the statewide median home price saw a small dip from May to June, it stayed above the $900,000 mark. For our own backyard, Southern California’s median home price saw a slight increase of 2.3% year-over-year, reaching about $880,000 in June 2025 and holding steady around that figure. This tells me that even though things aren't going crazy, home values are still respected.
- Inventory is Tight: One of the biggest challenges we've faced is not having enough homes for sale. This is still the case, with fewer homes on the market than last year. This lack of supply helps keep prices from falling too much.
A Closer Look at the Counties
Southern California isn't just one big blob; it's made up of several unique counties, each with its own story.
| County | Median Home Price (June 2026 Estimate) | Year-over-Year Sales Change | Year-over-Year Price Change |
|---|---|---|---|
| Imperial | ~$435,000 | +69.8% | +8.7% |
| Los Angeles | ~$910,000 | +6.8% | +0.7% |
| Orange | ~$1,490,000 | +12.2% | +1.4% |
| Riverside | ~$635,000 | +7.1% | 0.0% |
| San Bernardino | ~$508,000 | +13.1% | +5.3% |
| San Diego | ~$1,085,000 | +16.1% | +5.9% |
| Ventura | ~$937,500 | +19.4% | -3.8% |
My Take:
- Imperial County is on fire! That massive sales jump suggests buyers are finding great deals there. It's becoming a more attractive option for those looking for more affordability.
- Los Angeles and Orange Counties are still the giants. Prices are stable, and sales are steady, which is what you'd expect in these highly sought-after areas.
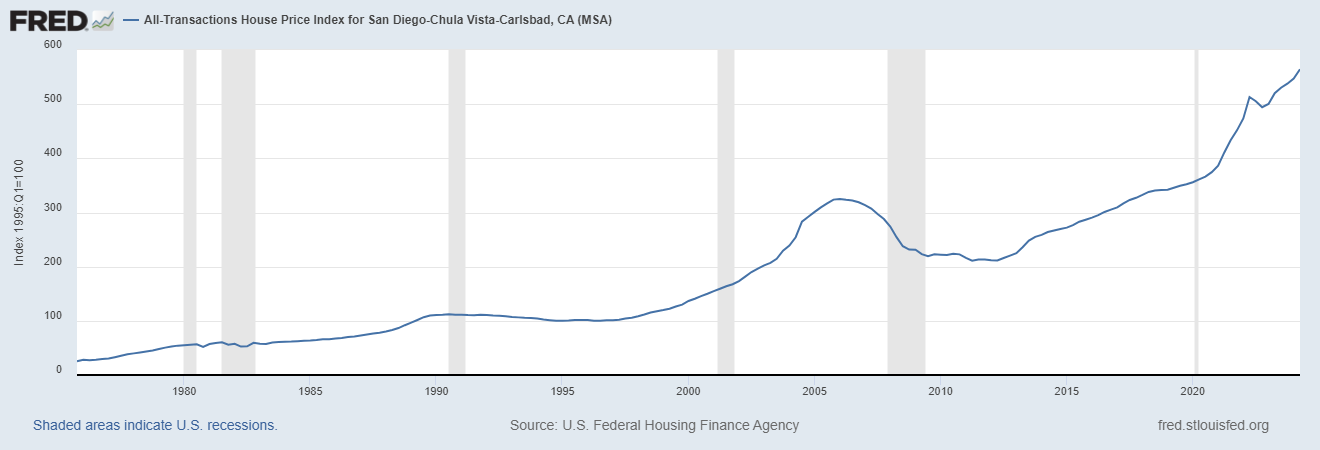
- San Diego is showing great strength with solid sales and price growth. It remains a prime location.
- Riverside and San Bernardino are offering more affordability and seeing good sales activity, which is pulling in buyers.
- Ventura County is a bit of an outlier with a price dip, but its sales are booming. This could mean some great opportunities for buyers right now!
Why Are Things Picking Up?
It's not just random chance. Several things are contributing to this more positive market feeling:
- Buyers are Adjusting: People are getting used to the current mortgage rates. They're not waiting for them to drop dramatically anymore. They're making offers and moving forward.
- Inventory is Slowly Improving: While still low, there are a few more homes trickling onto the market. This gives buyers more choices.
- Demand is Still Strong: Southern California is a desirable place to live, and that underlying demand never really goes away.
Looking Ahead: The 2026 Forecast
So, what does all this mean for the future, especially by 2026? Based on what I'm seeing and hearing from experts, I'm optimistic.
Here's my prediction:
- Sales will likely continue to grow, but at a steadier pace. We might not see those huge jumps every month, but the trend should be upward. More homes becoming available will help with this.
- Home prices will likely continue to appreciate, but not at the sky-high rates of the past. Think of it as a healthy, sustainable growth. We could see prices rise by around 2-4% annually in many areas, with some hot spots doing even better.
- Mortgage rates are still a big question mark. Global events can influence them, but generally, they might hover in a similar range or see slight fluctuations. The key is that buyers are learning to live with them.
- Inventory will remain a key factor. If more homeowners decide to sell, it could ease some of the price pressure. But for now, expect it to stay relatively tight.
My opinion: The days of bidding wars on every single house might be behind us for a while. Buyers will have a bit more breathing room to make thoughtful decisions. However, for sellers, if your home is well-priced and well-presented, it should still attract strong interest.
What I'm watching for:
- Interest Rate Stability: If rates remain predictable, it will give buyers more confidence.
- Economic Health: A strong job market and economy are always good for real estate.
- New Construction: While not a huge factor in the immediate short term for existing homes, new developments can impact overall supply in the long run.
The Southern California housing market is dynamic. It’s a place where dreams of homeownership are pursued by many. While it's always wise to be prepared for changes, the current trends suggest a market that is maturing, offering opportunities for both buyers and sellers who are informed and strategic.
In 2026, select U.S. cities are projected to see surging demand, rising rents, and appreciation—creating prime opportunities for investors seeking passive income and long‑term wealth.
Work with Norada Real Estate to find stable, cash-flowing markets beyond the bubble zones—so you can build wealth without the risks of ultra-competitive areas.
Recommended Read: