If you're dreaming of owning a home but worried about sky-high prices, you're not alone. The good news? Homeownership is still within reach, especially if you set your sights on the right states. Based on current trends and projections, the 20 cheapest states to buy a house in 2026 will largely be concentrated in the South and Midwest, with median home prices ranging from approximately $228,000 to $338,000. Now, let's dive into where your homeownership dreams can become a reality without breaking the bank.
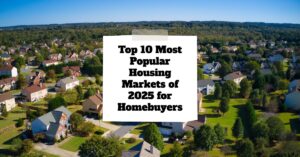
20 Cheapest States to Buy a House in 2026
Real estate is all about timing. Looking ahead to 2026 gives us a bit of a buffer to observe current trends, factor in potential economic shifts, and make more informed decisions. While predicting the future is impossible, analyzing existing data allows us to get a reasonable glimpse into which states are likely to remain affordable havens for homebuyers. We're building on the expectation that current affordability challenges in some regions may ease, while others will remain consistently accessible.
1. Iowa: Heartland Charm and Wallet-Friendly Living
Key Takeaway: Iowa offers the absolute lowest projected median home price of $228,000, combining a peaceful Midwest lifestyle with a surprisingly robust economy.
- The Vibe: Iowa is the picture of classic small-town America, with friendly communities and a slower pace of life. Think friendly waves from neighbors and community festivals.
- Economic Strength: Don't let the quiet fool you! Iowa has solid job growth in sectors like biosciences, advanced manufacturing, and information technology.
- Affordable Living: The low housing costs mean your money goes further, allowing for comfortable living and maybe even that dream home with a big backyard.
2. Ohio: Great Lakes Value and Diverse Opportunities
Key Takeaway: With a projected median home price of $241,000, Ohio provides a compelling mix of affordability and evolving economic opportunities across its diverse cities.
- City Life & Nature: From the artsy vibe of Cleveland to the growing tech scene in Columbus, Ohio offers urban amenities. Plus, access to Lake Erie and beautiful state parks is a huge plus!
- Industry and Innovation: While known for its manufacturing history, Ohio is actively growing in areas like healthcare and technology.
- Family Friendly: Many families find Ohio to be an ideal place for raising children, thanks to affordable housing and good educational options.
3. Oklahoma: The Sooner State's Surprising Real Estate Value
Key Takeaway: Oklahoma's projected median home price of $244,000 makes it a fantastic option for those seeking affordability and a booming economy that's diversifying rapidly.
- Economic Boom: The state's economy is strong, with significant growth in energy, aerospace, and technology. Cities like Oklahoma City and Tulsa are seeing exciting development.
- Down-to-Earth Culture: You'll find a genuine, down-to-earth atmosphere here, where hard work is valued, and community ties are strong.
- More House for Your Money: This is a place where your budget can stretch significantly, allowing you to afford a more spacious home or a prime location.
4. West Virginia: Majestic Scenery Meets Unbeatable Prices
Key Takeaway: At a projected $249,000 median home price, West Virginia is a haven for nature lovers and those looking for an incredibly low entry cost into homeownership.
- Natural Wonderland: Famous for its Appalachian Mountains, West Virginia offers breathtaking views, endless hiking, and a peaceful escape.
- Resilient Spirit: Despite its economic challenges, the state has a strong sense of community and resilience.
- Unmatched Affordability: If you dream of owning a large property or a cozy cabin with incredible natural surroundings, West Virginia is hard to beat for sheer value.
5. Michigan: Great Lakes Living at Great Prices
Key Takeaway: Also with a projected $249,000 median home price, Michigan offers access to stunning Great Lakes coastlines and a diverse economy that provides excellent value.
- Coastal Access: Imagine living near the pristine waters of the Great Lakes! Michigan offers beautiful beaches, vibrant cities like Detroit and Grand Rapids, and charming lakeside towns.
- Diverse Economy: From automotive and manufacturing to a growing tech sector, Michigan has a wide range of job opportunities.
- Community Focused: Many areas in Michigan boast a strong sense of community, making it a great place to put down roots.
6. Louisiana: Culture, Cuisine, and Incredible Deals
Key Takeaway: Expect a median home price around $249,000 in Louisiana, a state that offers a unique blend of rich culture, delicious food, and surprisingly affordable housing.
- Cultural Hotspot: Beyond the famous sounds and tastes of New Orleans, Louisiana is steeped in history and offers a vibrant, distinctive way of life.
- Economic Variety: Key industries include energy, agriculture, and tourism, offering diverse employment opportunities.
- Warm Welcome: The people here are known for their warmth and hospitality, making it easy to feel at home.
7. Mississippi: Southern Hospitality and Deep Value
Key Takeaway: With a projected median home price of $253,000, Mississippi delivers on the promise of Southern charm and some of the most budget-friendly homeownership options in the country.
- Relaxed Pace: Mississippi offers a slower, more relaxed pace of life, perfect for those seeking tranquility.
- Rich History & Culture: The state is deeply connected to its history and offers a unique cultural experience.
- Budget-Savvy: It's a place where your money truly stretches, allowing for comfortable living and significant savings on housing.
8. Arkansas: The Natural State's Big Appeal
Key Takeaway: Arkansas, at a projected $253,000 median home price, is a fantastic choice for outdoor lovers who want a spacious home in a naturally beautiful setting.
- Outdoor Paradise: Dubbed “The Natural State,” it boasts mountains, rivers, and forests, making it ideal for hiking, fishing, and exploration.
- Growing Cities: Little Rock and other hubs are experiencing growth with diverse economic sectors.
- Value for Your Dollar: You can often find larger homes or properties with acreage for a fraction of the cost in other states.
9. Indiana: Midwest Value, Modern Life
Key Takeaway: Indiana offers a highly attractive housing market with a projected median price of $255,000, especially in its capital, Indianapolis.
- Economic Hub: Indianapolis is a major center for manufacturing, logistics, and a growing tech scene.
- Family-Focused: With good schools and affordable housing, Indiana is often cited as a great place to raise a family.
- Accessible Urban Living: You get access to city amenities without the overwhelming price tag.
10. Missouri: A Blend of Midwestern Practicality and Southern Charm
Key Takeaway: With a projected median home price of $258,000, Missouri offers a balanced lifestyle, affordability, and diverse opportunities, bridging Midwest and Southern vibes.
- Diverse Geography: From the Ozarks to the Mississippi River, Missouri offers beautiful landscapes and recreational activities.
- Strong Cities: Kansas City and St. Louis provide ample job opportunities in healthcare, manufacturing, and tech.
- Balanced Living: It’s a sweet spot offering access to urban centers and more rural tranquility at affordable prices.
11. Kentucky: Bourbon, Bluegrass, and Budget-Friendly Homes
Key Takeaway: Kentucky’s projected median home price of $263,000 puts it in a prime spot for those seeking beautiful scenery and a lower cost of living.
- Iconic Appeal: Beyond its famous bourbon and horse farms, Kentucky has a growing manufacturing sector and a strong healthcare industry.
- Scenic Beauty: Rolling hills and picturesque countryside are abundant, offering a peaceful environment.
- Accessible Homeownership: It’s a place where you can own a charming home without facing steep prices.
12. Kansas: Wide-Open Spaces, Open Wallets
Key Takeaway: Kansas, projected at $279,000 median home price, offers a stable housing market and a practical, down-to-earth lifestyle perfect for budget-conscious buyers.
- Economic Stability: While agricultural roots remain strong, Kansas also has thriving sectors in aerospace and technology.
- Community Feel: Many Kansas towns offer a strong sense of community and that classic Midwestern friendliness.
- Value Proposition: You get a lot of home for your money in a state known for its straightforward approach.
13. North Dakota: Economic Resilience and Affordable Housing
Key Takeaway: With a projected median home price of $281,000, North Dakota offers economic resilience, particularly in its energy and tech sectors, with accessible housing.
- Growing Economy: Strong in energy, agriculture, and a developing tech scene, offering good job prospects.
- Four Seasons: Enjoy distinct seasons, from warm summers to snowy winters, with plenty of outdoor activities year-round.
- Practical Living: It’s a state that values hard work and offers a practical, no-frills approach to life and housing.
14. Alabama: Affordable Living with Low Ownership Costs
Key Takeaway: Alabama, projected at $281,000 median home price, is a standout for its low property taxes, significantly reducing the overall cost of homeownership.
- Lowest Property Taxes: This is a huge advantage, making the total cost of owning a home here very competitive.
- Diverse Industries: Alabama is growing in aerospace, automotive, and healthcare, creating job opportunities.
- Southern Lifestyle: Enjoy warm weather, a rich history, and a welcoming culture along the Gulf Coast and inland.
15. Pennsylvania: Historic Charm and Modern Value
Key Takeaway: Pennsylvania, with a projected $283,000 median home price, offers a rich history and diverse economy, making homeownership accessible across its many regions.
- Historical Significance: From Philadelphia to Pittsburgh, you're surrounded by history and culture, with access to major economic centers.
- Broad Economy: Strong in healthcare, finance, manufacturing, and technology provides diverse job options.
- Variety of Living: Whether you prefer bustling city life or quiet countryside, Pennsylvania offers options that are still surprisingly affordable.
16. Illinois: Value Beyond the Big City Lights
Key Takeaway: Projected at $286,000 median home price, Illinois offers substantial affordability outside of its famous capital, with a strong agricultural and manufacturing base.
- Economic Diversity: Beyond Chicago, Illinois thrives on agriculture, manufacturing, and a growing tech sector.
- Midwest Friendliness: Experience friendly communities and a practical way of life.
- Stretching Your Budget: Look outside major metro areas for excellent home values and reasonable living costs.
17. Nebraska: Stable Market, Friendly Faces
Key Takeaway: Nebraska's projected $289,000 median home price signifies a stable, affordable housing market in a state known for its strong work ethic and community spirit.
- Economic Steadiness: Growing in insurance, finance, and healthcare, especially in Omaha and Lincoln.
- Community Roots: Nebraska offers a down-to-earth lifestyle and a sense of belonging in its towns and cities.
- Reliable Investment: It’s a dependable state for those seeking to buy a home without extreme price fluctuations.
18. Wisconsin: Lakeside Living and Smart Spending
Key Takeaway: With a projected median home price of $311,000, Wisconsin balances beautiful natural attractions with a strong economy, offering great value for homeowners.
- Lakes Galore: Over 15,000 lakes make it a paradise for outdoor enthusiasts, offering both scenic beauty and recreation.
- Robust Economy: Key sectors include manufacturing, healthcare, and agriculture, providing solid job opportunities.
- Quality of Life: Wisconsin offers a high quality of life with friendly communities and accessible amenities.
19. South Dakota: Wide-Open Spaces, Accessible Prices
Key Takeaway: South Dakota, at a projected $320,000 median home price, is ideal for those seeking vast landscapes and a tranquil lifestyle with a still-affordable housing market.
- Natural Beauty: Enjoy expansive skies, rolling terrain, and a peaceful, unhurried pace of life.
- Growing Industries: Tourism, agriculture, and financial services are key economic drivers.
- Room to Breathe: It's a place where you can find more land and space for your housing dollar.
20. Texas: Dynamic Growth, Diverse Opportunities
Key Takeaway: While its major cities are booming, Texas’s projected $338,000 median home price still places it in our top 20, offering immense economic opportunity across a vast, diverse state.
- Economic Powerhouse: From energy and tech to healthcare and manufacturing, Texas is a job creation engine.
- Variety of Lifestyle: Whether you prefer a bustling metropolis or a quiet rural town, Texas has it all.
- Value in Scale: The sheer size of the state means a wider range of housing prices, with many areas offering excellent value for homebuyers.
VS
Alabama’s newer A‑rated rental vs Indiana’s large 6‑bed property with higher NOI. Which fits YOUR investment strategy?
We have much more inventory available than what you see on our website – Let us know about your requirement.
📈 Choose Your Winner & Contact Us Today!
Speak to a Norada Investment Counselor (No Obligation):
(800) 611-3060

Download Your FREE Guide to Passive Real Estate Wealth
Real estate investing has created more millionaires than any other path—and this guide shows you how to start or scale with turnkey rental properties.
Inside, you’ll learn how to analyze cash flow and returns, choose the best markets, and secure income-generating deals—perfect for building long-term wealth with minimal hassle.
🔥 FREE DOWNLOAD AVAILABLE NOW! 🔥
Want Stronger Returns? Invest Where the Housing Market’s Growing
Turnkey rental properties in fast-growing housing markets offer a powerful way to generate passive income with minimal hassle.
Work with Norada Real Estate to find stable, cash-flowing markets beyond the bubble zones—so you can build wealth without the risks of ultra-competitive areas.
🔥 HOT NEW LISTINGS JUST ADDED! 🔥
Speak to a Norada Investment Counselor today (No Obligation):
(800) 611-3060
Recommended Read:
- Best States to Buy a House in 2026
- Best Cities to Buy a House for Investment in 2026
- Best Cities to Buy a House For Rental Income in 2026
- Best Cities to Invest in Real Estate in 2026
- Should You Invest in the Austin or Raleigh Real Estate Market in 2026?
- Dallas vs. Houston: Which City Offers Better Returns for Real Estate Investors
- Single-Family vs. Townhome: Which is the Real Cash Flow Winner for Investors?
- 5 Hottest Florida and Texas Markets for Real Estate Investors in 2025
- Best Places to Invest in Real Estate: November 2024 Hotspots
- How to Secure Your Retirement With Cash-Flowing Rental Properties
- Best Places to Invest in Single-Family Rental Properties in 2025
- 5 Hottest Real Estate Markets for Buyers & Investors in 2025