![]()

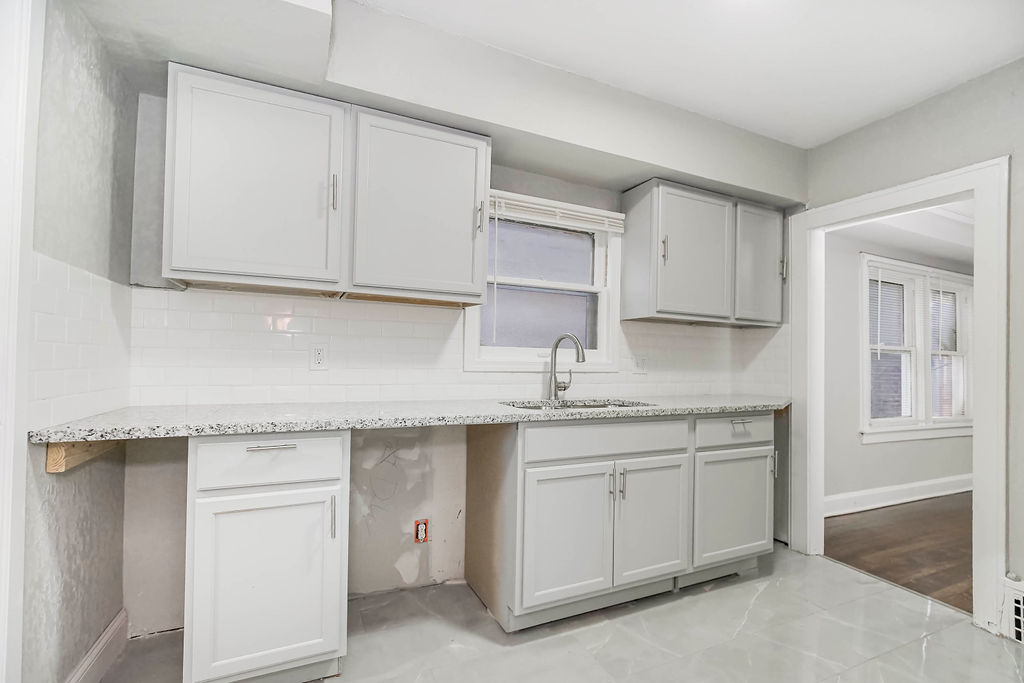
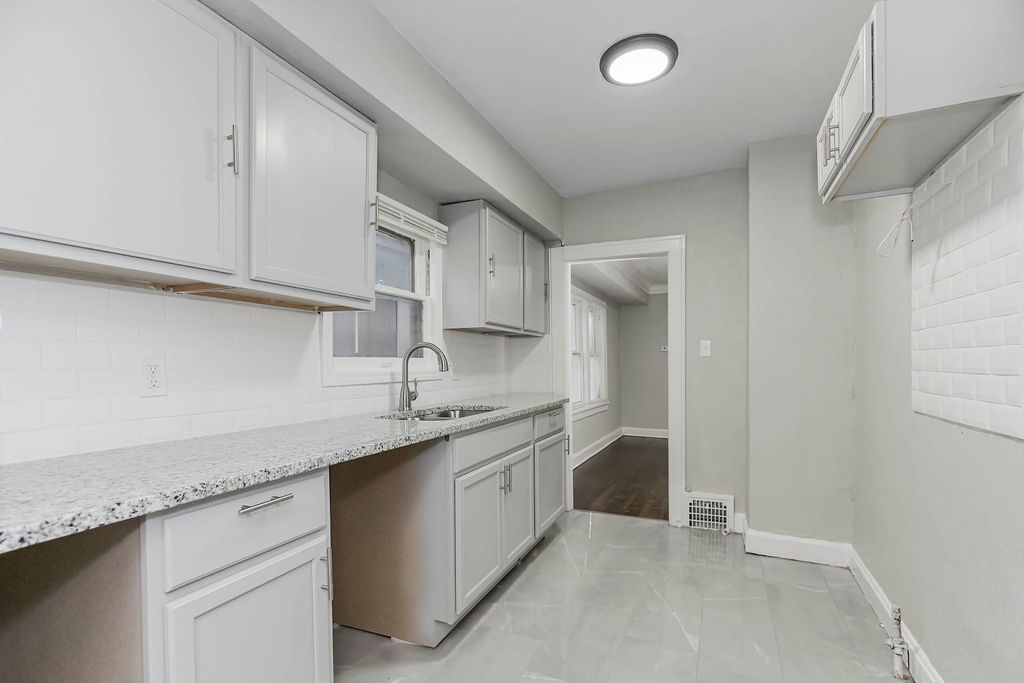
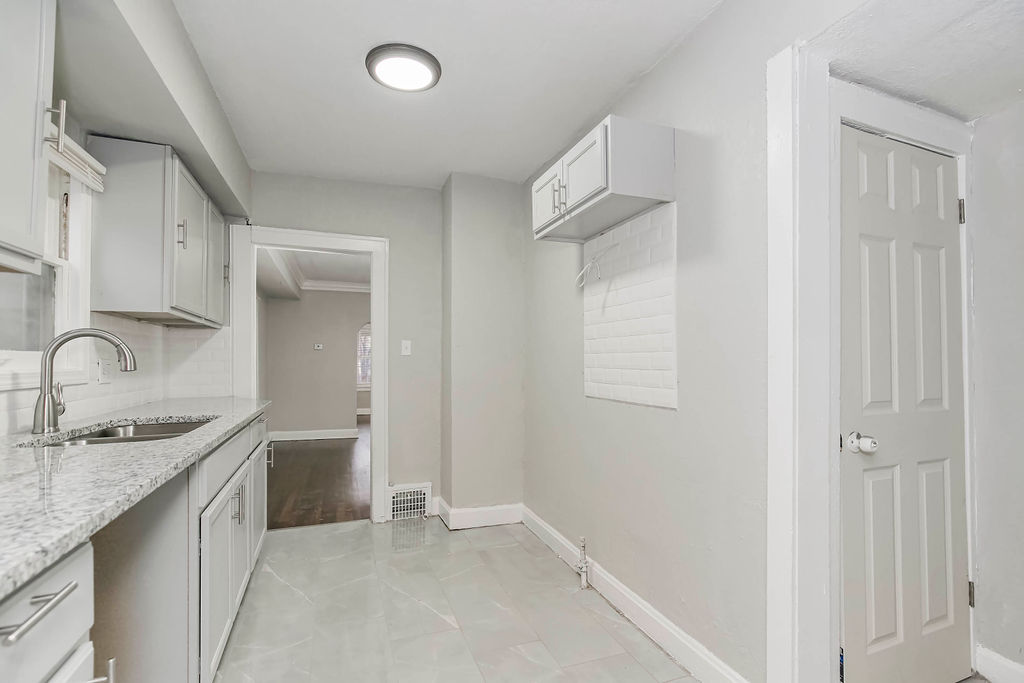
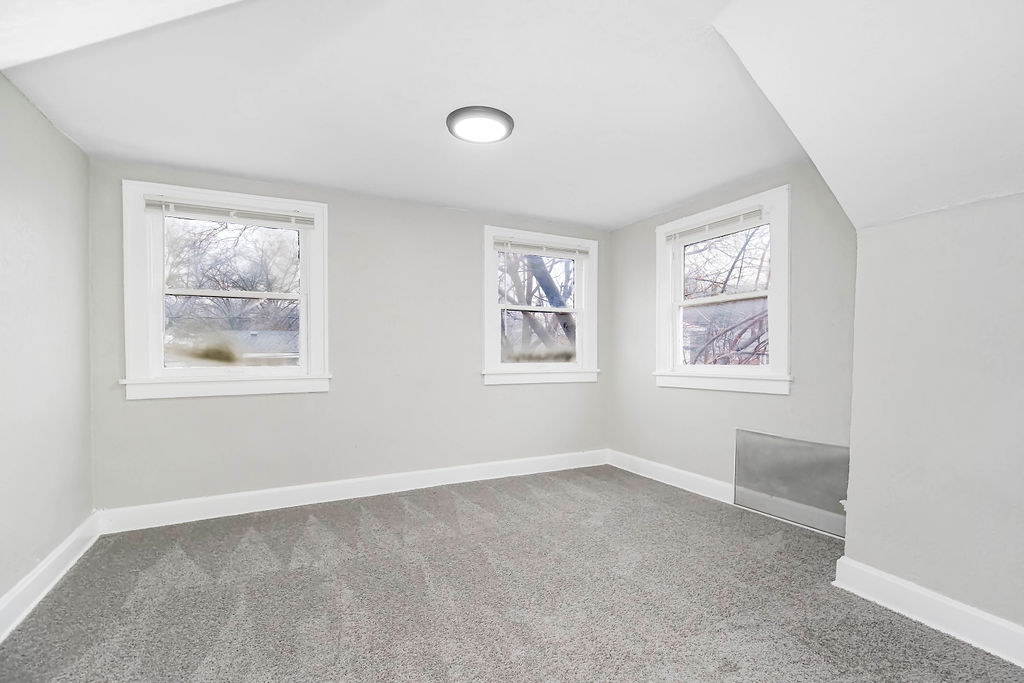
Kansas City Investment Properties For Sale
Turnkey Properties Starting at $85,000
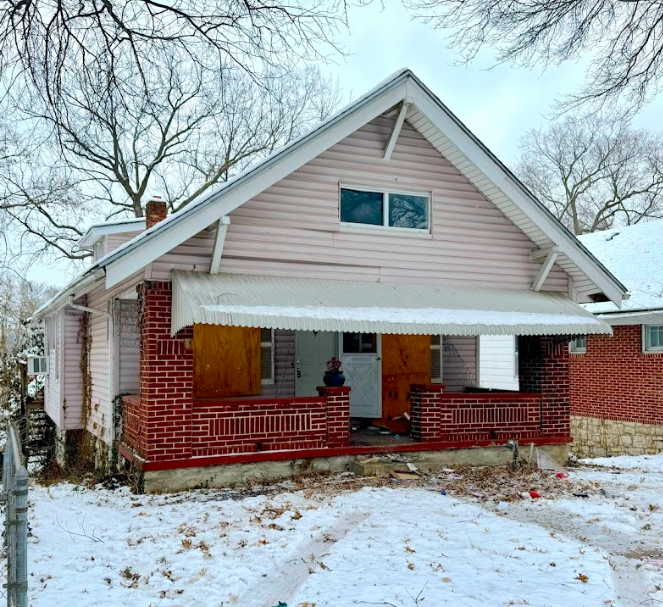
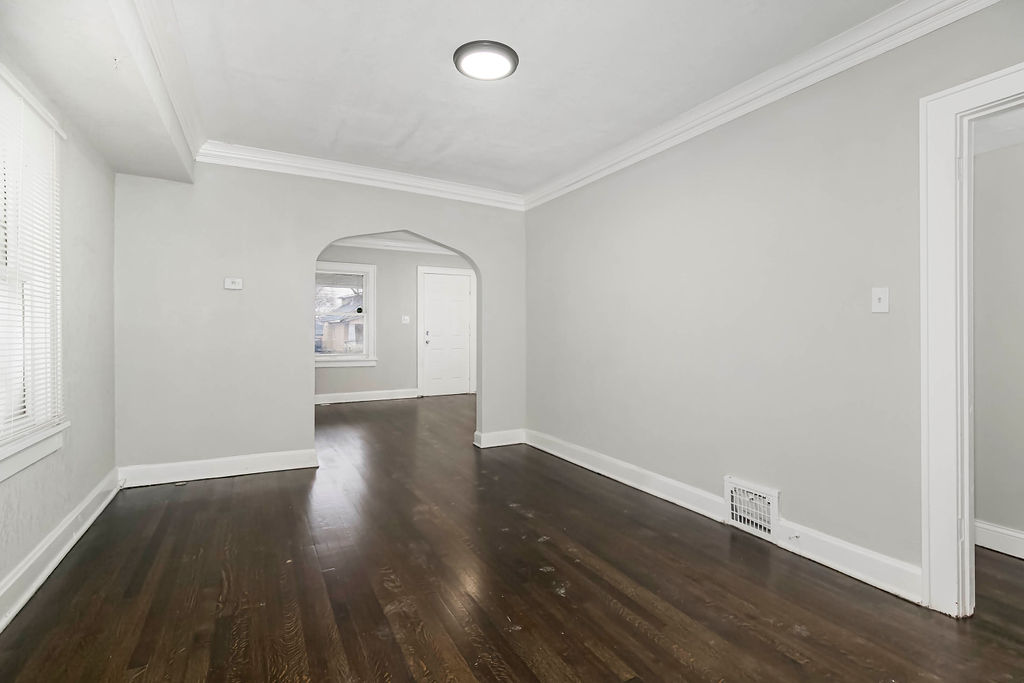
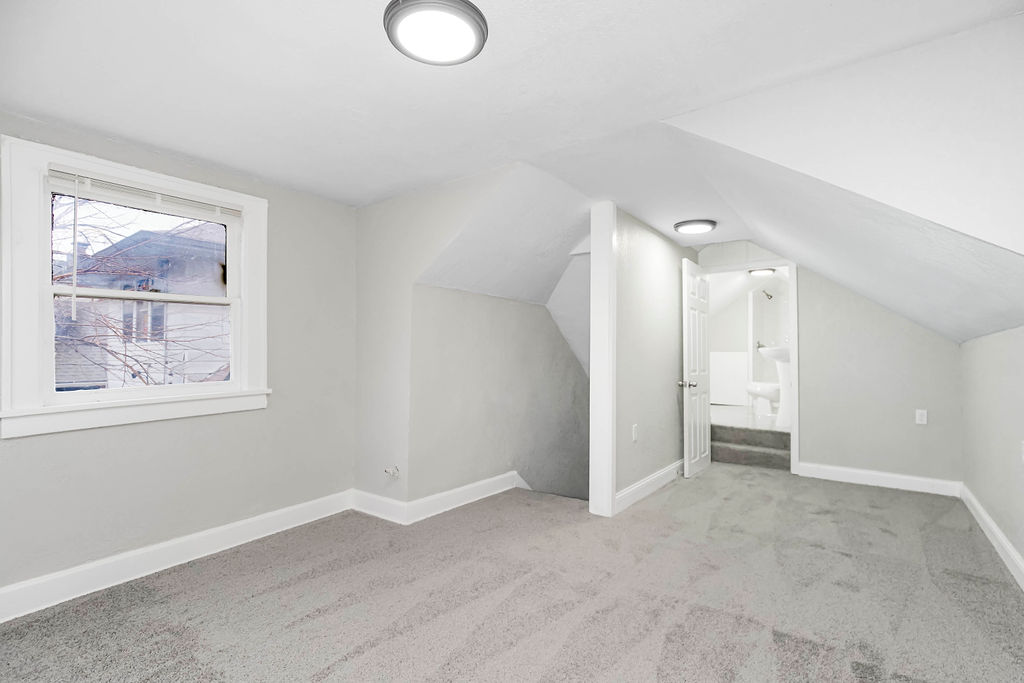
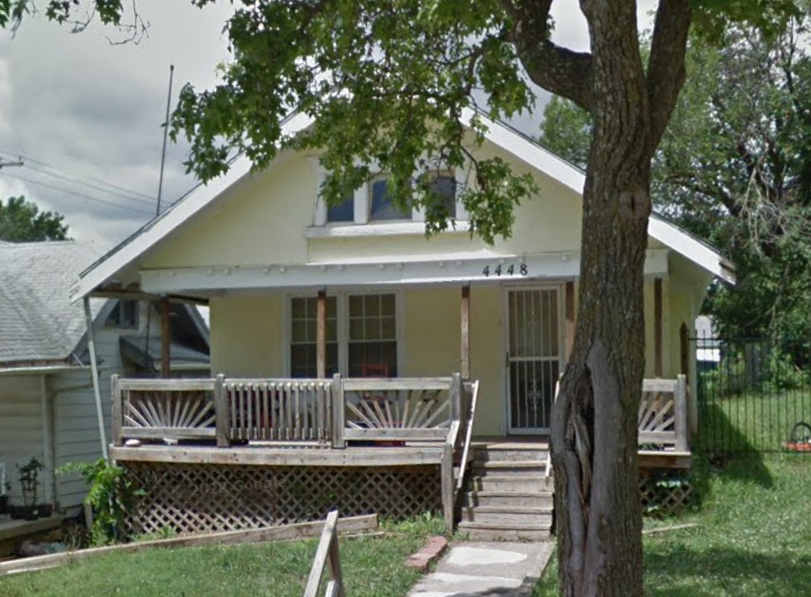
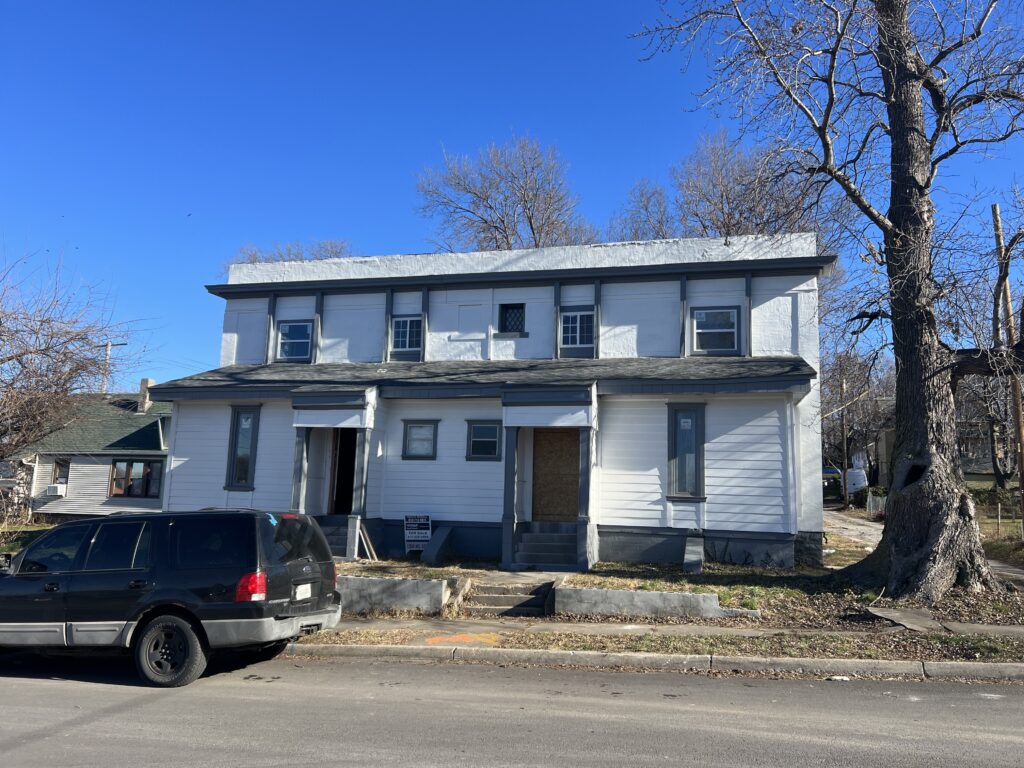
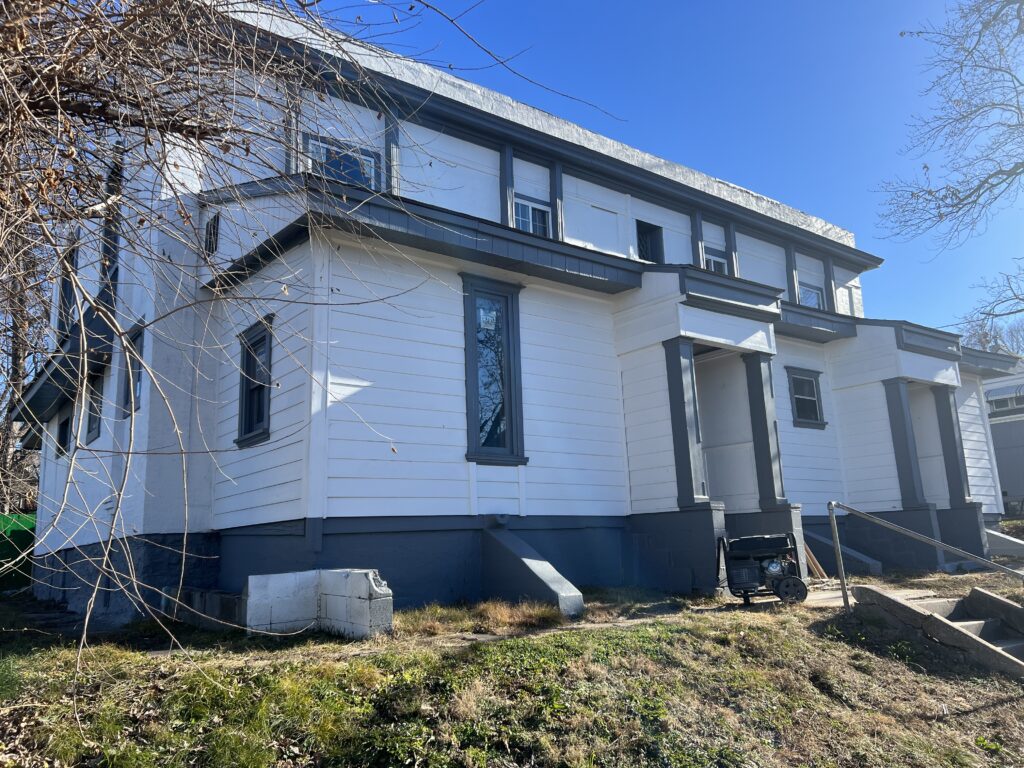
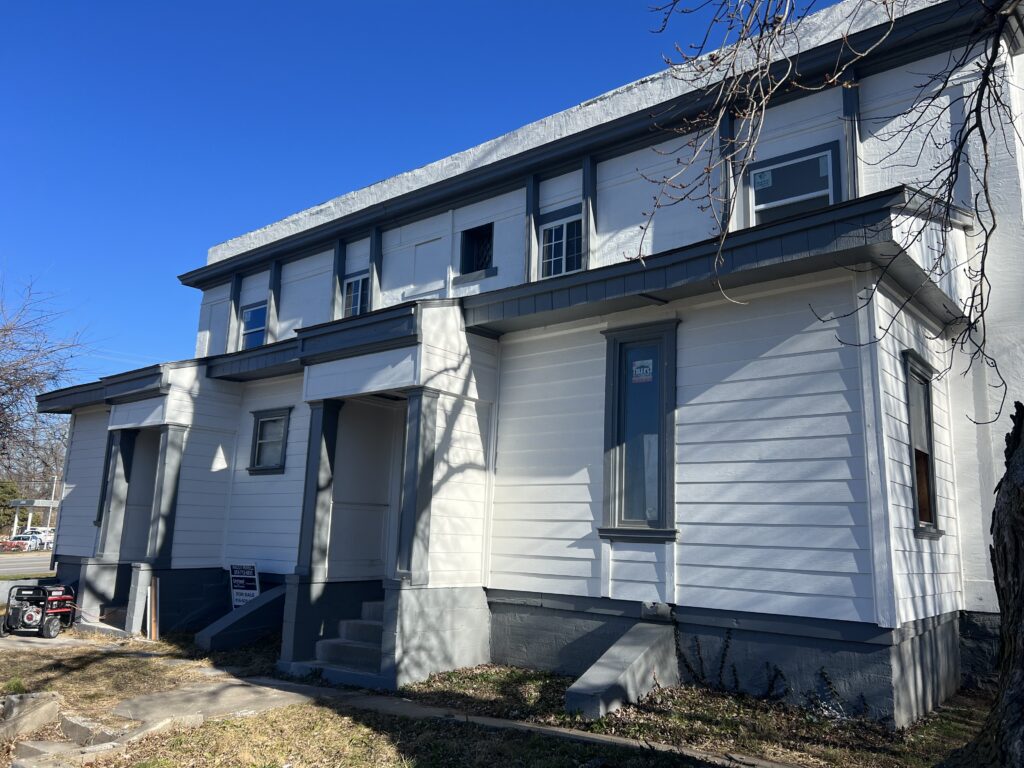
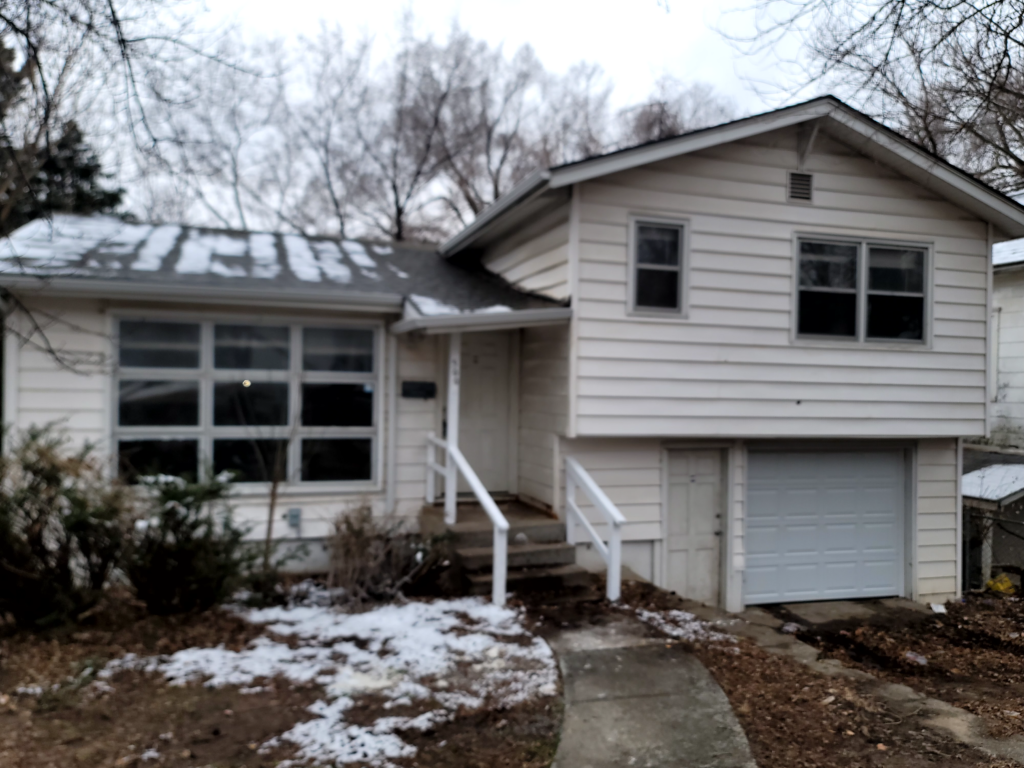
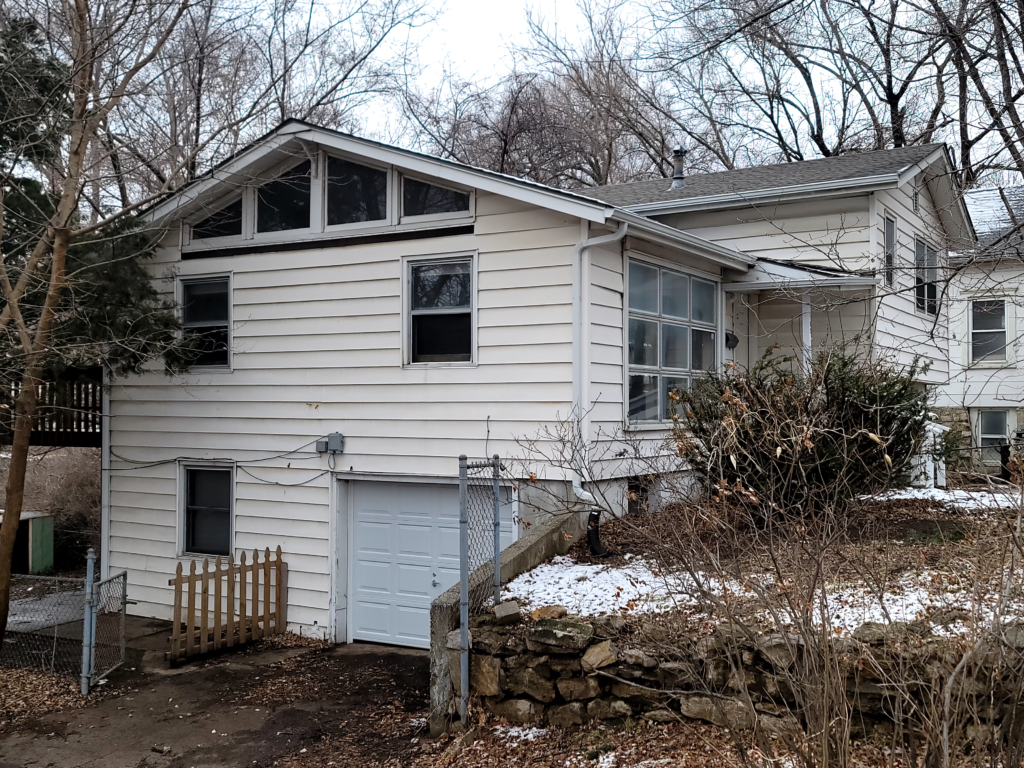
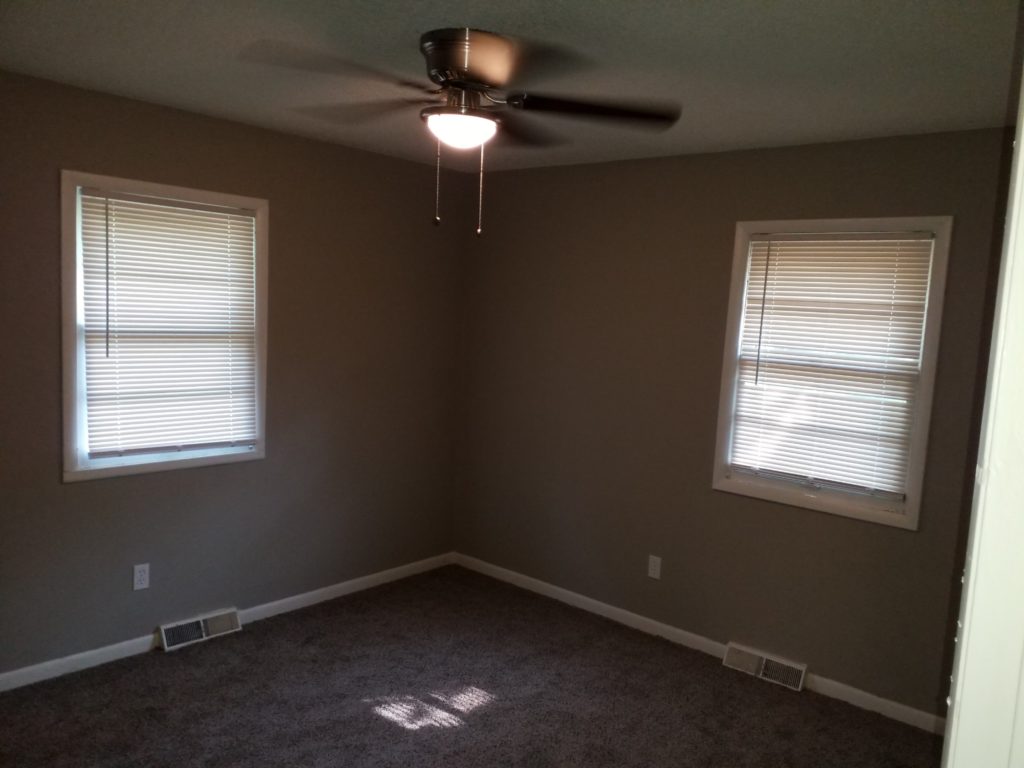
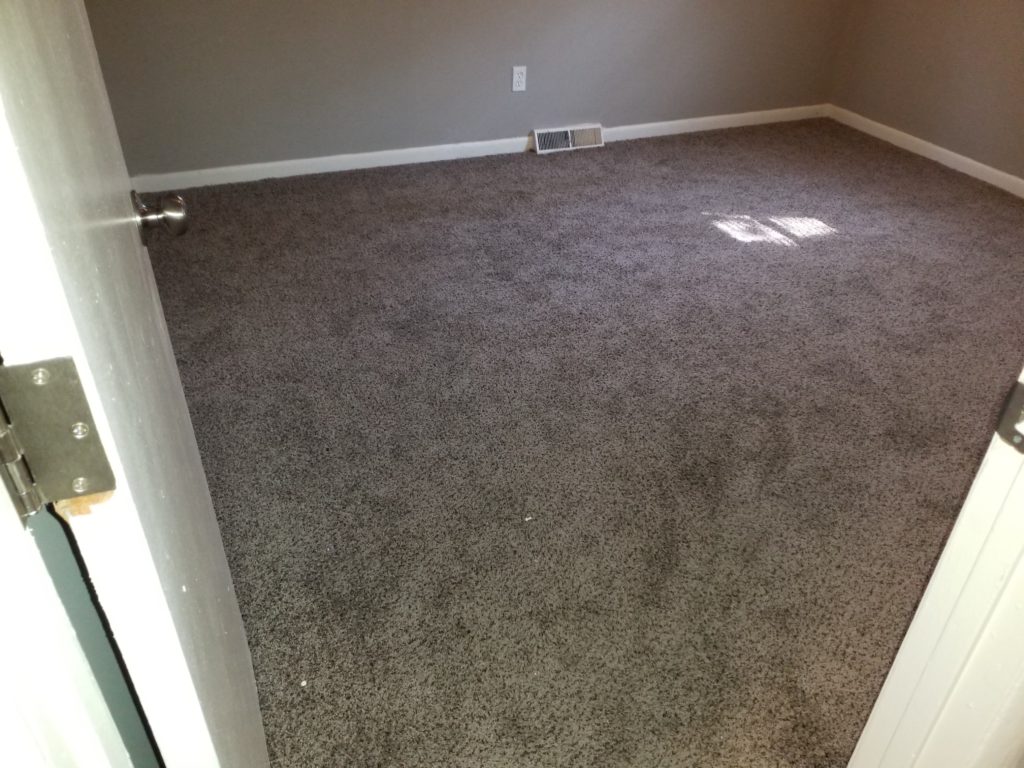
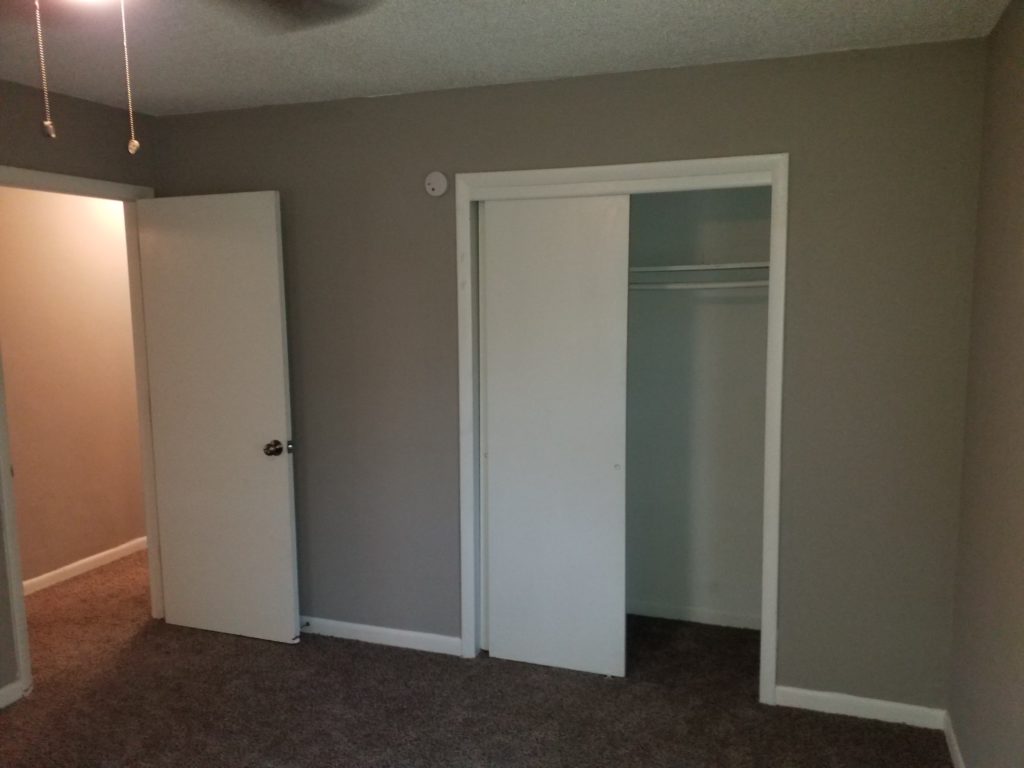
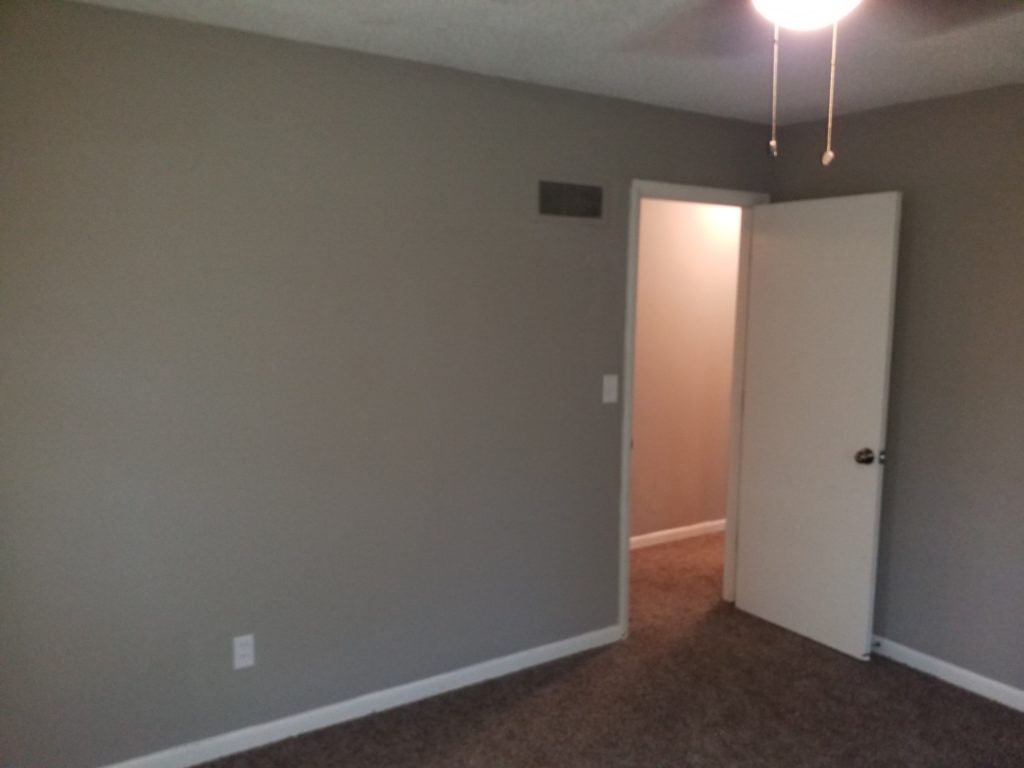
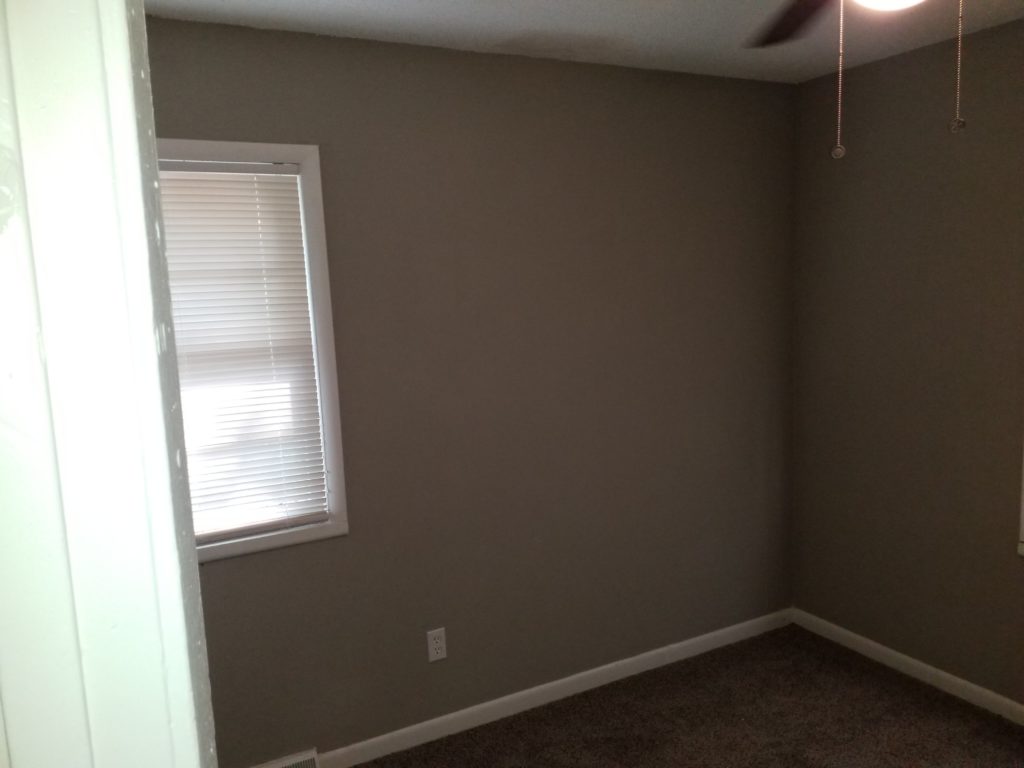
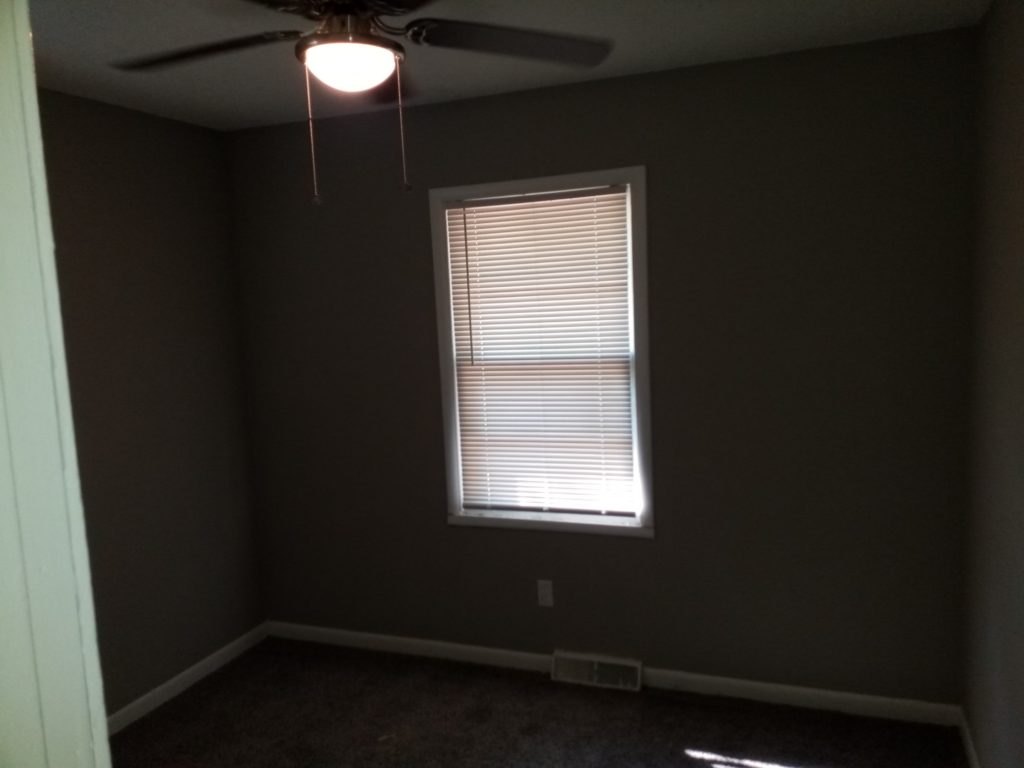
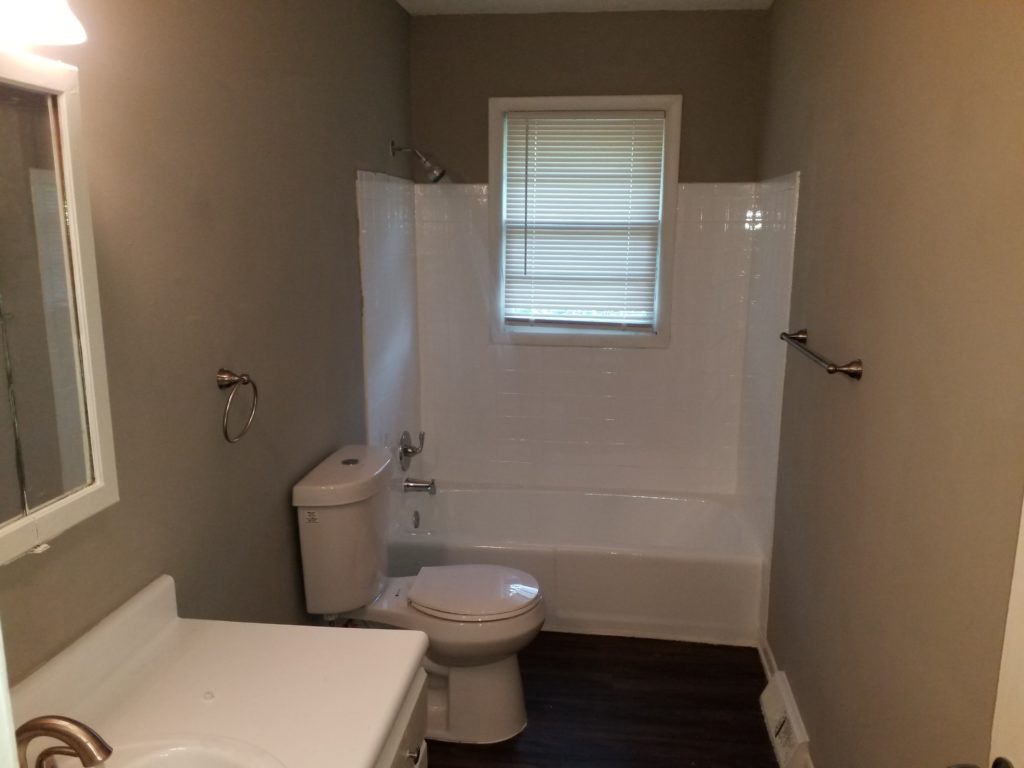
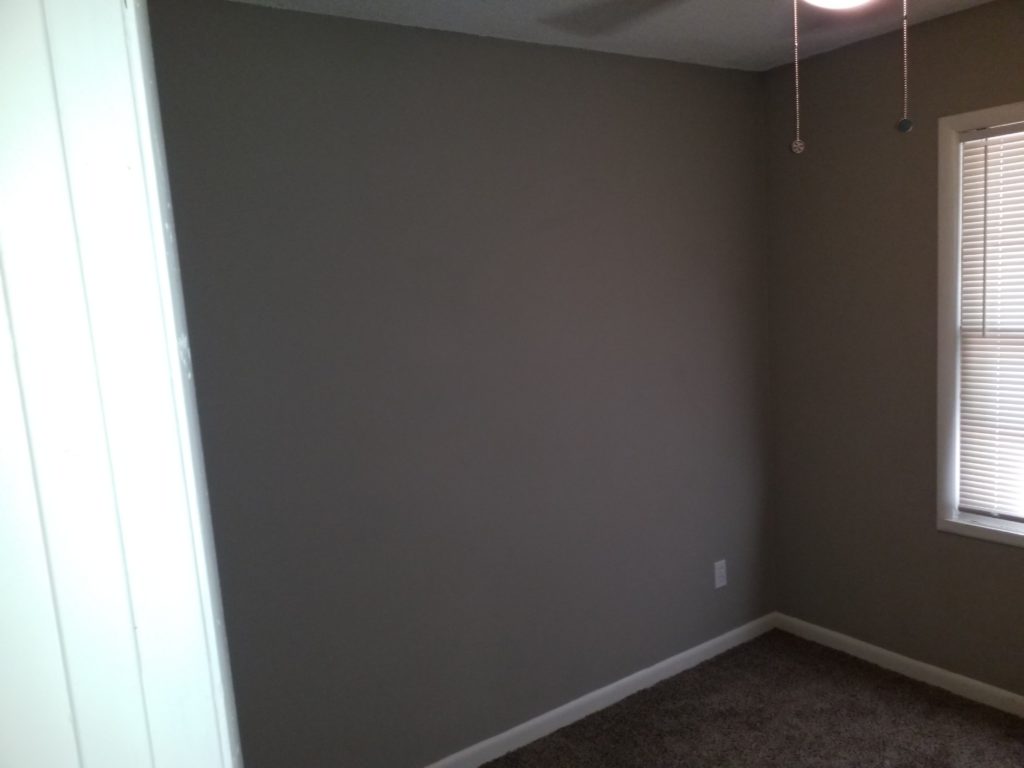
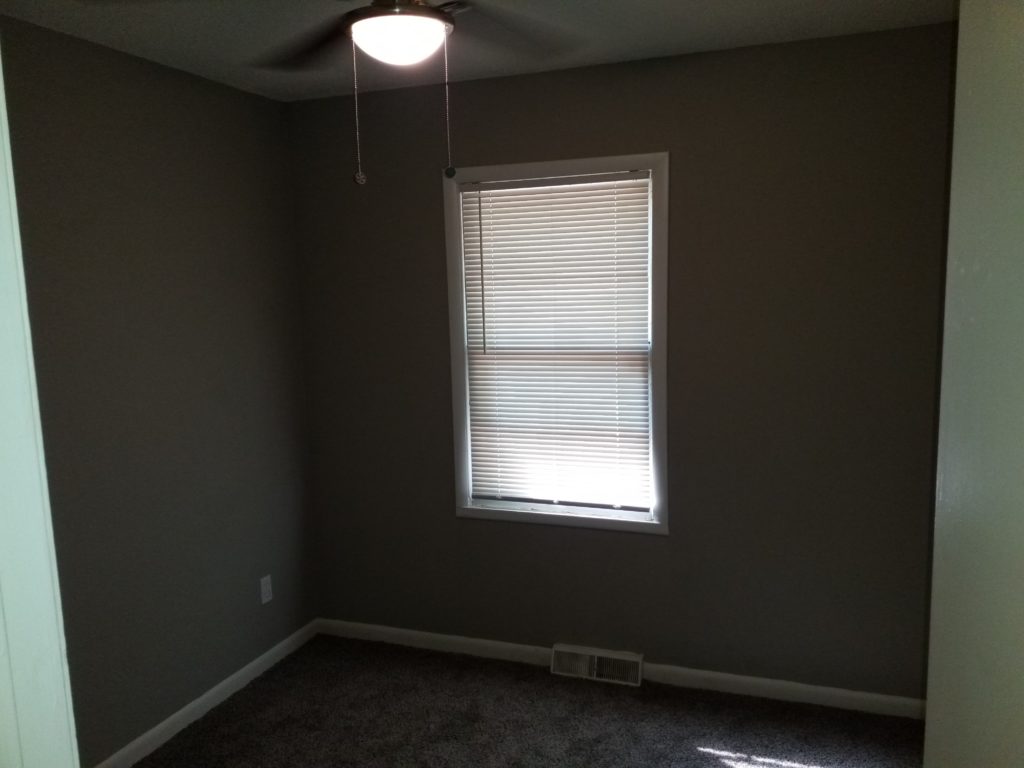
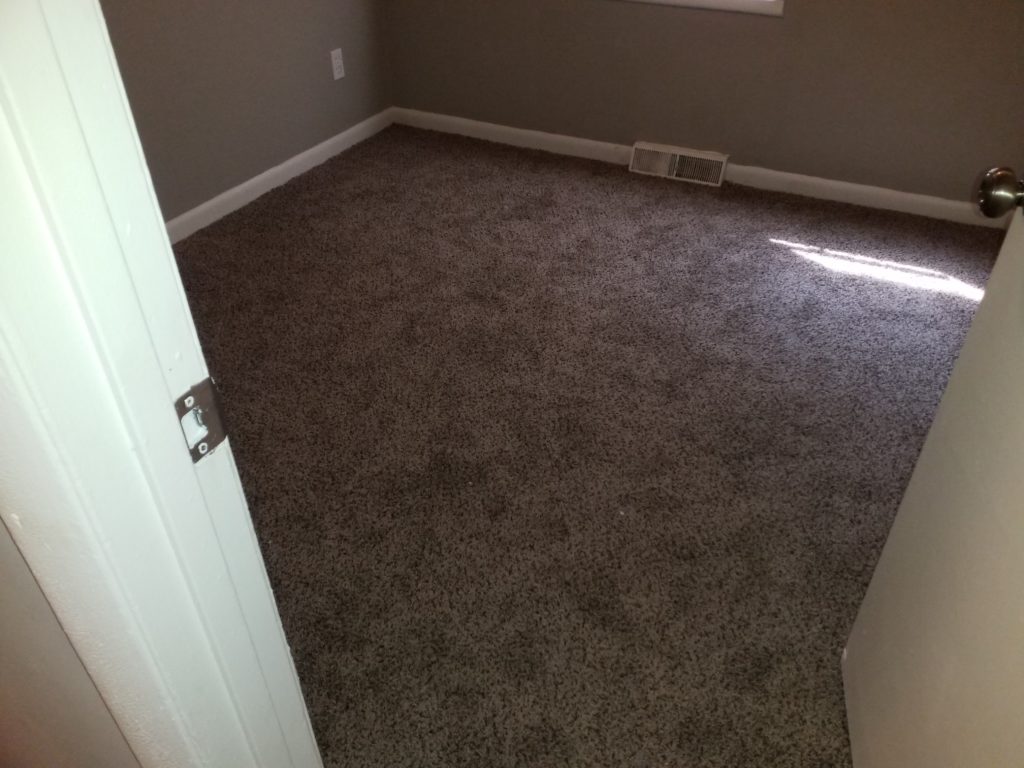
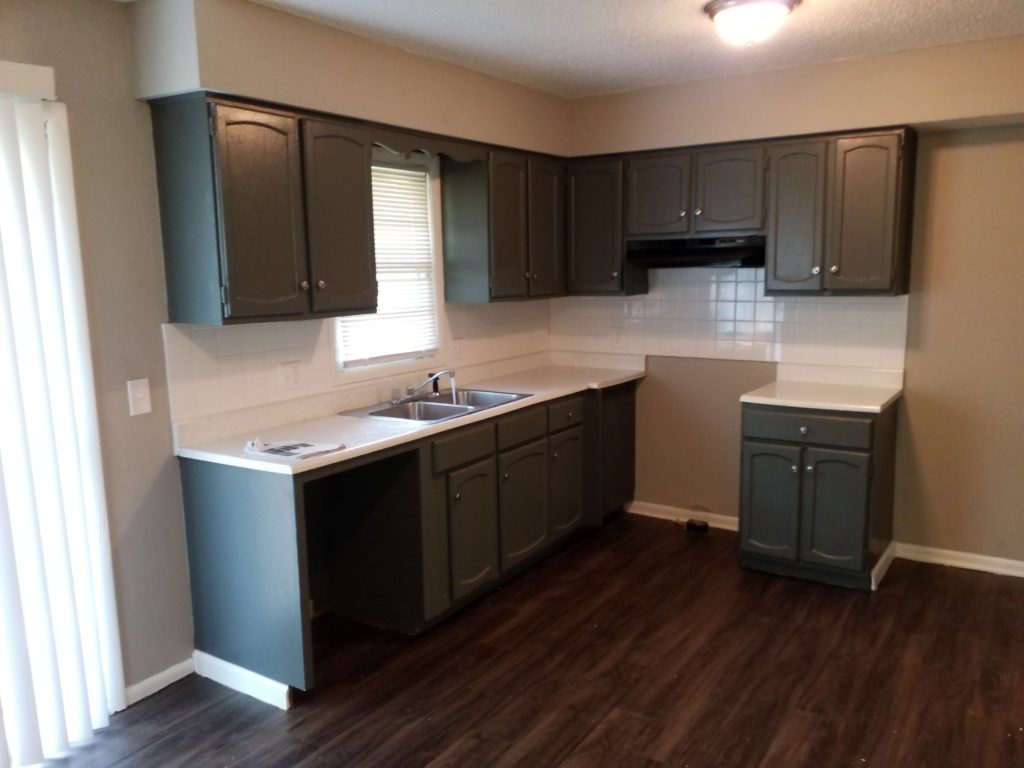
Askew Ave
Kansas City, Missouri
$195,000
$1,750
1925
$89
0.9%
B
9.2%
$1,493
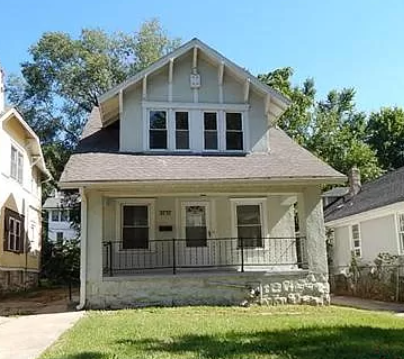
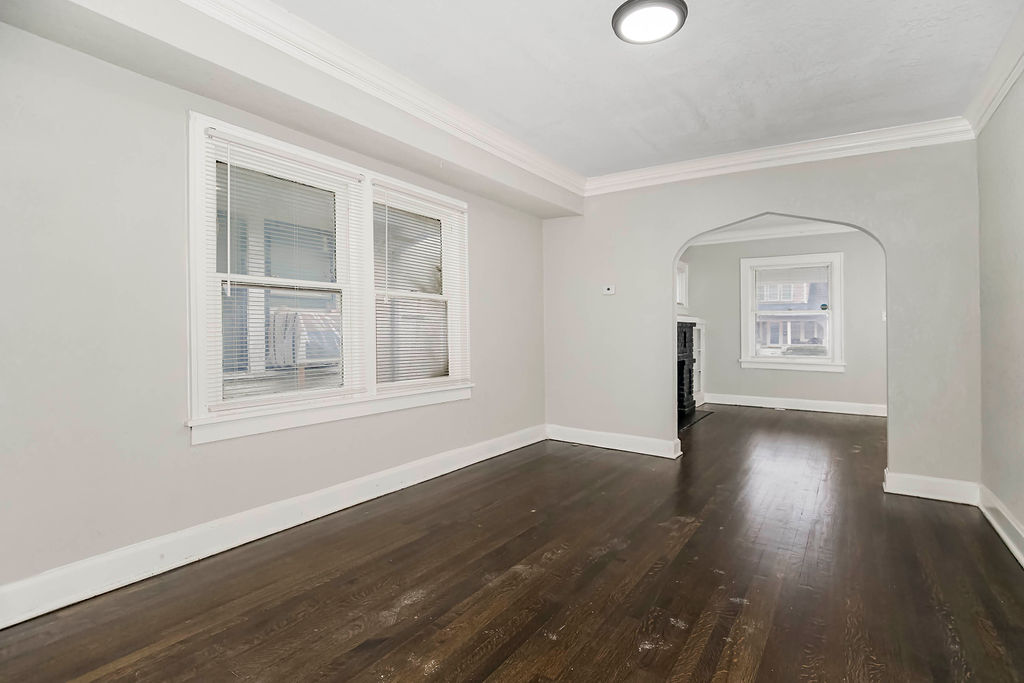
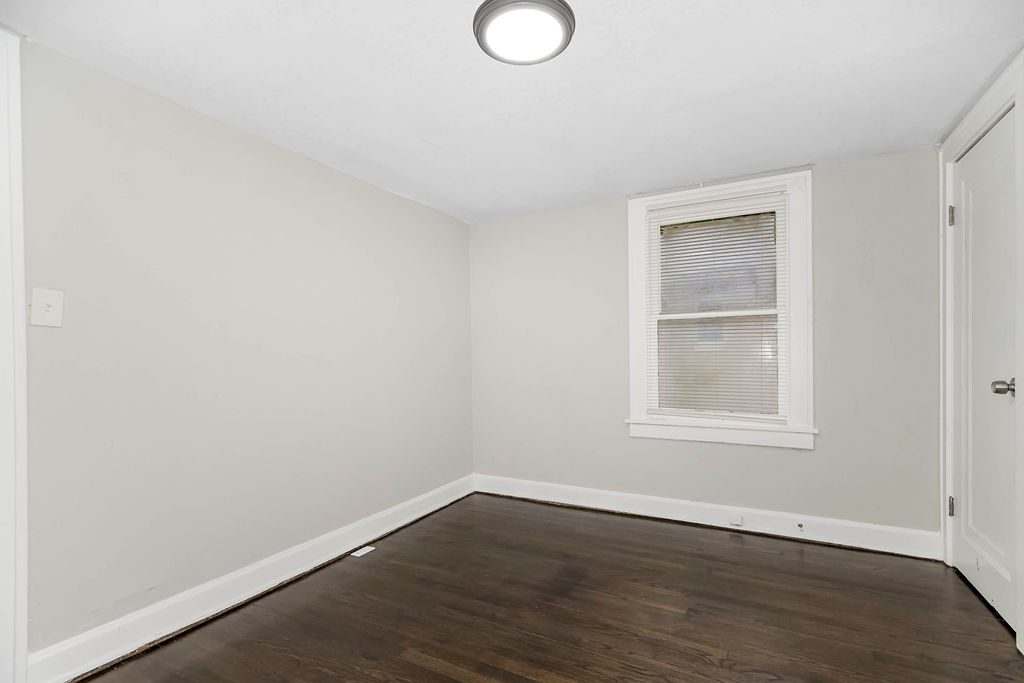
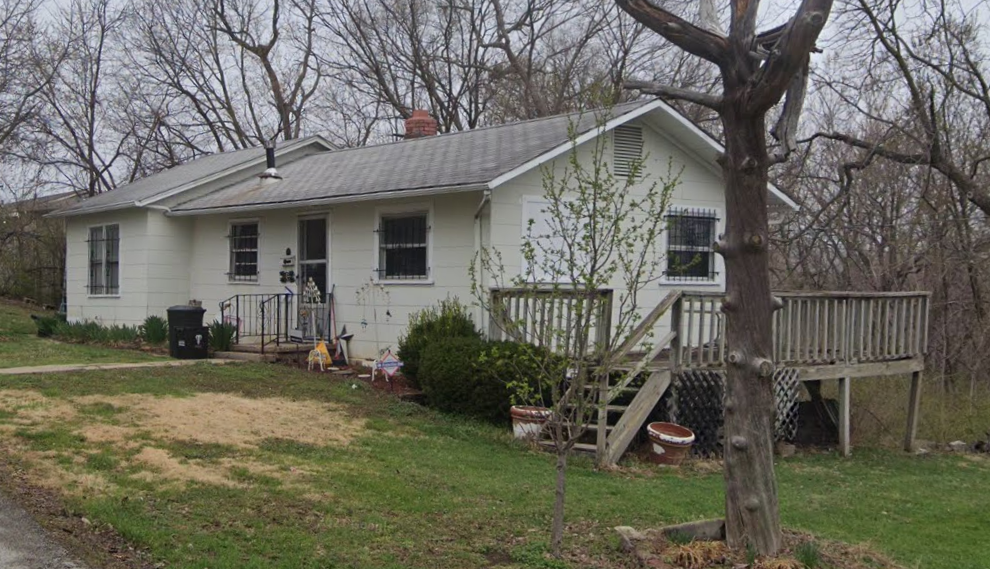
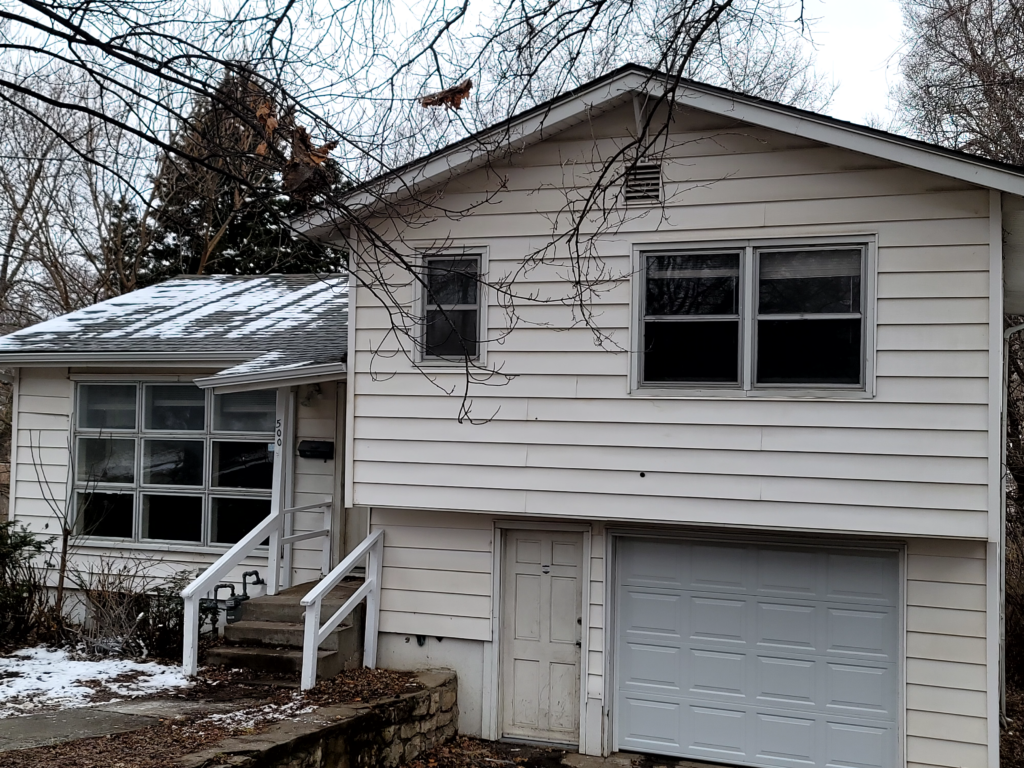
Bellefontaine Ave
Kansas City, Missouri
$185,000
$1,650
1916
$114
0.9%
B
9.1%
$1,396
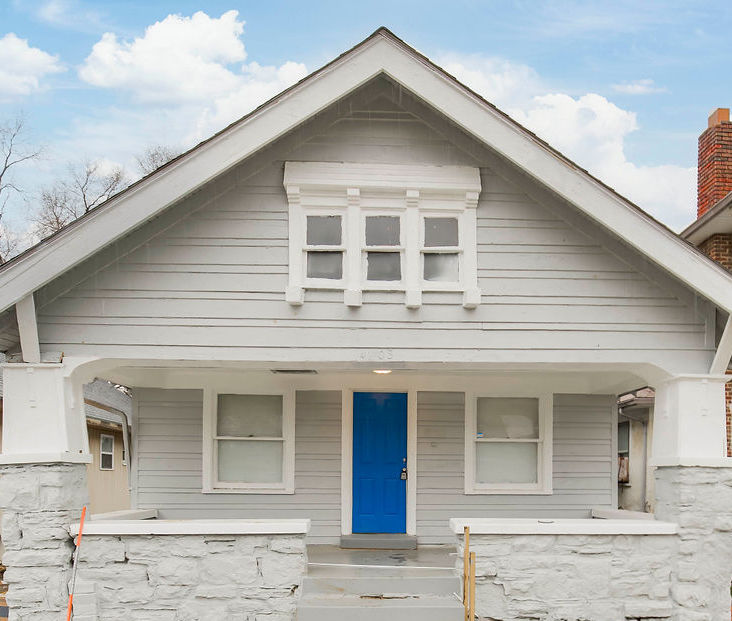

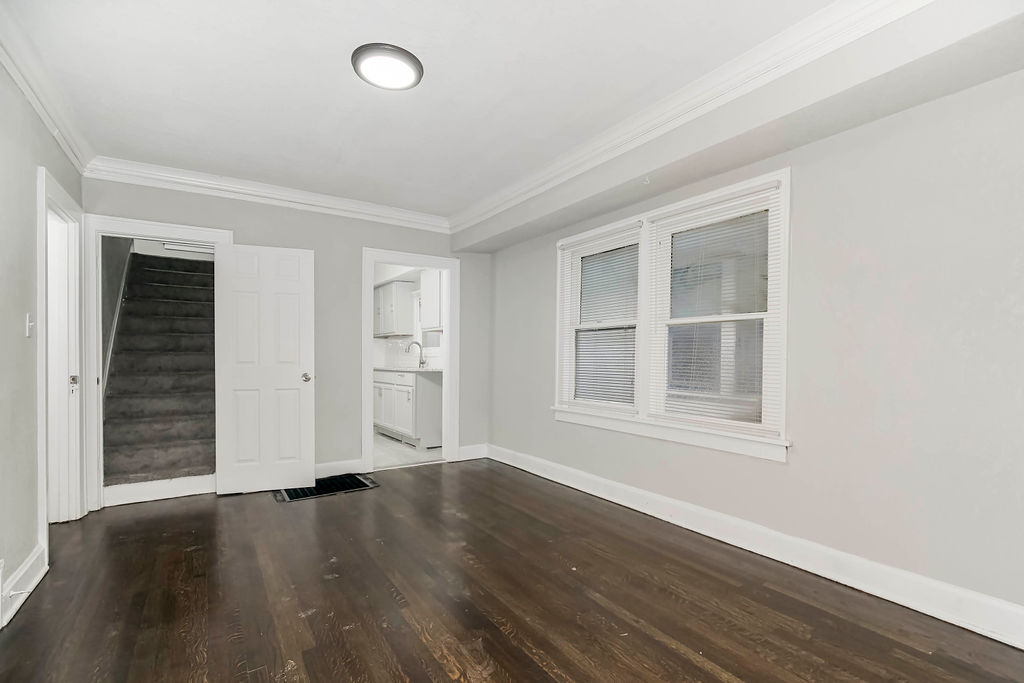


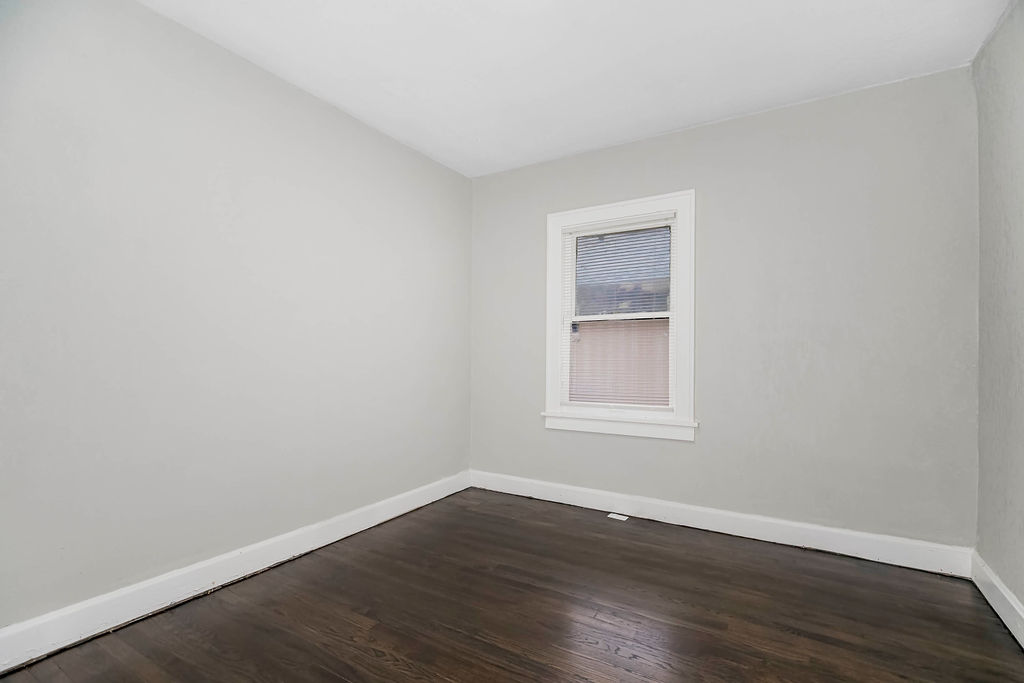
College Ave
Kansas City, Missouri
$189,000
$1,695
1922
$81
0.9%
B+
9.2%
$1,450
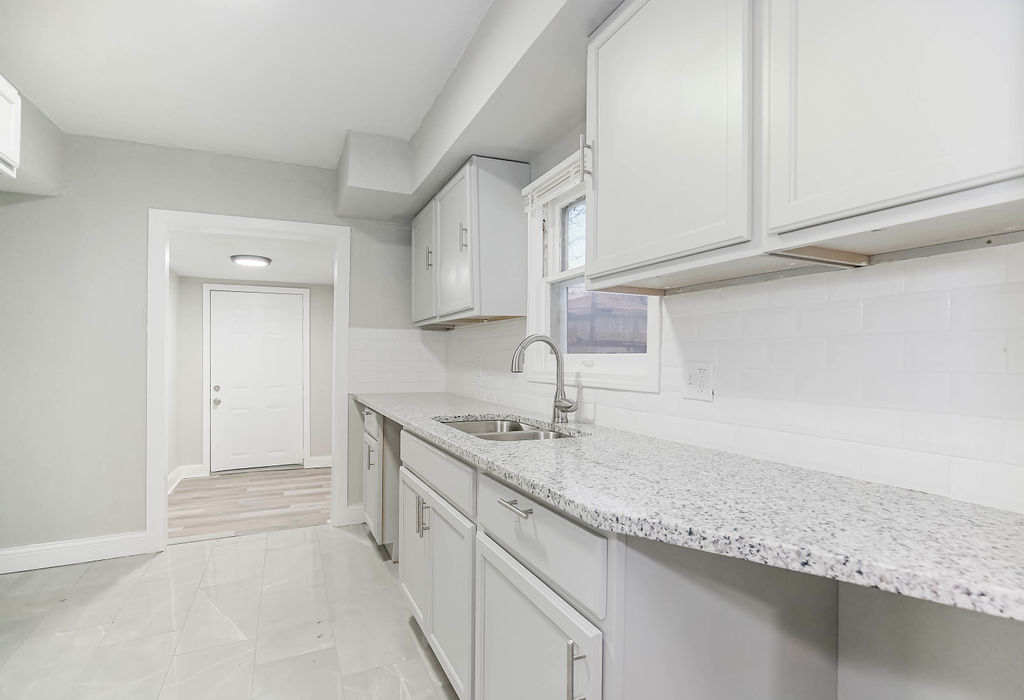
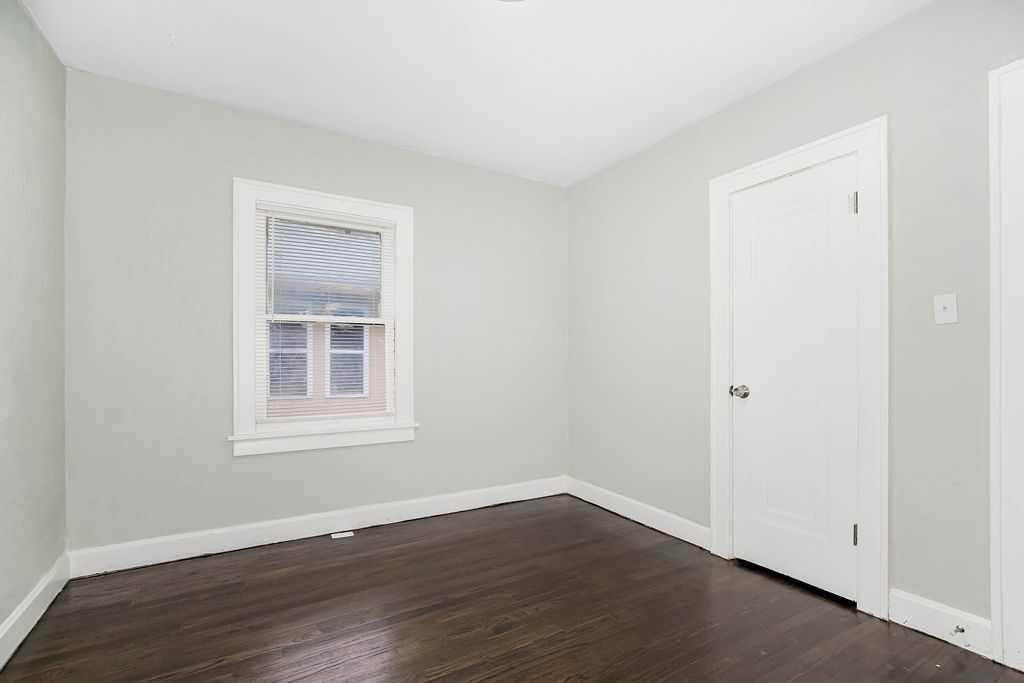
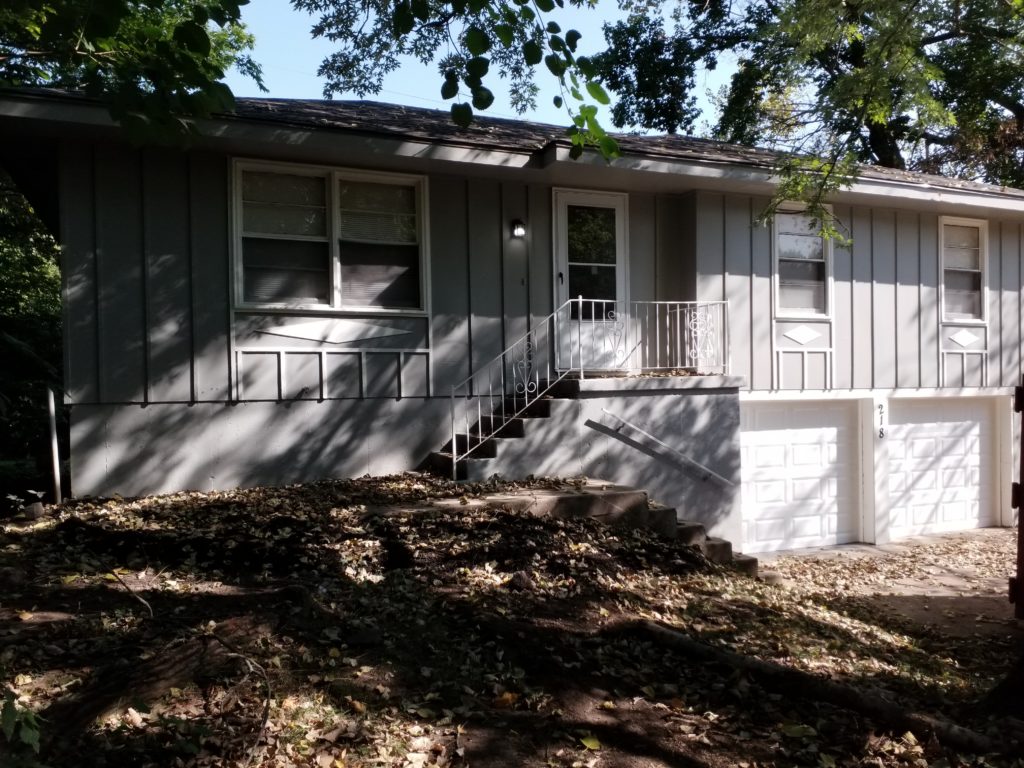
S Benton Ave
Kansas City, Missouri
$185,000
$1,675
1921
$130
0.9%
B+
9.2%
$1,419
Harrison St
Kansas City, Missouri
$250,000
$2,345
1940
$174
0.9%
C-
9.4%
$1,950
Fremont Ave
Kansas City, Missouri
$475,000
$4,600
1910
$156
1.0%
B+
9.9%
$3,915
Euclid Avenue
Kansas City, Missouri
$165,000
$1,525
1920
$128
0.9%
B-
9.0%
$1,236
N. White Avenue
Kansas City, Missouri
$154,500
$1,100
1970
$96
0.7%
B-
6.7%
$866


SW 19th St
Oak Grove, Missouri
$192,000
$1,350
1972
$94
0.7%
A-
6.3%
$1,000
Kansas City is a large city located in the state of Missouri. With a population of 463,202 people and 147 constituent neighborhoods, Kansas City is the largest community in Missouri.
Kansas City is neither predominantly blue-collar nor white-collar, instead having a mixed workforce of both blue-collar and white-collar jobs. Overall, Kansas City is a city of sales and office workers, professionals and service providers. There are especially a lot of people living in Kansas City who work in office and administrative support (16.34%), sales jobs (10.42%) and management occupations (8.83%).
Also of interest is that Kansas City has more people living here who work in computers and math than 95% of the places in the US.
Of the large cities in America, Kansas City is one of the most car-oriented. This is reflected in the urban landscape, which features highways, wide streets, parking lots, and shopping centers of all sizes. It is also reflected in the statistics: 83.05% of people in Kansas City drive to work in their own car everyday, most often alone. So, if you're going to live in Kansas City, you'll need to learn to love driving. Alternative forms of transportation aren't very widely used or supported.
Kansas City Information and Demographics
The overall education level of Kansas City citizens is substantially higher than the typical US community, as 29.55% of adults in Kansas City have at least a bachelor's degree, and the average American community has 21.84%.
The per capita income in Kansas City in 2010 was $25,683, which is wealthy relative to Missouri, and upper middle income relative to the rest of the US. This equates to an annual income of $102,732 for a family of four. However, Kansas City contains both very wealthy and poor people as well.
Kansas City is an extremely ethnically-diverse city. The people who call Kansas City home describe themselves as belonging to a variety of racial and ethnic groups. The greatest number of Kansas City residents report their race to be White, followed by Black or African-American. Important ancestries of people in Kansas City include German, Irish, English and Italian.
The most common language spoken in Kansas City is English. Some people also speak Spanish.
Information by Department of Numbers, Bureau of Labor Statistics, U.S. Census Bureau and Locatoin Incorporated are deemed reliable but not guaranteed.
Kansas City APPRECIATION RATE
| TIME PERIOD | TOTAL APPRECIATION | AVG. ANNUAL RATE | COMPARED TO State* | COMPARED TO AMERICA* |
|---|---|---|---|---|
| Latest Quarter: 2023 Q3-2023 Q4 |
0.00% | 0.00% | ||
| Last 12 Months: 2022 Q4-2023 Q4 |
0.00% | 0.00% | ||
| Last 2 Years: 2021 Q4-2023 Q4 |
0.00% | 0.00% | ||
| Last 5 Years: 2018 Q4-2023 Q4 |
0.00% | 0.00% | ||
| Last 10 Years: 2013 Q4-2023 Q4 |
0.00% | 0.00% | ||
| Since 2000: Q1-2023 Q4 | 0.00% | 0.00% |
RENT & OWNERSHIP
HOME OWNERSHIP RATE
REGIONAL APPRECIATION POTENTIAL
RATINGS: 1=Very Low 2=Low 3=Moderate 4=High 5=Very High
REGIONAL HOUSING MARKET ANALYSIS
HOUSING AFFORDIBALITY TRENDS: KANSAS CITY METRO AREA
Years of average household income needed to buy average home
0.00
Region Historical Low
0.00
Region Historical High
0.00
Current
REGIONAL 1 AND 2 YEAR GROWTH TRENDS
| REGIONAL TREND | LAST 1 YEAR | COMPARED TO NATION* | LAST 2 YEARS | COMPARED TO NATION* |
|---|---|---|---|---|
| Population Growth | 0.00% | 0.00% | ||
| Job Growth | 0.00% | 0.00% | ||
| Income Trends(Wages) | 0.00% | 0.00% | ||
| Unemployment Trend | 0.00% | 0.00% | ||
| Stock Performance of Region's Industries | 0.00% | 0.00% | ||
| Housing Added | 0.00% | 0.00% | ||
| Vacancy Trend | 0.00% | 0.00% |
Check Back Often for New Investment Opportunities!

Real estate is the most powerful way to accumulate wealth, and more people have become millionaires through real estate than any other means.
This guide has been written in an effort to help educate all real estate investors regardless of their experience.
Dedicated to all investors who want the very best deals!
The advantages of income-generating real estate.
How to analyze properties, cash-flow and returns.
How to choose the best markets and neighborhoods.