![]()

Cleveland Investment Properties For Sale
Top 10 Job Market for New College Graduates (CNN)
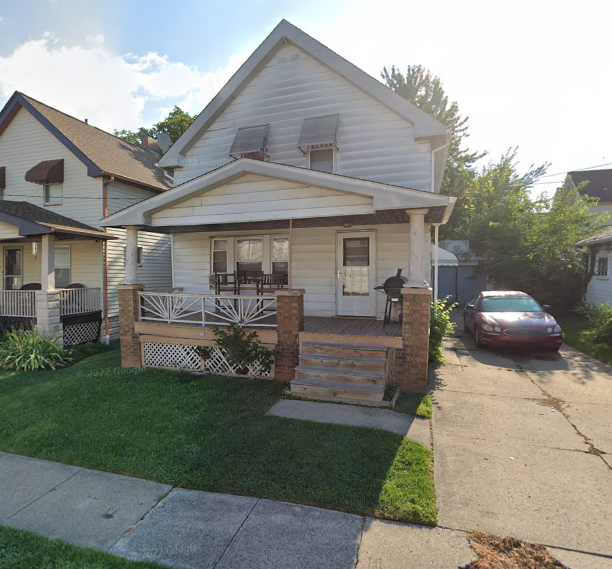
W 42nd St
Cleveland, Ohio
$190,000
$1,500
1914
$195
0.8%
B
7.3%
$1,154
A Perfect Example of the Revitalization of an American City
Northeast Ohio and specifially Cleveland has become the poster child of American revival in core industries. It combines a solid business infrastructure with education, lifestyle and an affrdable cost of living. The universities attract researchers and students from around the world. The city has a great orchestra, museums and recognized sports teams. There are miles of park trails, the shores of Lake Erie and The Rock and Roll Hall of Fame. All of this adds up to make Cleveland a great place to live and work, and thus an attractive investment climate for rental real estate
Overview
Cleveland is a large city located in the state of Ohio. With a population of 385,809 people and 176 constituent neighborhoods, Cleveland is the second largest community in Ohio. Much of the housing stock in Cleveland was built prior to World War II, making it one of the older and more historic cities in the country.
Unlike some cities where white-collar or blue-collar occupations dominate the local economy, Cleveland is neither predominantly one nor the other. Instead, it has a mixed workforce of both white- and blue-collar jobs. Overall, Cleveland is a city of service providers, sales and office workers, and professionals. There are especially a lot of people living in Cleveland who work in office and administrative support (14.08%), sales jobs (8.80%), and food service (8.44%).
Cleveland, like many big cities in America, has a public transportation system, but the citizens of Cleveland are lucky because theirs is one of the most extensive and widely used. Many commuters choose to leave their cars at home and instead use the bus to get to and from work. In fact, for some people it is feasible to forgo car ownership entirely, avoiding the cost and headache of driving in heavy traffic. The benefits include reduced air pollution and load on the road network.
The citizens of Cleveland are slightly less educated than the national average of 21.84% for the average city or town: 16.07% of adults in Cleveland have a bachelor's degree or advanced degree.
The per capita income in Cleveland in 2010 was $18,003, which is low income relative to Ohio and the nation. This equates to an annual income of $72,012 for a family of four. Cleveland also has one of the higher rates of people living in poverty in the nation, with 35.98% of its population below the federal poverty line.
Cleveland is an extremely ethnically-diverse city. The people who call Cleveland home describe themselves as belonging to a variety of racial and ethnic groups. The greatest number of Cleveland residents report their race to be Black or African-American, followed by White. Cleveland also has a sizeable Hispanic population (people of Hispanic origin can be of any race). People of Hispanic or Latino origin account for 10.84% of the city’s residents. Important ancestries of people in Cleveland include Irish, Italian, Polish, and English.
The most common language spoken in Cleveland is English. Other important languages spoken here include Spanish and Arabic.
Information by Department of Numbers, Bureau of Labor Statistics, U.S. Census Bureau and Locatoin Incorporated are deemed reliable but not guaranteed.
Cleveland APPRECIATION RATE
| TIME PERIOD | TOTAL APPRECIATION | AVG. ANNUAL RATE | COMPARED TO State* | COMPARED TO AMERICA* |
|---|---|---|---|---|
| Latest Quarter: 2023 Q3-2023 Q4 |
0.00% | 0.00% | ||
| Last 12 Months: 2022 Q4-2023 Q4 |
0.00% | 0.00% | ||
| Last 2 Years: 2021 Q4-2023 Q4 |
0.00% | 0.00% | ||
| Last 5 Years: 2018 Q4-2023 Q4 |
0.00% | 0.00% | ||
| Last 10 Years: 2013 Q4-2023 Q4 |
0.00% | 0.00% | ||
| Since 2000: Q1-2023 Q4 | 0.00% | 0.00% |
RENT & OWNERSHIP
HOME OWNERSHIP RATE
REGIONAL APPRECIATION POTENTIAL
RATINGS: 1=Very Low 2=Low 3=Moderate 4=High 5=Very High
REGIONAL HOUSING MARKET ANALYSIS
HOUSING AFFORDIBALITY TRENDS: CLEVELAND METRO AREA
Years of average household income needed to buy average home
0.00
Region Historical Low
0.00
Region Historical High
0.00
Current
REGIONAL 1 AND 2 YEAR GROWTH TRENDS
| REGIONAL TREND | LAST 1 YEAR | COMPARED TO NATION* | LAST 2 YEARS | COMPARED TO NATION* |
|---|---|---|---|---|
| Population Growth | 0.00% | 0.00% | ||
| Job Growth | 0.00% | 0.00% | ||
| Income Trends(Wages) | 0.00% | 0.00% | ||
| Unemployment Trend | 0.00% | 0.00% | ||
| Stock Performance of Region's Industries | 0.00% | 0.00% | ||
| Housing Added | 0.00% | 0.00% | ||
| Vacancy Trend | 0.00% | 0.00% |
Check Back Often for New Investment Opportunities!

Real estate is the most powerful way to accumulate wealth, and more people have become millionaires through real estate than any other means.
This guide has been written in an effort to help educate all real estate investors regardless of their experience.
Dedicated to all investors who want the very best deals!
The advantages of income-generating real estate.
How to analyze properties, cash-flow and returns.
How to choose the best markets and neighborhoods.