![]()

Memphis Investment Properties For Sale
Fully Rehabbed Properties with Great Cash Flow
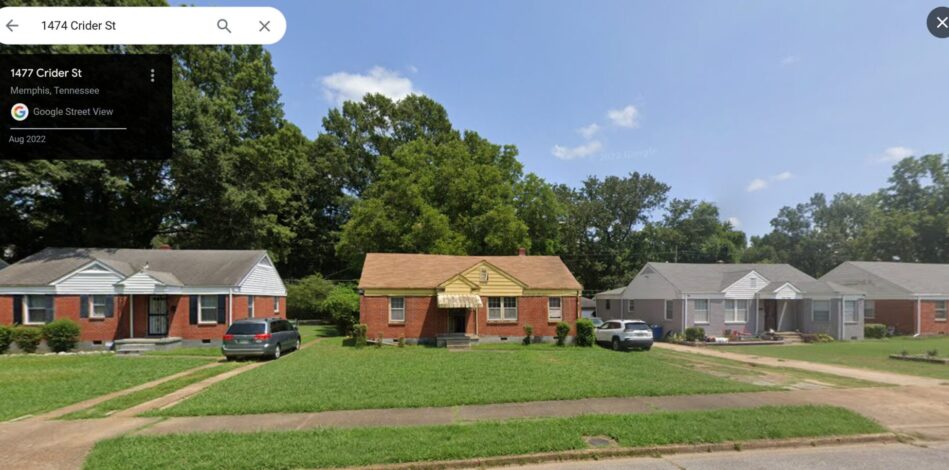
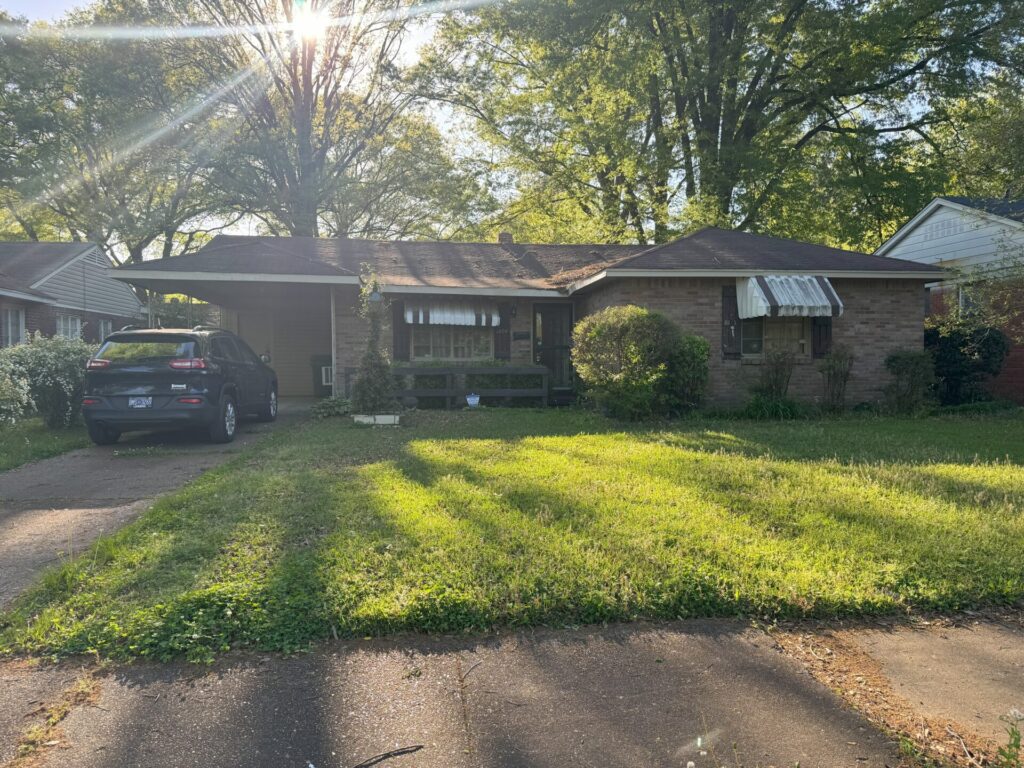
Crider Street
Memphis, Tennessee
$144,900
$1,395
1954
$118
1.0%
B-
9.3%
$1,126
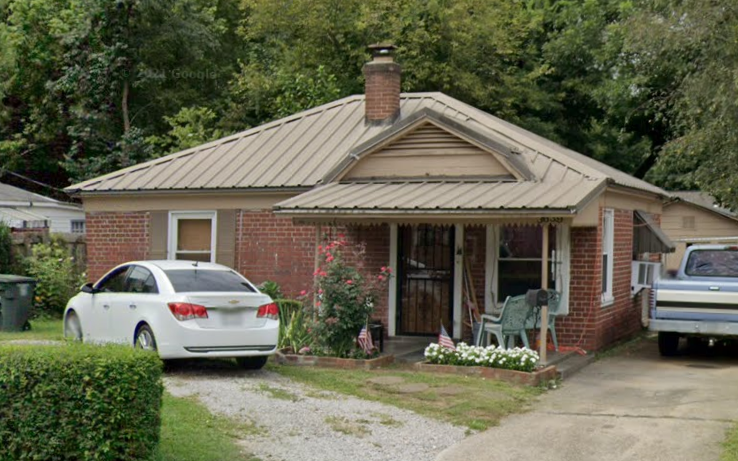
Oakridge
Memphis, Tennessee
$164,900
$1,695
1954
$135
1.0%
B-
10.3%
$1,412
Townes
Memphis, Tennessee
$129,900
$1,295
1948
$124
1.0%
B
10.0%
$1,086
For many reasons, Memphis investment properties make a lot of sense economically, fundamentally, and financially.
Memphis is a very large city located in the state of Tennessee. With a population of 652,050 people and 181 constituent neighborhoods, Memphis is the largest community in Tennessee.
Memphis is neither predominantly blue-collar nor white-collar, instead having a mixed workforce of both blue-collar and white-collar jobs. Overall, Memphis is a city of sales and office workers, service providers and professionals. There are especially a lot of people living in Memphis who work in office and administrative support (16.12%), sales jobs (10.79%) and management occupations (6.92%).
One important feature of Memphis is that it is one of the most car-oriented large cities in the country. In fact, 80.59% of people commute to and from work every day by private automobile, eschewing alternative forms of transportation, which are not widely available in Memphis anyway. So, if you like to drive, Memphis is the city for you! The landscape around Memphis reflects this: wide streets, parking lots, plenty of highways, malls, and shopping centers are what you'll find.
Memphis Information and Demographics
The education level of Memphis citizens is a little higher than the average for US cities and towns: 22.48% of adults in Memphis have at least a bachelor's degree.
The per capita income in Memphis in 2010 was $21,007, which is upper middle income relative to Tennessee, and middle income relative to the rest of the US. This equates to an annual income of $84,028 for a family of four. However, Memphis contains both very wealthy and poor people as well.
Memphis is an extremely ethnically-diverse city. The people who call Memphis home describe themselves as belonging to a variety of racial and ethnic groups. The greatest number of Memphis residents report their race to be Black or African-American, followed by White. Important ancestries of people in Memphis include English, Irish and German.
The most common language spoken in Memphis is English. Some people also speak Spanish.
Information by Department of Numbers, Bureau of Labor Statistics, U.S. Census Bureau and Locatoin Incorporated are deemed reliable but not guaranteed.
Memphis APPRECIATION RATE
| TIME PERIOD | TOTAL APPRECIATION | AVG. ANNUAL RATE | COMPARED TO State* | COMPARED TO AMERICA* |
|---|---|---|---|---|
| Latest Quarter: 2023 Q3-2023 Q4 |
0.00% | 0.00% | ||
| Last 12 Months: 2022 Q4-2023 Q4 |
0.00% | 0.00% | ||
| Last 2 Years: 2021 Q4-2023 Q4 |
0.00% | 0.00% | ||
| Last 5 Years: 2018 Q4-2023 Q4 |
0.00% | 0.00% | ||
| Last 10 Years: 2013 Q4-2023 Q4 |
0.00% | 0.00% | ||
| Since 2000: Q1-2023 Q4 | 0.00% | 0.00% |
RENT & OWNERSHIP
HOME OWNERSHIP RATE
REGIONAL APPRECIATION POTENTIAL
RATINGS: 1=Very Low 2=Low 3=Moderate 4=High 5=Very High
REGIONAL HOUSING MARKET ANALYSIS
HOUSING AFFORDIBALITY TRENDS: MEMPHIS METRO AREA
Years of average household income needed to buy average home
0.00
Region Historical Low
0.00
Region Historical High
0.00
Current
REGIONAL 1 AND 2 YEAR GROWTH TRENDS
| REGIONAL TREND | LAST 1 YEAR | COMPARED TO NATION* | LAST 2 YEARS | COMPARED TO NATION* |
|---|---|---|---|---|
| Population Growth | 0.00% | 0.00% | ||
| Job Growth | 0.00% | 0.00% | ||
| Income Trends(Wages) | 0.00% | 0.00% | ||
| Unemployment Trend | 0.00% | 0.00% | ||
| Stock Performance of Region's Industries | 0.00% | 0.00% | ||
| Housing Added | 0.00% | 0.00% | ||
| Vacancy Trend | 0.00% | 0.00% |
Check Back Often for New Investment Opportunities!
Real estate is the most powerful way to accumulate wealth, and more people have become millionaires through real estate than any other means.
This guide has been written in an effort to help educate all real estate investors regardless of their experience.
Dedicated to all investors who want the very best deals!
The advantages of income-generating real estate.
How to analyze properties, cash-flow and returns.
How to choose the best markets and neighborhoods.