Norada Real Estate Investments

  • Home
  • Markets
  • Properties
  • Membership
  • Podcast
  • Learn
  • About
  • Contact

Average Housing Prices by Year in the United States

June 1, 2025 by Marco Santarelli

Average Housing Prices by Year in the United States

If you are interested in the history of the US housing market, you might want to know how the average and median prices of houses have changed over time. In this blog post, we will use data from various sources to show you the trends and patterns of house prices in the US from 1953 to 2023.

Defining Terms

The average price of houses sold is the total value of all houses sold divided by the number of houses sold in a given period. The median price of houses sold is the middle point of the distribution of house prices, such that half of the houses are sold for more and half for less than that price. The average price can be influenced by outliers, such as very expensive or very cheap houses, while the median price is more representative of the typical house price.

Average Housing Prices by Year

According to data from FRED, a database maintained by the Federal Reserve Bank of St. Louis, the average price of houses sold in the US in the second quarter of 2023 was $495,100, down from $505,300 in the first quarter and $552,600 in the fourth quarter of 2022. The average price peaked at $552,600 in the fourth quarter of 2022, which was the highest level since the series began in 1963. The lowest average price was $17,200 in the first quarter of 1963.

Median Housing Prices by Year

The median price of houses sold in the US in the second quarter of 2023 was $390,500, down from $399,900 in the first quarter and $417,800 in the fourth quarter of 2022. The median price also peaked at $417,800 in the fourth quarter of 2022, which was also the highest level since the series began in 1963. The lowest median price was $17,500 in the first quarter of 1963.

Historical Trends

The chart below shows the historical trends of both the average and median prices of houses sold in the US from 1963 to 2023.

Average Housing Prices by Year in the United States
Source: FRED

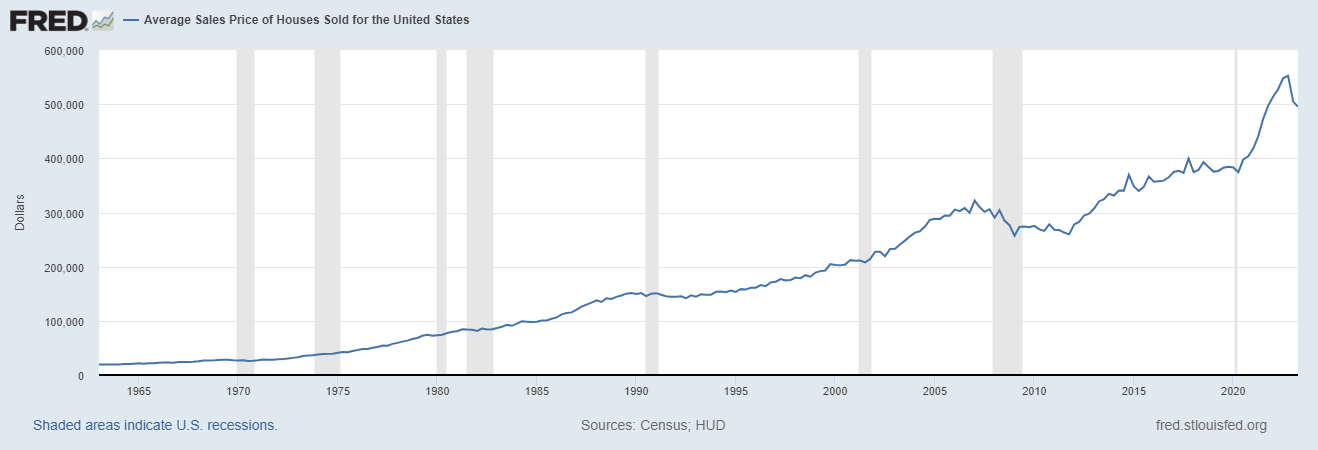
As you can see, both prices have increased significantly over time, but with some fluctuations along the way. The most notable periods of rapid growth were from 1975 to 1980, from 1997 to 2006, and from 2012 to 2022. The most notable periods of decline were from 1980 to 1982, from 2006 to 2012, and from 2022 to 2023.

Factors Affecting Housing Prices

  • Supply and demand: When there are more buyers than sellers, or more demand than supply, house prices tend to rise. When there are more sellers than buyers, or more supply than demand, house prices tend to fall.
  • Income and population growth: When people have more income or when there are more people looking for housing, house prices tend to rise. When people have less income or when there are fewer people looking for housing, house prices tend to fall.
  • Inflation and interest rates: When inflation is high or when interest rates are high, house prices tend to fall. When inflation is low or when interest rates are low, house prices tend to rise.
  • Consumer confidence and expectations: When people are optimistic about the economy or when they expect house prices to rise in the future, they are more likely to buy houses. When people are pessimistic about the economy or when they expect house prices to fall in the future, they are less likely to buy houses.
  • Government policies and regulations: When the government provides subsidies or incentives for home buyers or home builders, house prices tend to rise. When the government imposes taxes or restrictions on home buyers or home builders, house prices tend to fall.
  • Regional variations: House prices can vary widely across different regions or markets depending on local factors such as climate, geography, amenities, infrastructure, culture, and preferences.

Historical Median Prices of Existing Homes

If we go back further in time, we can find data on the median price of existing homes (not new homes) from another source: DQYDJ, a website that provides financial calculators and tools. According to DQYDJ, the median price of existing homes in the US in September 2021 was $363,300 (in nominal terms) or $363,300 (in inflation-adjusted terms). The data goes back to January 1953, when the median price was $18,080 (in nominal terms) or $207,781 (in inflation-adjusted terms).

Historical Trends of Median Prices of Existing Homes

The chart below shows the historical trends of both the nominal and inflation-adjusted median prices of existing homes in the US from 1953 to 2021.

Trends of Median Home Prices by Year
Credits: DQYDJ

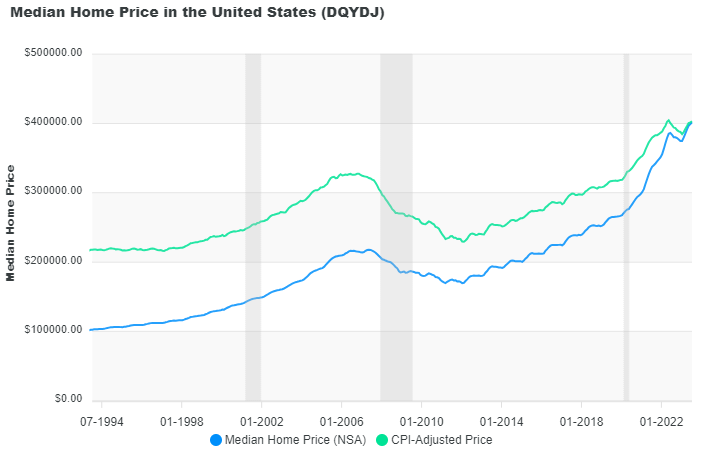
As you can see, both prices have also increased significantly over time, but with some differences from the new home prices. The nominal price has increased by almost 20 times since 1953, while the inflation-adjusted price has increased by about 1.7 times. The inflation-adjusted price shows that real home values have not increased as much as nominal home values over time. The nominal price also shows more volatility than the inflation-adjusted price, especially during periods of high inflation or deflation.

To summarize, this blog post has shown you how the average and median prices of houses sold and existing homes have changed over time in the US from 1953 to 2023. You have seen that both prices have increased significantly over time but with some fluctuations and differences along the way. You have also learned some of the main factors that influence house prices in the US. We hope you have found this information useful and interesting. Thank you for reading!

Read More:

  • Average Rent Prices in America: A State-by-State Breakdown
  • Average Home Price in Los Angeles Reaches $953K
  • Average Home Price in San Jose Reaches $1.45 Million
  • Average Home Appreciation Over 30 Years: How to Calculate?
  • What Will the Average House Price Be in 2040: Predictions
  • Average Home Value Increase Per Year, 5 Years, 10 Years
  • Average House Price Increase Over Last 30 Years
  • Average Home Price in San Francisco in 1980
  • Average Cost of a House in 1970, 1990, and 2000
  • Average Cost of a House in 1980
  • Average House Price in 1950 (Compared to Today)

Filed Under: Housing Market, Real Estate, Real Estate Market Tagged With: Average Housing Prices, Average Housing Prices by Year, Housing Prices

Average Home Appreciation Over 30 Years: How to Calculate?

November 26, 2024 by Marco Santarelli

Average Home Appreciation Over 30 Years

If you own a house or plan to buy one, you might be curious about how much your property will appreciate over 30 years. Home appreciation is the increase in value of a house or an investment property over a period of time due to various factors, such as market conditions, location, neighborhood, renovations, and inflation. Home appreciation can affect your financial security, tax benefits, and equity.

In this blog post, we will answer some common questions about home appreciation:

  • What is the average rate of appreciation for a house over 30 years?
  • How much will a house appreciate in 30 years?
  • How much will a house appreciate in 10 years?
  • How much will a house appreciate in 20 years?

What is the average rate of appreciation for a house over 30 years?

The average rate of appreciation for a house over 30 years depends on many factors, such as the location, size, condition, and age of the property, as well as the supply and demand of the housing market. According to the U.S. Federal Housing Finance Agency’s House Price Calculator, you can estimate your home’s value based on your closing date and purchase price.

However, this is only an approximation and may not reflect the actual market value of your home. To get a more accurate estimate, you can consult a real estate agent or an appraiser who can compare your home with similar properties that have recently sold in your area.

The average rate of appreciation for a house over 30 years also varies by region and time period. For example, according to Black Knight’s report, the national appreciation rate was 3.8% per year in 2019, slightly less than the 25-year average of 3.9%. However, some states and cities had much higher or lower appreciation rates than the national average.

For instance, California had an average annual appreciation rate of 6.4% from 1992 to 2023, while Hawaii had an average annual appreciation rate of 4.8% in the same period. On the other hand, Nevada had an average annual appreciation rate of 2.7% from 1992 to 2023, while Maine had an average annual appreciation rate of 2.9% in the same period.

Therefore, to answer the question of what is the average rate of appreciation for a house over 30 years, you need to consider both the national and local trends, as well as the specific characteristics of your property.

How much will a house appreciate in 30 years?

The answer to this question depends on how much your house appreciated in the past and how much it will appreciate in the future. To estimate how much your house will appreciate in 30 years, you can use the following formula:

Future value = Current value x (1 + Annual appreciation rate) ^ 30

For example, if your house is worth $300,000 today and has an annual appreciation rate of 4%, then its future value in 30 years will be:

Future value = $300,000 x (1 + 0.04) ^ 30
Future value = $300,000 x 3.24
Future value = $972,000

This means that your house will appreciate by $672,000 or 224% in 30 years.

However, this is only an estimate based on historical data and assumptions. The actual future value of your house may be higher or lower depending on how the housing market performs in the next three decades.

Therefore, to answer the question of how much will a house appreciate in 30 years, you need to monitor the market conditions and adjust your expectations accordingly.

How much should a house appreciate in 10 years?

The answer to this question depends on how much your house appreciated in the past and how much it will appreciate in the future. To estimate how much your house should appreciate in 10 years, you can use the following formula:

Future value = Current value x (1 + Annual appreciation rate) ^ 10

For example, if your house is worth $300,000 today and has an annual appreciation rate of 4%, then its future value in 10 years will be:

Future value = $300,000 x (1 + 0.04) ^ 10
Future value = $300,000 x 1.48
Future value = $444,000

This means that your house should appreciate by $144,000 or 48% in 10 years.

Again, this is only an estimate based on historical data and assumptions. The actual future value of your house may be higher or lower depending on how the housing market performs in the next decade.

How much will a house appreciate in 20 years?

Let's use the formula mentioned earlier to estimate the future value:

Future Value = Current Value x (1 + Annual Appreciation Rate) ^ Number of Years

Example:

  • Current Value: $300,000
  • Annual Appreciation Rate (Assumption): 4% (This is an average, consult a professional for a specific rate for your area)
  • Number of Years: 20

Step 1: Calculate the Appreciation Factor

Appreciation Factor = 1 + Annual Appreciation Rate Appreciation Factor = 1 + 0.04 = 1.04

Step 2: Calculate the Future Value

Future Value = $300,000 x (1.04) ^ 20 Future Value = $300,000 x 2.48 = $744,000

Result:

Based on this example, with a 4% annual appreciation rate, a $300,000 house could potentially be worth around $744,000 in 20 years. This translates to an appreciation of $444,000 or 148%.

Getting a More Accurate Assessment:

For a more informed estimate, consult with a real estate professional familiar with your specific area and property. They can consider the local market trends and factors that might influence your house's value in the coming years.

Conclusion

Home appreciation is an important factor to consider when buying or selling a house. It can affect your financial security, tax benefits, and equity. However, home appreciation is not a fixed or guaranteed outcome. It depends on many factors that can change over time and vary by location.

Predicting house appreciation over 10, 20, or 30 years is difficult due to various influencing factors. However, we can explore some historical averages and a helpful formula for estimation:

Uncertainties in Appreciation:

  • Location: Houses in desirable areas with limited supply tend to appreciate more than those in less attractive locations.
  • Property type: Single-family homes generally appreciate more than condos or townhomes.
  • Market Conditions: A strong overall economy and healthy housing market can lead to higher appreciation rates.
  • Improvements made to the home: Renovations and upgrades can increase the value of a home.

To estimate your home’s value and appreciation rate over 30 years, you can use online tools such as calculators and reports, or consult professionals such as real estate agents and appraisers. However, these are only approximations and may not reflect the actual market value of your home.

Therefore, to make informed decisions about your property, you need to keep track of both the national and local trends, as well as the specific characteristics of your property.

We hope this blog post has answered some of your questions about home appreciation over 1o, 20, and 30 years. If you have any feedback or suggestions for future topics, please let us know in the comments section below.


References:

  • : https://www.ownerly.com/real-estate/average-home-appreciation/
  • : https://www.blackknightinc.com/black-knights-first-look-at-march-2019-mortgage-data/
  • : https://tradingeconomics.com/united-states/house-price-index-yoy
  • : https://www.in2013dollars.com/Housing/price-inflation

Filed Under: Housing Market, Real Estate, Real Estate Market Tagged With: Average Home Appreciation Over 30 Years, Average Housing Prices, Average Housing Prices by Year

Real Estate

  • Baltimore
  • Birmingham
  • Cape Coral
  • Charlotte
  • Chicago

Quick Links

  • Markets
  • Membership
  • Notes
  • Contact Us

Blog Posts

  • 5 Big Florida Housing Markets Flagged for a Major Price Decline Risk
    June 16, 2025Marco Santarelli
  • 24 Florida Housing Markets Could See Home Prices Drop by Early 2026
    June 16, 2025Marco Santarelli
  • Interest Rate Predictions for the Next 3 Years: 2025, 2026, 2027
    June 16, 2025Marco Santarelli

Contact

Norada Real Estate Investments 30251 Golden Lantern, Suite E-261 Laguna Niguel, CA 92677

(949) 218-6668
(800) 611-3060
BBB
  • Terms of Use
  • |
  • Privacy Policy
  • |
  • Testimonials
  • |
  • Suggestions?
  • |
  • Home

Copyright 2018 Norada Real Estate Investments

Loading...