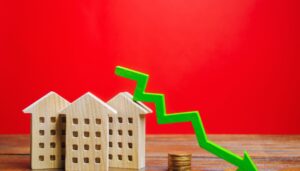
The U.S. housing market in 2026 isn't heading for a dramatic crash or a wild boom. Instead, expect a period of modest growth and gradual rebalancing. Think of it less like a rollercoaster and more like a steady climb, with some bumps along the way. This is good news for many of you who have been waiting on the sidelines, feeling that sense of uncertainty about where things are headed.
Housing Market Predictions 2026: No Crash, No Boom, Just Rebalancing
As we stand on the cusp of 2026, I've been looking at all the reports and talking to people who live and breathe real estate. It seems like the feverish pace of a few years ago has definitely cooled off. We aren't seeing the insane bidding wars or homes flying off the market in a day that we did during the pandemic. On the flip side, the fears of a massive drop in prices also seem overblown.
This is my take, based on what the experts are saying and what I've seen myself: the market is getting back to a more normal rhythm. Prices will likely inch up, and more homes will be sold, but it won't be a story of explosive gains or devastating losses.
What's Driving This Predictable Path?
So, what makes me confident in saying things will be relatively stable? It’s a combination of economic factors, availability of homes, and, of course, the cost of borrowing money.
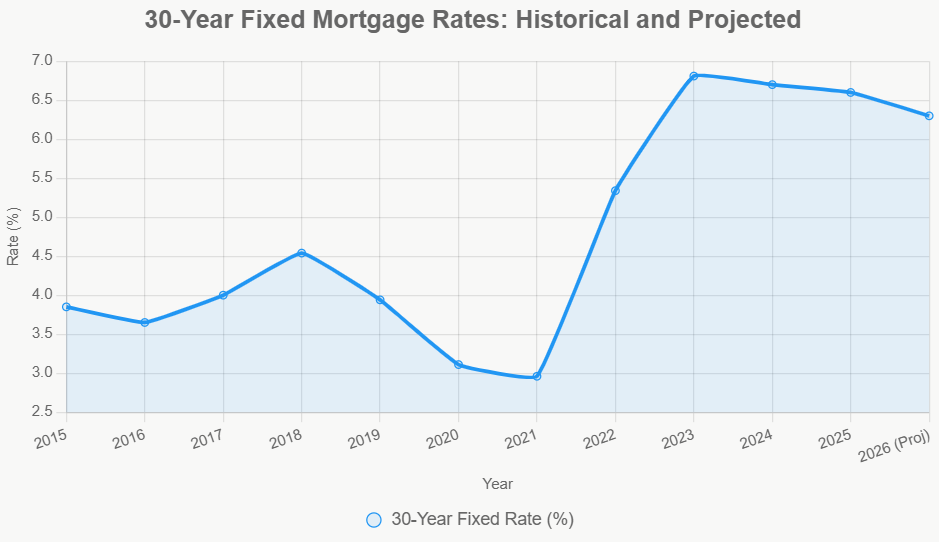
- Interest Rates: Still a Big Deal, but Getting BetterThe days of getting a mortgage for practically free are long gone, and honestly, they probably won't be back anytime soon. The experts are saying that the average 30-year fixed mortgage rate will hover around 6.3% in 2026. That’s down a bit from where we've been, which is something to celebrate. However, it's still significantly higher than the super-low rates we saw a few years ago. This higher cost of borrowing is a major reason why we won't see a boom. It makes buying a home more expensive, which naturally puts a brake on how high prices can go.I remember when getting a mortgage was practically like getting free money. Now, everyone has to factor in that monthly payment difference, and it adds up quickly. It's a big hurdle for many potential buyers.
- More Homes for Sale, But Not Exactly OverflowingOne of the biggest headaches for buyers in recent years has been the lack of homes to choose from. Thankfully, that picture is improving. By 2026, we're expected to see the supply of homes for sale rise to about 4.6 months. This is a much healthier number than the 3-4 months we've been dealing with lately. Think of it this way: if no new homes were listed, it would take about 4.6 months to sell the ones that are currently available.With more homes on the market, sellers might have to be a little more patient and perhaps a bit more willing to negotiate. This extra supply is the main reason why sales numbers are expected to go up, possibly reaching around 4.2 million homes sold.
- The Economy: Steady As She GoesThe overall health of the economy plays a huge role. For 2026, we're looking at pretty steady economic growth, with the Gross Domestic Product (GDP) expected to grow between 2% and 2.25%. The unemployment rate is predicted to be around 4.7%, which isn't bad at all. And inflation, while still a concern, is expected to settle down to somewhere between 2.3% and 3%.These numbers paint a picture of an economy that's not overheating, but also not collapsing. This kind of environment supports a stable housing market – no sudden shocks that would send prices soaring or crashing.
A Look at the Numbers: What the Experts Are Saying
To give you a clearer picture, let's break down some of the key predictions.
| Factor | Current (Late 2025 Estimate) | Projected (2026) | Key Takeaway |
|---|---|---|---|
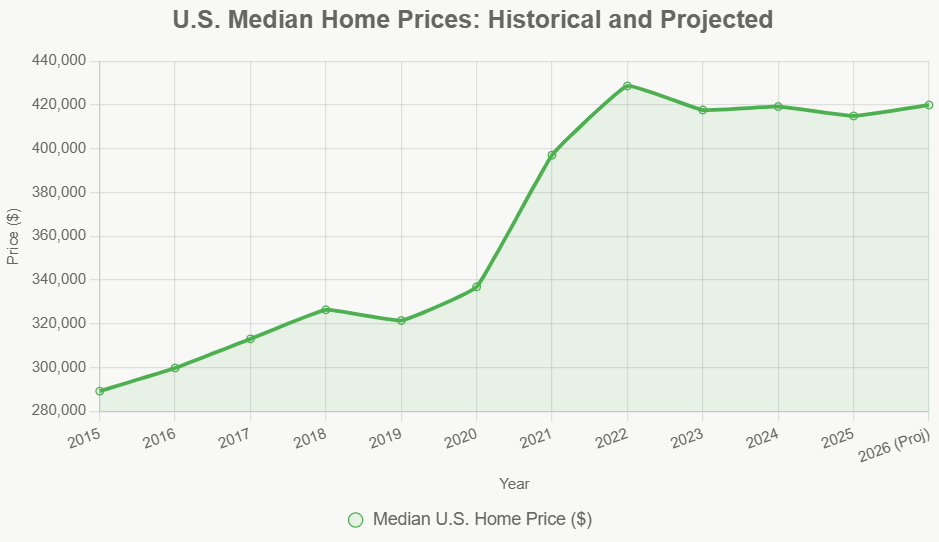
| Home Price Change | Slight Dip/Plateau | +1% to +2.2% | Modest, controlled growth, not a boom. |
| Home Sales Volume | ~4.08 million | 4.13-4.26 million | Gradual increase, but still below pre-pandemic. |
| 30-Year Mortgage Rate | ~6.6% – 6.7% | ~6.3% | Still elevated, impacting affordability. |
| Inventory (Months) | 3-4 months | ~4.6 months | Improving supply, easing buyer pressure. |
| GDP Growth | – | 2% – 2.25% | Steady economic expansion. |
| Unemployment Rate | – | ~4.7% | Healthy job market. |
| Inflation | – | 2.3% – 3% | Cooling down, but still a factor. |
As you can see, the numbers themselves tell a story of moderation. We're not entering a period of dramatic price drops like the 2006-2008 crash, nor are we looking at the double-digit percentage gains we saw from 2020-2022.
Regional Differences: It's Not the Same Everywhere!
One of the most important things to remember is that the U.S. housing market is not one big, uniform blob. Where you are matters a lot.
- Sun Belt Cooling Down: Places like Florida and Texas, which saw massive growth, might actually cool off a bit. Things like rising insurance costs (especially in Florida) and the fact that some areas might have built a bit too much could lead to slightly lower prices or slower growth.
- Rust Belt Rising (Slowly): On the other hand, cities in the Rust Belt, areas like Cleveland and parts of the Midwest, could see steadier, more reliable gains. Why? Because they are more affordable and are seeing people move there for jobs and a lower cost of living.
Let's look at this in a table to make it super clear:
| Region/Metro | Projected Price Change (2026) | Key Driver |
|---|---|---|
| Cleveland, OH | +3% to +4% | Affordability, job stability |
| Chicago, IL | +2.5% | Tight supply, urban revival |
| Miami, FL | -2% to -3% | Insurance hikes, hurricane risks |
| Austin, TX | -1.5% | Overbuilding, office returns |
| NYC Suburbs | +2% | Hybrid work migration |
| Los Angeles, CA | Flat | High costs, intra-metro shifts |
This really shows that you can't just look at national numbers and expect them to apply to your backyard. The local economy, job market, and even things like climate and insurance costs play a huge role.
What About Potential Crashes or Booms?
While the general outlook is for stability, it's always wise to consider the “what ifs.”
- When a Crash Could Happen (But Probably Won't Be Big):Honestly, a nationwide crash where prices drop by 10-20% seems pretty unlikely. We have much stronger protections in place now than we did back in 2008. For example, most homeowners have built up a lot of equity, which means they have a financial cushion. Also, the limited supply of homes helps keep prices from falling too low.However, there are a few things that could cause problems:
- Job Losses: If the economy suddenly takes a nosedive and a lot of people lose their jobs, especially in high-paying sectors, demand for homes could drop fast.
- Surprise Economic Shocks: Imagine if new trade disputes caused inflation to spike, forcing the Federal Reserve to raise interest rates even higher. That could really hurt the market.
- Disasters: While more localized, things like a major hurricane or severe weather events that cause widespread damage and make insurance unaffordable could force some people to sell their homes at a loss.
- When a Boom Might Happen (But It Will Be Gentle):A boom, meaning prices shooting up by 5% or more nationwide, also seems out of reach for 2026. The main reason for this is affordability. Even with slightly lower interest rates, buying a home is still a big financial jump for many people, especially younger generations.What could give the market a little extra boost?
- Millennials and Gen Z Buying: As younger generations move into their prime home-buying years, there will naturally be more demand.
- More Homes Being Built: If builders can find ways to offer incentives, like helping with mortgage rates, they might pick up the pace of construction, adding more homes to the market.
- Investors: People and companies who buy homes to rent out are still active in the market, and their steady buying helps support prices.
The Big Picture: A Reset, Not a Revolution
To wrap things up, I don't see a housing market crash in 2026, and I don't see a wild boom either. What I do foresee is a reset. The market is moving towards a more balanced and sustainable path.
Affordability is slowly getting better, more homes are becoming available, and the economy is expected to chug along nicely. There will always be unexpected events, so it's wise to stay informed. But for now, the evidence points towards a housing market that is healing and moving forward at a steady pace.
For anyone who's been waiting to buy, patience might be rewarded with more choices and stable prices. For homeowners, your investment is likely to continue to hold its value, with modest growth expected. It's a market that's evolving, not exploding, and that's okay.
Want Stronger Returns? Invest Where the Housing Market’s Growing
Turnkey rental properties in fast-growing housing markets offer a powerful way to generate passive income with minimal hassle.
Work with Norada Real Estate to find stable, cash-flowing markets beyond the bubble zones—so you can build wealth without the risks of ultra-competitive areas.
🔥 HOT NEW LISTINGS JUST ADDED! 🔥
Talk to a Norada investment counselor today (No Obligation):
(800) 611-3060
Also Read:
- Will Real Estate Rebound in 2026: Top Predictions by Experts
- Housing Market Predictions for the Next 4 Years: 2026, 2027, 2028, 2029
- Housing Market Predictions for 2026 Show a Modest Price Rise of 1.2%
- Housing Market Predictions 2026 for Buyers, Sellers, and Renters
- 12 Housing Markets Set for Double-Digit Price Decline by Early 2026
- Real Estate Forecast: Will Home Prices Bottom Out in 2025?
- Housing Markets With the Biggest Decline in Home Prices Since 2024
- Why Real Estate Can Thrive During Tariffs Led Economic Uncertainty
- Rise of AI-Powered Hyperlocal Real Estate Marketing in 2025
- Real Estate Forecast Next 5 Years: Top 5 Predictions for Future
- 5 Hottest Real Estate Markets for Buyers & Investors in 2025