If you're looking to put your money into real estate in 2026, my advice is to look toward the Midwest and Northeast. These regions are poised for smart growth, offering a more stable and affordable path forward compared to the frenzied market we've seen in recent years. It feels like we're entering a crucial “Great Housing Reset” (as Redfin recently noted), where wise investors will find solid opportunities in a market finally finding its balance.
Best Cities to Invest in Real Estate in 2026
It’s easy to get caught up in the hype of the hottest markets, but as I’ve learned over the years, true real estate success often lies in understanding the underlying trends and choosing locations that offer long-term potential. The days of rapid, unsustainable price hikes are likely behind us for now. Instead, 2026 is shaping up to be a year for strategic investing, focusing on cities that balance affordability with steady appreciation and strong rental demand. I’ve spent a lot of time sifting through data and talking to folks on the ground, and a few clear winners are emerging.
Why the Shift? Understanding the “Housing Reset”
After the post-pandemic boom, where prices seemed to skyrocket everywhere, we're seeing a natural correction. Think of it like a pendulum swinging back. Many previously “hot” areas in the Sun Belt, which saw massive building and a surge in demand, are now dealing with higher supply and the tough reality of rising insurance costs. This is making them less attractive for investors looking for quick returns or stable rental income.
Meanwhile, cities in the Midwest and Northeast are benefiting from a different story. They often have limited inventory, meaning there aren't as many homes available, which naturally pushes prices up. Plus, they still offer a level of relative affordability that has become rare elsewhere. This combination is a recipe for healthier, more sustainable growth.
Top Picks for Appreciation: Where Your Money Could Grow the Most
For those focused on seeing their investment value increase, these cities are standing out. I’m particularly excited about the potential in Ohio and New York for appreciation.
- Toledo, Ohio: This city is projected to lead the pack with an impressive 13.1% price growth in 2026. It’s a testament to how overlooked markets can offer significant upside when affordability meets demand.
- Syracuse, New York: Following closely is Syracuse, with an expected 12.4% price growth. The key here is acute supply constraints. When there simply aren't enough homes to go around, prices have a natural upward pressure.
- Hartford, Connecticut: Zillow even named Hartford the “#1 Hottest Market,” and I can see why. Home values here are rising faster than in many other major metros, with a projected 9.5% growth. It’s a great example of a Northeast city finding its footing.
- Rochester, New York: Another New York gem, Rochester is predicted to see 10.3% growth. The driving force? Strong demand for affordable housing. As more people seek value, cities like Rochester become incredibly attractive.
Best for Cash Flow: Getting a Steady Rental Income
It's not just about appreciation; many investors want a reliable stream of income from their properties. For this, focusing on high rent-to-yield ratios is crucial.
- Cleveland, Ohio: This city is a standout for cash flow, boasting the highest rent-to-yield ratio at a fantastic 11.3%. This means your rental income is working hard for you.
- Indianapolis, Indiana: Not only is Indianapolis a buyer-friendly market, but it also offers a solid 9.1% gross rental yield. Add to that a steady 2.9% appreciation, and you have a balanced investment.
- Buffalo, New York: Buffalo is hitting the sweet spot, offering an 8.2% yield alongside high demand. I noticed a recent stat that 65% of homes there sold above asking price, which is a strong indicator of how sought-after properties are.
- Kansas City, Missouri: The National Association of REALTORS® recognized Kansas City as a top “housing hot spot,” largely due to its robust rental demand. This translates into consistent opportunities for landlords.
Long-Term Stability & Scale: Building for the Future
For those with a longer-term vision, or who are looking to invest in larger markets, these cities offer a more established path to growth and stability.
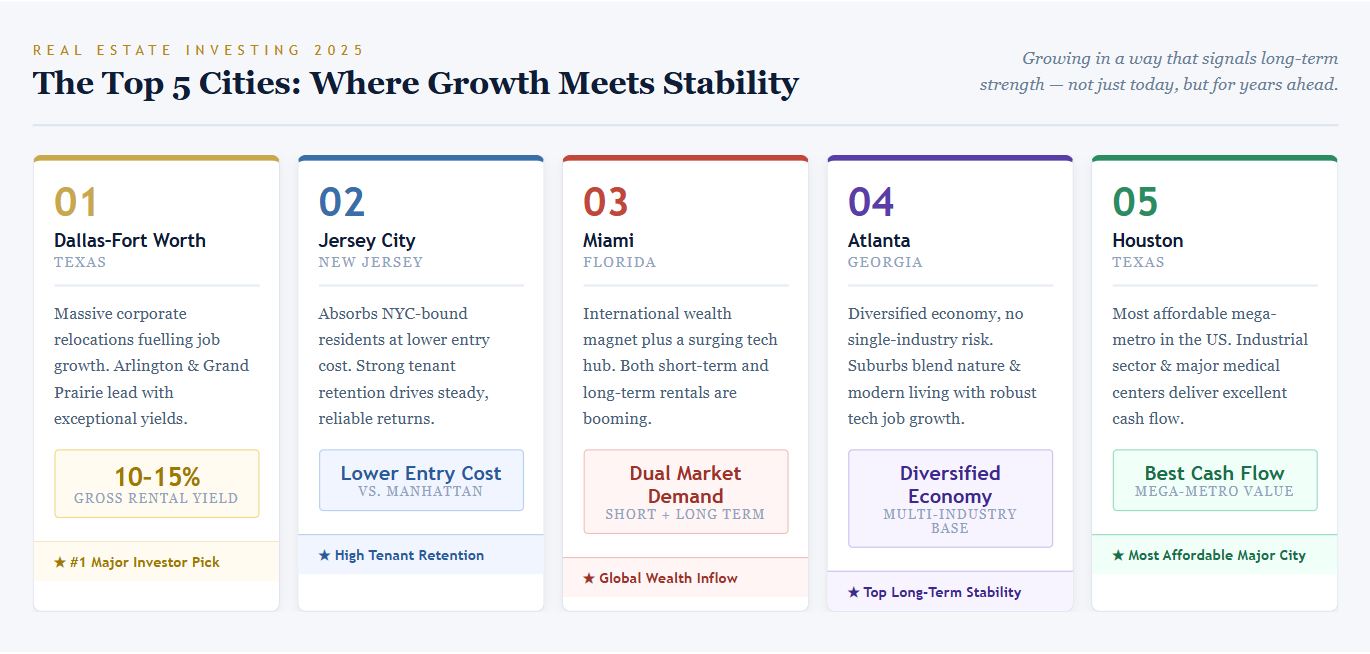
- Dallas-Fort Worth, Texas: Despite some cooling in other Sun Belt markets, DFW remains a top “market to watch.” Massive population and job growth are powerful engines for sustained real estate value. It's a market that continues to expand.
- Charlotte, North Carolina: As a major financial hub, Charlotte attracts a steady stream of professional tenants. With consistent professional tenant demand and 7.4% yields, it offers stability and predictable income.
- Atlanta, Georgia: Atlanta is one of the most buyer-friendly large metros, and the upcoming 2026 World Cup infrastructure improvements are only set to boost its appeal and economic activity.
Beyond U.S. Borders: Emerging Global Opportunities
I always like to keep an eye on international markets too, as they can offer unique advantages. For 2026, these locations are generating buzz:
- Dubai, UAE: It’s no surprise Dubai continues to be a top global destination. It consistently shows high rental performance, making it attractive for international investors.
- Tbilisi, Georgia: This city is catching attention with high rental yields of 7.5% and annual appreciation exceeding 8%. It’s a more emerging market with exciting potential.
- Kuala Lumpur, Malaysia: Forecasts are strong for Kuala Lumpur, with average rental yields around 6.5%. It represents a good entry point into a growing Asian market.
- Lisbon, Portugal: Lisbon is a favorite for its stable performance and the added benefit of its “Golden Visa” program, which can be a significant draw for investors.
Smart Investment Strategies for 2026
Beyond just picking a city, the type of investment also matters.
- Single-Family Rentals (SFR): With home prices and mortgage rates still a challenge for many, more people are choosing to rent. This trend means that single-family rentals are a solid bet, as they offer a more attractive alternative to homeownership for key demographics.
- Build-to-Rent (BTR): This sector is absolutely booming. Developers are creating entire communities specifically for renters. This is a direct response to people being priced out of buying but still wanting the quality and community feel they might get from homeownership.
- Niche Sectors: I’m also seeing growing interest in more specialized areas. The demand for data centers, fueled by the rise of AI, is immense. Similarly, senior housing is a sector with incredible long-term potential due to our aging population.
Investing in real estate in 2026 is about smart choices and understanding where the market is headed. By focusing on affordability, stable growth, and strong rental demand, you can position yourself for success. Remember, it's not about chasing the hottest headlines, but about building a solid foundation.
VS
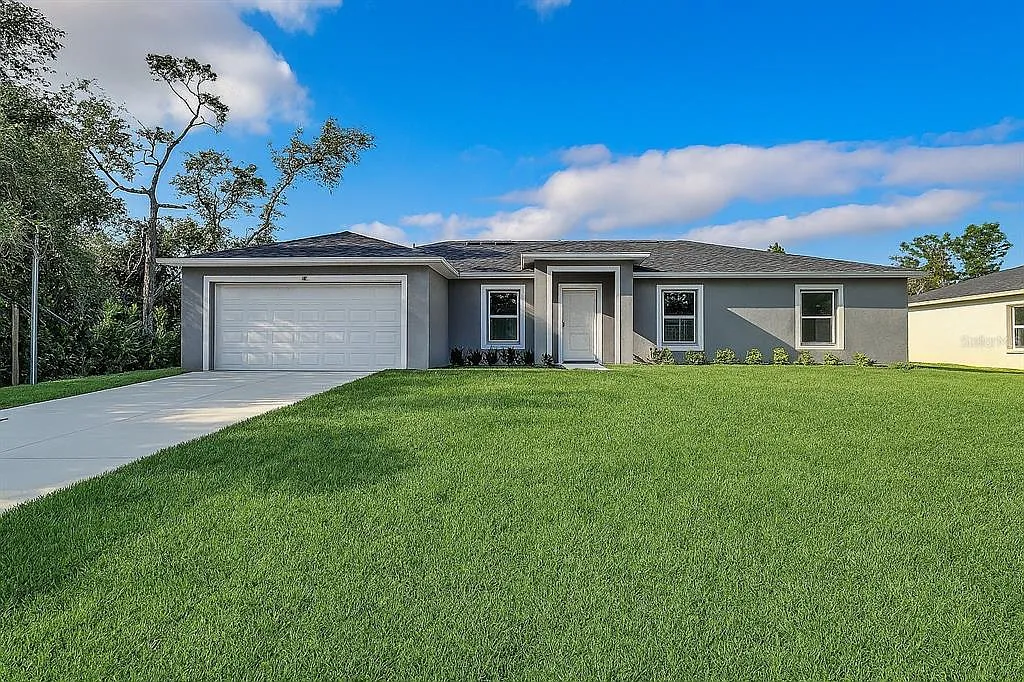
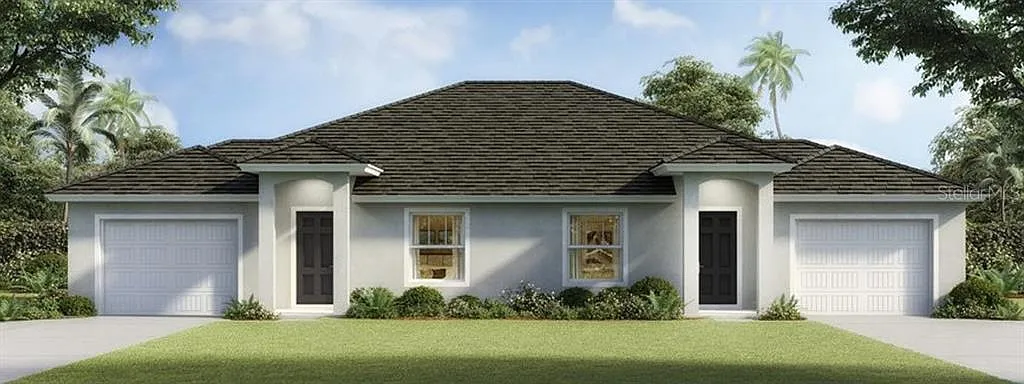
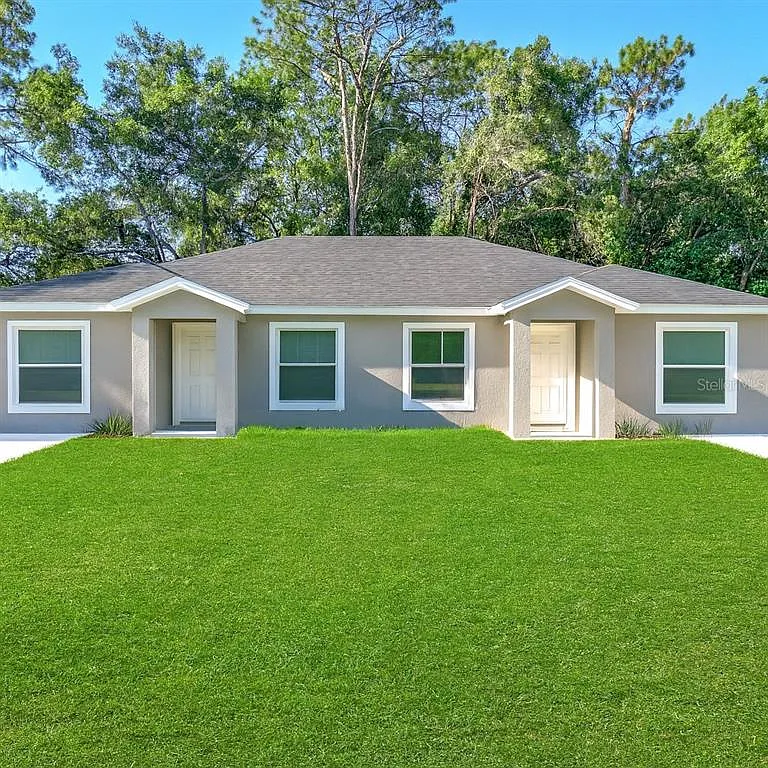
Georgia’s affordable rental with higher cap rate vs Florida’s A‑rated property with stability. Which fits YOUR investment strategy?
We have much more inventory available than what you see on our website – Let us know about your requirement.
📈 Choose Your Winner & Contact Us Today!
Speak to a Norada Investment Counselor (No Obligation):
(800) 611-3060
Download Your FREE Guide to Passive Real Estate Wealth
Real estate investing has created more millionaires than any other path—and this guide shows you how to start or scale with turnkey rental properties.
Inside, you’ll learn how to analyze cash flow and returns, choose the best markets, and secure income-generating deals—perfect for building long-term wealth with minimal hassle.
🔥 FREE DOWNLOAD AVAILABLE NOW! 🔥
Want Stronger Returns? Invest Where the Housing Market’s Growing
Turnkey rental properties in fast-growing housing markets offer a powerful way to generate passive income with minimal hassle.
Work with Norada Real Estate to find stable, cash-flowing markets beyond the bubble zones—so you can build wealth without the risks of ultra-competitive areas.
🔥 HOT NEW LISTINGS JUST ADDED! 🔥
Speak to a Norada Investment Counselor today (No Obligation):
(800) 611-3060
Recommended Read:
- Should You Invest in the Austin or Raleigh Real Estate Market in 2026?
- Dallas vs. Houston: Which City Offers Better Returns for Real Estate Investors
- Single-Family vs. Townhome: Which is the Real Cash Flow Winner for Investors?
- 5 Hottest Florida and Texas Markets for Real Estate Investors in 2025
- Best Places to Invest in Real Estate: November 2024 Hotspots
- How to Secure Your Retirement With Cash-Flowing Rental Properties
- Best Places to Invest in Single-Family Rental Properties in 2025
- 5 Hottest Real Estate Markets for Buyers & Investors in 2025