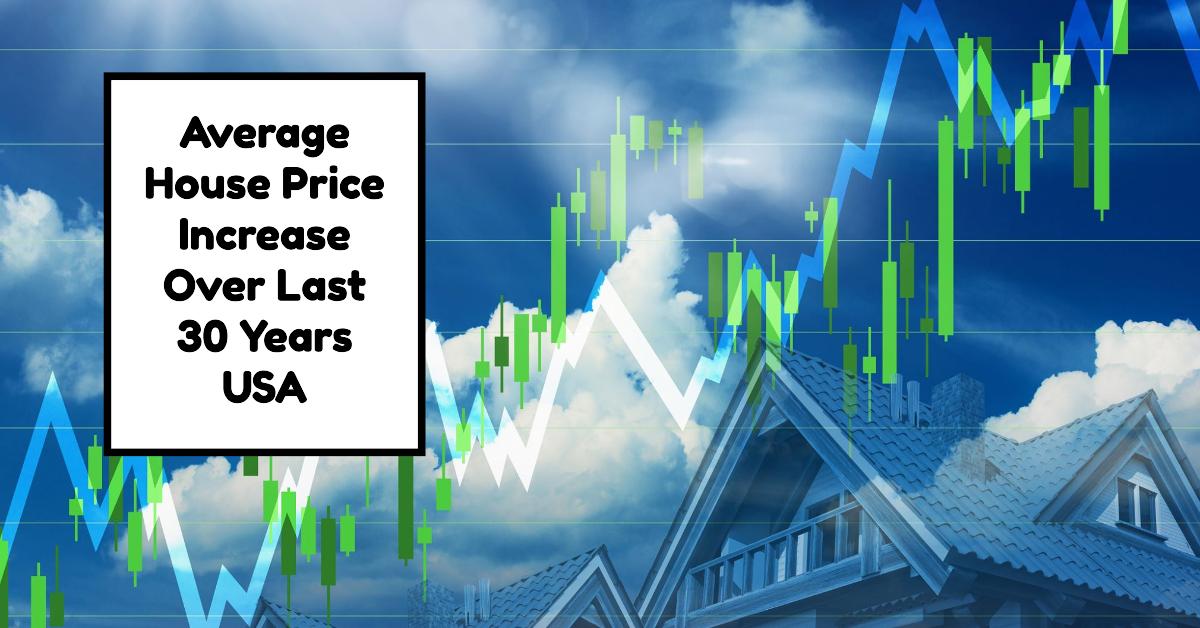
When it comes to the average house price increase over the last 30 years, one thing is clear: the numbers have skyrocketed. We're not talking about a little jump; they've shot up by hundreds of percentage points, even after you account for inflation making things more expensive overall.
This isn't just some boring statistic. It's a big deal caused by a bunch of different things, like how the economy's doing, what's going on in society, and even political stuff – all of which affect the housing market. So why did this happen, and what does it mean for people who want to buy a house someday?
Let's dive in and uncover the reasons behind these crazy high prices and see how they impact everyone, from the entire economy down to what it means for you and me.
The Evolution of House Prices Over the Last 30 Years
Ask any homeowner or potential buyer about the current state of house prices, and you might hear tales of bidding wars, escalating costs, and heartbreaks over missed opportunities. Over the past three decades, housing prices have taken off, leaving many to wonder what has driven such massive growth. The average house price increase over the last 30 years is not just a statistic; it’s a reflection of numerous economic shifts, demographic changes, and policy decisions that have converged to transform the housing landscape in America.
Historical Context: Tracking the 30-Year Climb
To fully grasp the scope of how house prices have evolved, we must consider historical data. From 1994 to 2024, the U.S. House Price Index has demonstrated a compelling upward trajectory. According to data, the index averaged an impressive annual growth of 4.63% between 1992 and 2024, with an astonishing peak at 19.10% in July 2021 (Trading Economics).
Several pivotal moments marked this climb:
- Economic Resilience: After the recession of the early 1990s, the U.S. experienced significant economic growth, fueled by technological advancements and globalization. This progress instilled consumer confidence and drove people toward homeownership.
- Inflation: Inflation is a powerful force that affects purchasing power. Over the last 30 years, inflation has caused shifts in purchasing trends, especially in housing. For example, the Case-Shiller U.S. National Home Price index reported an increase of 18.6% over a singular year in 2021, the highest in recorded history (White House CEA).
- Interest Rates: Perhaps one of the largest contributions to the increase in house prices was the unprecedented low-interest rates offered in the early 2020s, spurred by the Federal Reserve’s efforts to boost the economy during the COVID-19 pandemic. With cheaper loans, more potential homeowners entered the market, pushing demand—and consequently prices—upwards.
The 2008 Financial Crisis: A Temporary Setback
It’s essential to highlight the 2008 financial crisis, a significant event that momentarily halted the meteoric rise of housing prices. The bubble burst due to irrational lending practices, leading to widespread foreclosures. Home prices plummeted by nearly 30% from their peak before beginning the slow recovery that would eventually drive prices to new heights.
By 2012, home prices began to rebound, initiating a long recovery process driven by low inventory levels and a growing demand for housing. According to Freddie Mac, home price growth began accelerating between 2012 and 2018, setting the foundation for what many would refer to as a housing boom.
Regional Variations: Different Markets, Different Stories
While the national average offers one narrative, local markets tell another. Certain metropolitan areas have experienced greater increases than others over this period. For instance, Denver leads U.S. metropolitan areas, having witnessed substantial increases in property valuations (St. Louis Fed).
Why such disparity?
- Local Economies: Cities with booming job markets, like San Francisco and Austin, experienced increased housing demand, resulting in surging prices. The average home price in San Francisco has reached nearly nine times the average earnings in the area as of 2022, reflecting a significant affordability crisis.
- Geographic Limitations: Areas with geographical restrictions, such as coastal cities or mountainous regions, often face supply issues that further exacerbate price increases.
- Urban vs. Suburban Shifts: The COVID-19 pandemic prompted a significant shift in preferences, with many people seeking homes outside the bustling city centers. This trend spurred a bomb in suburban real estate activity, further complicating the average price increase narrative.
The Impact of Demographics: Buyers vs. Renters
As we observe the average house price increase over the last 30 years, it's crucial to discuss demographic shifts. The Millennial generation, one of the largest cohorts in U.S. history, has started entering the housing market in substantial numbers. Their preferences differ from previous generations, leaning towards smaller, urban living spaces instead of sprawling single-family homes.
However, facing staggering house prices, many Millennials have been pushed into the rental market, creating further pressure on rental prices. According to reports, rental prices have also soared dramatically, increasing by nearly 30% in certain areas. This scenario creates a feedback loop—high prices might prevent buyers from entering the market, sustaining demand for rental properties and subsequently affecting rent prices.
Global Comparison: How Does the U.S. Measure Up?
When reflecting on the average house price increase over the last 30 years, it's insightful to see how the U.S. compares globally. Countries like the UK have seen similar trends in house price inflation, but the pace and magnitude can vary. As of 2022, the average house in the UK costs around nine times the average earnings (Schroders UK).
The factors that influence housing markets across the globe, such as interest rates, local demand, and shifts in consumer behavior, are often interconnected. The U.S. market tends to react quickly to international economic events and trends, which further complicates a clear understanding of housing prices.
Future Outlook: What Lies Ahead?
With this breathtaking growth trajectory in house prices, many wonder whether a slowdown is imminent. Current economic markers and policy interventions may reveal answers.
- Economic Predictions: Experts predict a tempering of the rapid demand for housing, influenced by rising interest rates and cooling economic conditions. However, the ongoing scarcity of housing inventory could continue to inflate prices, rendering predictions complex.
- Government Interventions: Potential changes to policy may aim to stabilize the market. Tax incentives or public housing initiatives could reshape dynamics, allowing more individuals to enter homeownership.
- Sustainability Concerns: The focus on sustainability has begun to change homeowner priorities. Energy-efficient homes or those with lower carbon footprints might attract higher prices in the future, shifting what constitutes a “desirable” home.
Conclusion:
If you're a future buyer watching prices climb, being informed is essential. The housing market is cyclical, marked by periods of feverish growth followed by corrections. While the average house price increase over the last 30 years reveals significant economic insights, ultimately, it’s a reminder of the complicated dynamics that govern real estate. By understanding these patterns, you can navigate through these intriguing times ahead and make educated decisions.
Reflecting on the last three decades, themes of resilience, innovation, and adaptability come to the forefront. The data shows that while past trends will influence the future, emerging patterns in buyer behavior and global economics will continually reshape the real estate landscape.
Related Articles:
- Average House Price in 1950 (Compared to Today)
- What Will the Average House Price Be in 2040: Predictions
- Average Cost of a House in 1970, 1990, and 2000
- Average Cost of a House in 1980
- Average Housing Prices by Year in the United States
- Average Home Value Increase Per Year, 5 Years, 10 Years
- Average Home Appreciation Over 30 Years: How to Calculate?
- House Price Graph Last 20 Years USA
- Housing Market Graph 50 Years: Showing Price Growth


