Norada Real Estate Investments

  • Home
  • Markets
  • Properties
  • Notes
  • Membership
  • Podcast
  • Learn
  • About
  • Contact

NYC Housing Market: Prices, Trends & Forecast 2022-2023

January 28, 2023 by Marco Santarelli

NYC Housing Market

Here are the latest trends in the NYC real estate market as well as the statewide market. A prolonged scarcity of properties on the market, along with high prices and high mortgage rates, continues to impede the New York housing market. According to the housing report released by the New York State Association of REALTORS®, the number of properties for sale declined for the 37th straight month in year-over-year comparisons, while mortgage rates remain more than double what they were at this time last year.

The number of available properties for sale fell by 12%, from 40,321 in November 2021 to 36,490 this month. In year-over-year comparisons, the months' supply of dwellings stayed unchanged at 3.2 months. Months' supply is the number of months it would take to sell the present inventory of homes at the current sales rate. A balanced market has a supply of six to six and a half months.

Closed sales fell to 10,101 in November 2022, compared to 13,120 in November 2021, reflecting a 23% reduction in year-over-year comparisons. Pending sales fell 22.4 percent from 11,874 units in November 2018 to 9,214 dwellings in November 2022. New listings fell to 9,694 in November 2021, an 18.2 percent decrease from the 11,846 available in November 2021.

Pending Sales decreased 22.4 percent to 9,214. The median sales price of homes inched higher once again in November, rising from $365,000 in November 2021 to $375,000 last month, marking a 2.7 percent increase. The housing affordability index decreased by 32.1%% to 89 as compared to November of last year when it was 131. An index of 120 means the median household income is 120% of what is necessary to qualify for the median-priced home under prevailing interest rates. A higher number means greater affordability.

New York Real Estate Market Trends
Source: NYSAR.com

The New York resale housing market (statewide data) slowed down in the third quarter of 2022 as increasing inflation and soaring mortgage interest rates finally caught up with most market players. Many buyers looking to purchase a home have lost eligibility for a mortgage or are unable to purchase a home in the present economic situation, resulting in a precipitous decline in buyer interest. The Housing Affordability Index in New York dropped by 25.6% QoQ to 93. A higher number means greater affordability. As borrowing costs continue to rise, many buyers and sellers are choosing to wait while the market resets before making their next move.

  • Pending Sales in New York State were down 9.8 percent to 37,292.
  • They are considered a forward-looking indicator of home sales based on contract signings
  • Closed Sales decreased 10.9 percent to 38,743.
  • Inventory shrunk 14.4 percent to 39,370 units.
  • Prices gazed upward as the Median Sales Price was up 5 percent to $400,000.
  • The average sales price was up 6.2 percent to $530,937.
  • Sellers received, on average, 102.5% percent of their original list price at sale, a year-over-year improvement of 0.5 percent.
  • Days on the Market decreased by 10.9 percent to 41 days.
  • Months Supply of Inventory was down 8.3 percent to 3.3 months.

NYC Real Estate Market: Are Home Prices Dropping?

NYC home prices are trending down as compared to last year. Realtor.com's latest data shows that NYC was a buyer's real estate market in November as it had a total sales to total listings ratio below 0.12 which tends to favor buyers. In other words, the supply of homes is greater than the demand for homes.

  • The median list price of homes in New York, NY was $749K, trending down 14.9% year-over-year.
  • The median listing price per square foot was $653.
  • The median sale price was $664,000.
  • The sale-to-List Price Ratio was 97.66% — homes sold for approximately the asking price on average.
  • A buyer would prefer a sale-to-list price ratio closer to 90%, whereas a seller would always prefer scenarios that yield a ratio of 100% or higher.
  • The median days on market (134 days) in New York City have increased somewhat over the past month and decreased slightly over the last year.
  • Tribeca is the most expensive neighborhood, with a median listing price of $4.1M.
  • Riverdale has a median listing price of $360,000, making it the most affordable neighborhood in New York.

Let us now look at the most recent trends in the New York City real estate market. New York has also been one of the hardest hit by the COVID-19 pandemic, with the highest job losses among the country's major metropolitan areas. It has been recovering from the economic effects of the pandemic.

Let's discuss some more interesting trends. According to StreetEasy data, NYC home prices will fall but don’t expect a collapse in 2023. The StreetEasy Market Reports are a monthly overview of the Manhattan, Brooklyn, and Queens sales and rental markets. Early December mortgage rates dipped below 6.5%, from 7% in early November.

Based on normal sale prices in NYC in November ($622,000) and assuming a 20% down payment, buyers who can stay in the market will see an almost $50,000 rise in their home-buying budget. Preapproval from lenders is a critical stage in the home-buying process for people who can afford financing expenses and monthly payments.

Their latest data shows that sales inventory is now rebounding as listings are sitting on the market for longer and more buyers wait on the sidelines. In November, new listings plummeted 16.7% year-over-year, putting pressure on a limited inventory. 35% fewer NYC homes went into contract compared to one year ago.

11.7% of active listings on StreetEasy cut asking prices in November, up slightly by 2.1 percentage points from one year ago. It took 75 days for an average listing to go under contract, which was 11 days longer than a year earlier when buyer interest was strong. The most recent time a typical listing was on the market for 75 days was November 2019, when 11.5% of for-sale listings reduced asking prices. Between 2013 and 2018, only 8.2% of listings offered price cuts in November, on average.

Manhattan asking prices rose despite price cuts and longer listings. November's median asking price was $1.575M, the highest since January 2020. The StreetEasy Price Index shows that the average Manhattan home sale price has been stagnant since August 2022, when it reached its highest position since the epidemic.

November was 0.5% below August's record at $1.1M. The continual influx of higher-priced new listings pushed up median asking prices, which are sensitive to inventory variations. In November, the typical asking price of newly listed Manhattan houses was $1.4M, up 6% year-over-year. Higher mortgage prices have priced out many Brooklyn buyers, resulting in 34.8% fewer contracts in November than last year.

13% of listings lowered asking prices, a 2.9% rise from November 2021. For-sale inventory continued to drop in Brooklyn, limiting the options for buyers who remained in the market. Inventory fell 8.2% year-over-year to 4,482 in November, and the number of new listings entering the market fell 13.9% year-over-year. Sale prices were up 2.5% year-over-year to $695,000 in Brooklyn.

Data by Redfin shows that the median sales price of homes (all types) in New York was $800,000 last month, up 0.1% since last year.

  • In September 2022, New York home prices were up .0% compared to last year, selling for a median price of $800K.
  • On average, homes in New York sell after 54 days on the market compared to 58 days last year.
  • There were 3,185 homes sold in September this year, down from 3,815 last year.
  • The average sale price per square foot in New York is $617, down 4.8% since last year.

New York Migration & Relocation Trends

  • In Jul '22 – Sep '22, 27% of New York homebuyers searched to move out of New York, while 73% looked to stay within the metropolitan area.
  • Across the nation, 3% of homebuyers searched to move into New York from outside metros.
  • Philadelphia homebuyers searched to move into New York more than any other metro followed by Boston and Los Angeles.
  • 73% of New York homebuyers searched to stay within the New York metropolitan area.
  • Miami was the most popular destination among New York homebuyers followed by Philadelphia and Los Angeles.

NYC Real Estate Market Forecast 2023

Among metropolitan areas, the New York City metro remains the country’s largest real estate market by value, but by a narrowing margin. The NYC-area housing market is valued at $3.51 trillion, with the Los Angeles metro right behind at $3.27 trillion, according to a report published by Zillow.

What are the New York City real estate market predictions for 2023? New York City has a track record of being one of the best long-term real estate investments in the U.S. The New York real estate market has been booming year over year. NYC home prices nearly doubled over the last decade. With supply and demand continuing to favor sellers, prices continue to rise year over year.

According to NeighborhoodScout's data, the cumulative appreciation rate over the ten years has been 77.08%, which ranks in the top 40% nationwide. This equates to an annual average real estate appreciation rate of 5.88%. Despite the pandemic drastically affecting the New York real estate market, during the period between 2021 Q2 – 2022 Q2, New York's appreciation rate has been 10.54%. In the latest quarter tracked by NeighborhoodScout's data (2022 Q1 – 2022 Q2), they show that house appreciation rates in New York were at 0.91%, which equates to an annual appreciation rate of 3.71%.

According to StreetEast's forecast, due to the higher cost of renting and elevated inflation, renter demand will continue to cool in 2023, pushing down asking rents. This relief in rent prices, however, will be slow to come by due to a limited inventory of rental units. Priced-out buyers may stay in the rental market until 2023's spring purchasing season, keeping rents high.

Despite record-high rates and possible annual savings of $14,500 from roommates, NYC renters are prepared to pay more to avoid having roommates, according to their research. All of this suggests the rental market may cool off more slowly, despite reduced affordability. NYC homeowners will be better prepared for a possible recession.

NYC will continue to see an influx of new residents. Despite high rents, StreetEasy search data suggests the city continues to draw interest from potential new residents wishing to move from other areas. The strong demand in NYC rentals from outside the city, despite lower affordability, coincides with the city's impressive recovery, which had restored 97% of the employment lost during the epidemic by September of this year, according to an analysis by the NYC Office of the Comptroller.

According to a Black Knight Mortgage Report, the mortgage delinquency rate in New York state was 2.7% in September of this year, matching the historically low national rate of 2.8%. Only 0.4% of borrowers in the greater NYC area have negative equity, indicating that New Yorkers are well prepared to weather a potential economic crisis.

Let us look at the price trends recorded by Zillow over the past few years. The current typical home value of homes in NYC is $783,799 (ZHVI). In Nov 2021, the typical value of homes in NYC was around $737,871. NYC home values have gone up 6.2% since last November.

  • Typical Home Value: $783,799 (November 30, 2022)
  • 1-year Value Change: +6.2%
  • 70 Median days to pending.
  • 0.983 Median sale-to-list ratio
  • 22.4% Percent of sales over list price
  • 63.2% Percent of sales under list price

Here's Zillow’s housing market forecast for New York-Newark-Jersey City Metro. The Fed will likely keep interest rates elevated through much of next year which will lead to a decline in the prices over the next 12 months. Buyers are regaining negotiation leverage, but seller reluctance will keep the balance of power from shifting completely in favor of buyers next year.

  • New York-Newark-Jersey City Metro home values have risen by 8.4% to $617,629.
  • The New York Metro housing market forecast ending November 2033 is negative.
  • Zillow predicts that New York Metro home values may decline by 3% by November 2023.
  • If this forecast is correct, New York Metro home prices will be lower in the 3rd Quarter of 2023 than they were in the 3rd Quarter of 2022.
NYC Real Estate Market Forecast
Source: Zillow

New York's Recovery From The Pandemic

Changes in house prices, rents, and mortgage interest rates can affect households' income and wealth, as well as how much money they spend and on what. Housing costs and policies can also shape where people chose to live, work, and study, as well as their ability to move or change jobs. Rising house prices, by discouraging potential migrants, could significantly reduce the growth potential of the economy, shifting the balance of labor market growth from employment to wages, with a consequent deterioration in competitiveness.

When it comes to the job market and real estate, the relationship is generally correlative: when one rises, so does the other, and when one falls, so does the other. According to preliminary figures released on October 20, 2022, by the New York State Department of Labor, New York State’s seasonally adjusted unemployment rate increased from 4.3% in July to 4.7% in August 2022. From September 2021 to September 2022, the unemployment rate (not seasonally adjusted) fell from 5.7% to 3.9%.

The number of private sector jobs in New York State increased over the month by 17,400, or 0.2%, to 8,061,500 in September 2022. The number of private sector jobs in the U.S. also increased by 0.2% in September 2022. New York State's private sector jobs (not seasonally adjusted) increased by 361,400, or 4.7%, over the year in September 2022, which exceeded the 4.2% increase in the number of private sector jobs in the U.S.

On a net basis, the total number of nonfarm jobs in the state increased by 15,600 over the month, while private sector jobs rose by 17,400,
in September 2022. At the same time, the total number of nonfarm jobs in the nation increased by 263,000, while private sector jobs increased by 288,000.

  • New York City’s unemployment rate decreased over the month from 6.6% to 5.6%.
  • Outside of New York City, the unemployment rate increased from 3.2% to 3.3%.
  • The number of unemployed New Yorkers decreased over the month by 39,400, from 445,100 in August to 405,700 in September 2022.
New York Unemployment Rate
Source: New York State Department of Labor

New York Rental Market Report

The Zumper New York City Metro Area Report analyzed active listings across the metro cities to show the most and least expensive cities and cities with the fastest growing rents. The New York one-bedroom median rent was $2,333 last month. New York City was the most expensive market with one-bedrooms priced at $3,790 whereas Newark was the most affordable city with rent at $1,400.

Here are the places where it makes sense to invest in rental properties in the New York City Metro Area. These are the places where the demand for rentals is growing strong in 2023.

The Fastest Growing Cities For Rents in New York City Metro Area (Y/Y%)

  • Jersey City had the fastest growing rent, up 48.7% since this time last year.
  • West New York saw rent climb 40.3%, making it rank as second.
  • Bridgeport was third with rent jumping 25%.

The Fastest Growing Cities For Rents in New York City Metro Area (M/M%)

  • Bayonne had the largest monthly rental growth rate, up 6.3%.
  • Fort Lee rent grew 6.1% last month, making it the second fastest growing.
  • Union City was third with rent climbing 5.4%.
NYC Rental Market Trends
Source: Zumper

Where to Buy a House in NYC?

New York is dominated by renter-occupied one or two-bedroom apartments. 76.75% of New York's dwellings are rentals. As per Neigborhoodscout.com, a real estate data provider, one and two-bedroom large apartment complexes are the most common housing units in NYC. Other housing types prevalent in NYC include single-family detached homes, duplexes, rowhouses, and homes converted to apartments.

The New York housing market has affordable townhomes. New York's single-family homes account for just 1.15% of the city’s housing units. During the latest twelve months, the New York real estate did cool off. However, the cumulative appreciation rate over the ten years has been 38.81%, which ranks in the top 30% nationwide. Evaluate the specifics of the NYC housing market at the time you intend to purchase. Hiring a local property management company can help in finding tenants for your investment property in NYC.

New York City's housing market is one of the most costly and competitive in the country. There are 237 neighborhoods in New York (as per Realtor.com). Tribeca has a median listing price of $3.9M, making it the most expensive neighborhood. Riverdale is the most affordable neighborhood, with a median listing price of $360K.

There are some buyer-friendly neighborhoods in New York City where buyers have a bit more negotiating power in neighborhoods as compared to sellers. Jackson Heights is one of New York City’s most buyer-friendly neighborhoods at the moment with home prices under $700,000. Other buyer-friendly markets with a median sales price below $700,000 include Rego Park, where the median sales price in Oct 2021 was $389K, trending down -by 8.9% year-over-year. The sale-to-list price ratio was 100 percent.

The median list price of homes in Sheepshead Bay was $499K in Oct 2021, trending down -by 5% year-over-year. The sale-to-list price ratio was 97.72 percent. The median list price of homes in East Flatbush was $650K, trending up 8.9% year-over-year. The sale-to-list price ratio was 100 percent. The median list price of homes in Brighton Beach was $569K, trending up 16.4% year-over-year. The sale-to-list price ratio was 97.03 percent.

Buyers have a bit more negotiating power in neighborhoods where the median home price falls between $700,000 and $1 million. In areas like Midtown East, where the median sales price is $872,500. Homes in Midtown East sold for approximately the asking price on average in Oct 2021. The other neighborhoods best for buyers looking to spend between $700,000 and $1 million are Bayside, where the median sales price in Oct 2021 was $720,000 and the sale-to-list price ratio was 99.37 percent; Gravesend ($684,500, 96.98 percent); Flushing ($838,000, 96.38 percent); and Bay Ridge ($499,000, 98.14 percent).

All of this could vary from time to time and can be checked on Realtor.com. Check out some of the best neighborhoods for investing in New York for the long term→ These neighborhoods have been selected from all five boroughs.

If you think of investing in NYC, you have decided on a long-term investment property. Here are the ten neighborhoods in NYC having the highest real estate appreciation rates since 2000—List by Neigborhoodscout.com.

  1. Inwood North
  2. Marble Hill
  3. Washington Heights Southeast
  4. Roosevelt Island
  5. W 115th St / Amsterdam Ave
  6. E 57th St / Madison Ave
  7. Madison Ave / E 52nd St
  8. W 58th St / Grand Army Plz
  9. Tribeca South
  10. W 70th St / Amsterdam Ave

Top Real Estate Estate Markets in New York

Buffalo real estate market

The Buffalo real estate investment offers a surprisingly good deal with low prices and relatively high rental rates. The Buffalo real estate market is dominated by older homes. A majority of homes in the Buffalo housing market were built before World War 2. Interestingly, this also means that many small apartment buildings are designed to serve a population that rented small units close to their jobs.

For example, roughly a third of homes are single-family detached homes, while almost half take the form of small apartment buildings. This creates an excellent opportunity for those in the market for Buffalo rental properties. You could buy a small apartment building with multiple tenants for the cost of a single rental property in a more expensive New York real estate market.

Syracuse real estate market

Syracuse's real estate market offers cheaper property with a higher return on investment and a less hostile legal climate. It is one of the better choices if you want to invest in New York state. Another issue that factors into the equation is the job market. Lots of cities have a great quality of life but almost no one can afford to live there.

The Syracuse housing market ranked 6.3 out of 10 for its job market. That’s better than rural and much of upstate New York. And it is why there is a slow trickle of people moving in to replace those who leave. That’s why the Syracuse real estate market has a net migration of 5 or a stable population. This is in sharp contrast to the depopulation seen in most Rust Belt cities. It also means Syracuse's real estate investment properties will hold their value for the foreseeable future if they don’t appreciate it.

Albany real estate market

Albany is a steadily appreciating real estate market. While it isn’t as famous or hot as NYC, it offers an affordable entry point and a massive pool of perpetual renters. Though it may not be somewhere you want to live, many locals are choosing to stay and make their homes here. And that will continue to drive demand for Albany real estate investment properties as long as they are priced right.

Rochester real estate market

You can also consider Rochester. The Rochester real estate market is stable, offering slow appreciation, affordable properties to outsiders, and good returns. It has strong, long-term potential that is only buoyed if NYC collapses. And this is one of the reasons why being everything the Big Apple isn’t is in your favor.

The Rochester real estate market enjoys a healthy population profile. Roughly a quarter of the population consists of children, and many are likely to remain due to the healthy job market. It also means that the Rochester housing market won’t crash if the job market weakens the way San Francisco collapses whenever the tech bubble bursts. Others choose to remain here because of the low cost of living.


Some of this article's information came from referenced websites. Norada Real Estate Investments provides no explicit or implied claims, warranties, or guarantees that the material is accurate, trustworthy, or current. All information should be validated using the below references. Norada Real Estate Investments does not predict the future US housing market. Buying a rental property needs research, planning, and budgeting. Not all investments are good. Always do research and consult a real estate investment consultant.

References

  • https://www.nysar.com/news/market-data/reports
  • https://www.redfin.com/blog/data-center
  • https://www.zillow.com/new-york-ny/home-values
  • https://www.realtor.com/realestateandhomes-search/New-York_NY/overview
  • https://streeteasy.com/blog/nyc-housing-market-data/
  • https://www.redfin.com/city/30749/NY/New-York/housing-market
  • https://www.elliman.com/corporate-resources/market-reports

Filed Under: Growth Markets, Housing Market Tagged With: New York Housing Market, New York Real Estate, New York Real Estate Market, NYC Housing Market, NYC Housing Prices, NYC Real Estate Market

NYC Housing Market Report: Rent Prices Are Skyrocketting

November 23, 2022 by Marco Santarelli

nyc housing market report

Renters should brace themselves for significant increases in rent prices as we enter the second half of the year. Despite the fact that New York City is swiftly adjusting to a new normal in the aftermath of the pandemic, the NYC rental housing market is hampered by historically low inventory levels. Because of the abnormally tight rental market conditions, rents are anticipated to rise more, at least until the seasonal decline in demand for rentals that occurs after the summer.

Despite continuously improving inventory, landlords are racing to reverse the pandemic discounts they provided, forcing rents to rise. Despite a large increase in the number of people leaving the city throughout the pandemic, the number of persons looking for rental homes has remained continuously high. The removal of rental incentives is yet another sign that landlords remain hopeful about demand. Because of the high rents in Manhattan, many people are eager to relocate to the more affordable neighborhoods of Brooklyn and Queens.

According to a report published by New York Post, the average rental price in Manhattan, Brooklyn, and Queens has risen to a new all-time high. Beginning last month, various factors contributed to the excessive rental market in New York, including a lack of availability, rising mortgage rates, peak season, and the Housing Stability Tenant Protection Act, which was enacted in 2019 and enacted expanded tenant eviction protections. Rising Fed interest rates have pushed would-be home purchasers into the rental market, making an already tight market even tighter.

“People who were thinking about moving somewhere else, let’s say in the suburbs, where mortgage rates are 3.1 percent at the end of December, now they are in fives; that is a significant increase,” Jonathan Miller of Miller Samuel who analyzed the findings told The Post. “So those people who were perhaps looking at that as an option might be sitting put. And sitting puts fewer apartments available. So the irony of this Fed move is while it’s cooling the purchase market, it is putting more pressure on the rental market.”

Douglas Elliman, a real estate agency in New York, has released a report analyzing the median rental pricing across the five boroughs, and it does not appear to be slowing down any time soon.

NYC Housing Market – Rental Report

Manhattan

Average rental price: $5,058; Median: $4,050

The median rental price for Manhattan is now at an average of $4,050, which is $800 over what it was just a year ago, according to the eye-opening June market reports compiled by Douglas Elliman and Miller Samuel. Specifically, the average rental price in Manhattan has reached $5,000 for the first time in Big Apple History. The median rent is the mid-point value of the total price samples. Average rent is the sum of all rents divided by the number of the sample size.

NYC housing market report
Source: New York Post composite

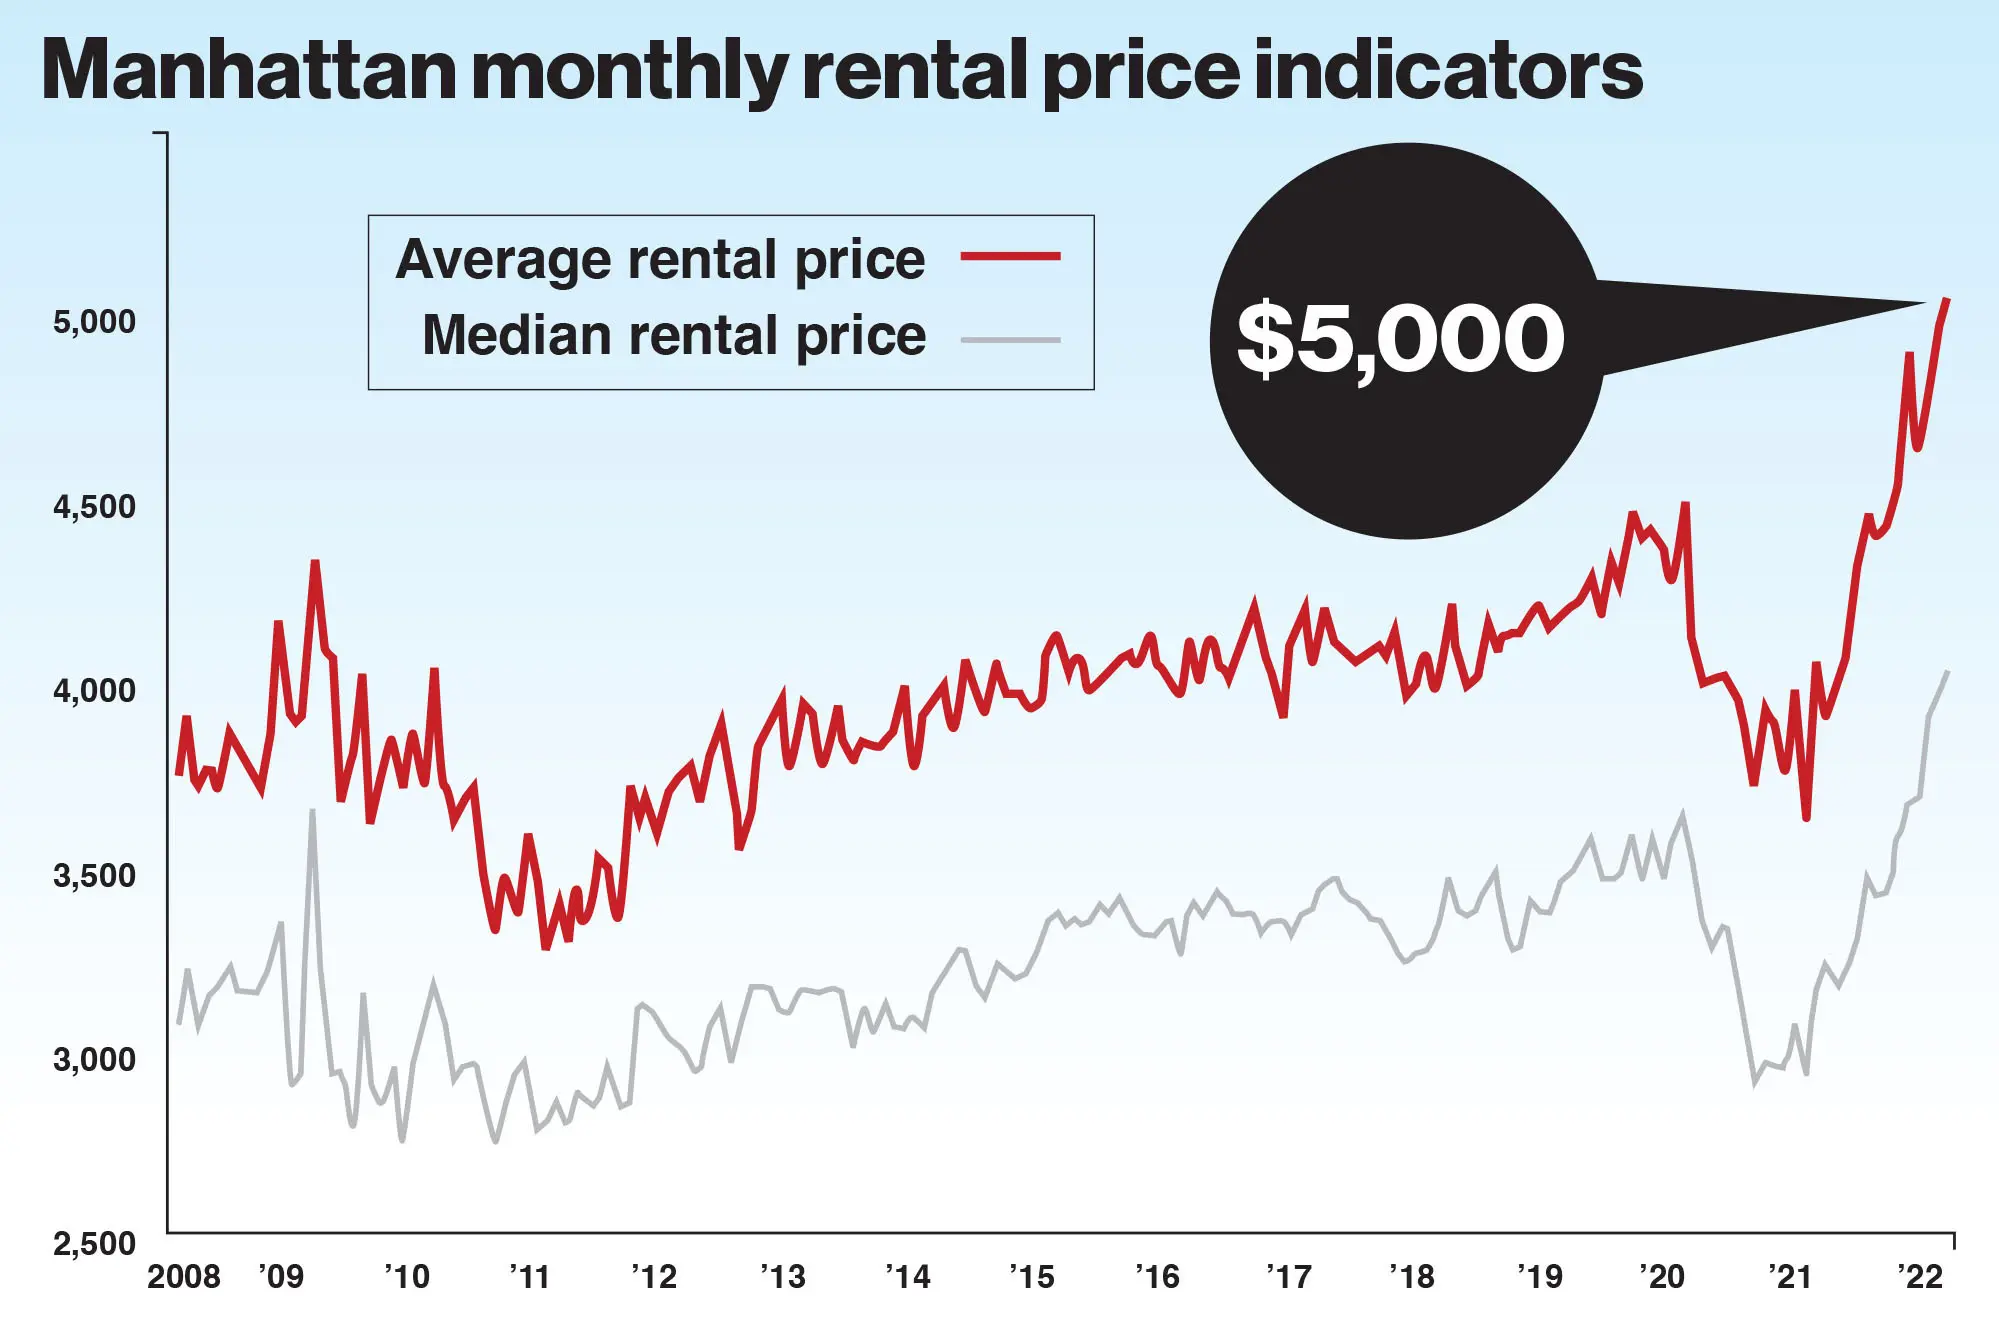
The average rental price of $5,058 indicates that a tenant would spend roughly $61,000 annually on housing alone, as the median rent has set a record for the fifth consecutive month. The number of new leases increased for the fifth consecutive month, and the vacancy rate stayed below 2 percent for the seventh consecutive month. The average rent for a studio apartment is $3,145, while a one-bedroom apartment costs $4,278, and a two-bedroom apartment averages $5,722.

Brooklyn

Average rental price: $3,822; Median: $3,300

Average rental prices in Brooklyn reached $3,822 per month, up about $100 from last month’s average. That marks a new high for the borough for the second straight month. According to Elliman's report, the average monthly rent for a studio is now $2,284. A one-bedroom apartment rents for an average of $3,240, while a two-bedroom apartment costs $4,040.

Last year at this time, the median rent was approximately $500 less, or $2,700 per month. Last summer, studio apartments offered an 11.2% discount, one-bedroom apartments offered a 25.3% discount, and two-bedroom apartments offered a 26.8% discount. Since then, prices have increased between 20 and 50%.

Northwest Queens (Long Island City, Astoria, Sunnyside, Jackson Heights)

Average rental price: $3,352; Median: $2,973

Queens is still the most affordable option when it comes to renting, although prices have risen for the second consecutive month. Monthly rental costs averaged $3,352 with a median of $2,973. In comparison, the median rental price in the Northwest section of Queens was $2,700 at this time last year, roughly $300 less than it is today.

The average monthly rent for a studio is approximately $2,782, according to the most recent research by Elliman. A one-bedroom apartment averages slightly over $3,000 per month, while a two-bedroom apartment costs approximately $4,168 per month. For New Yorkers or those hoping to wait it out, you may have to wait a little longer. If rents hit an affordability barrier beyond which they cannot increase, this does not imply that they decrease; rather, it merely indicates that they do not increase.


Source: https://nypost.com/article/where-nyc-real-estate-rental-market-stands-right-now-housing-prices/

Filed Under: Housing Market Tagged With: NYC Housing Market, NYC Housing Market Report, NYC rent prices, NYC rental market

Real Estate

  • Baltimore
  • Birmingham
  • Cape Coral
  • Charlotte
  • Chicago

Quick Links

  • Markets
  • Membership
  • Notes
  • Contact Us

Blog Posts

  • When is the Best Time to Buy a House?
    March 22, 2023Marco Santarelli
  • 18 Best Real Estate Investing Books For Beginners 2023
    March 22, 2023Marco Santarelli
  • Austin Housing Market: Prices, Trends, Forecast 2023
    March 22, 2023Marco Santarelli

Contact

Norada Real Estate Investments 30251 Golden Lantern, Suite E-261 Laguna Niguel, CA 92677

(949) 218-6668
(800) 611-3060
BBB
  • Terms of Use
  • |
  • Privacy Policy
  • |
  • Testimonials
  • |
  • Suggestions?
  • |
  • Home

Copyright 2018 Norada Real Estate Investments