
If you are thinking about buying a home or refinancing your current mortgage, you might be wondering how interest rates have changed over time and what factors affect them. In this blog post, we will take a look at the historical trends of mortgage rates in the U.S. from 1950 to 2023.
How Have Mortgage Rates Changed by Year Since 1950?
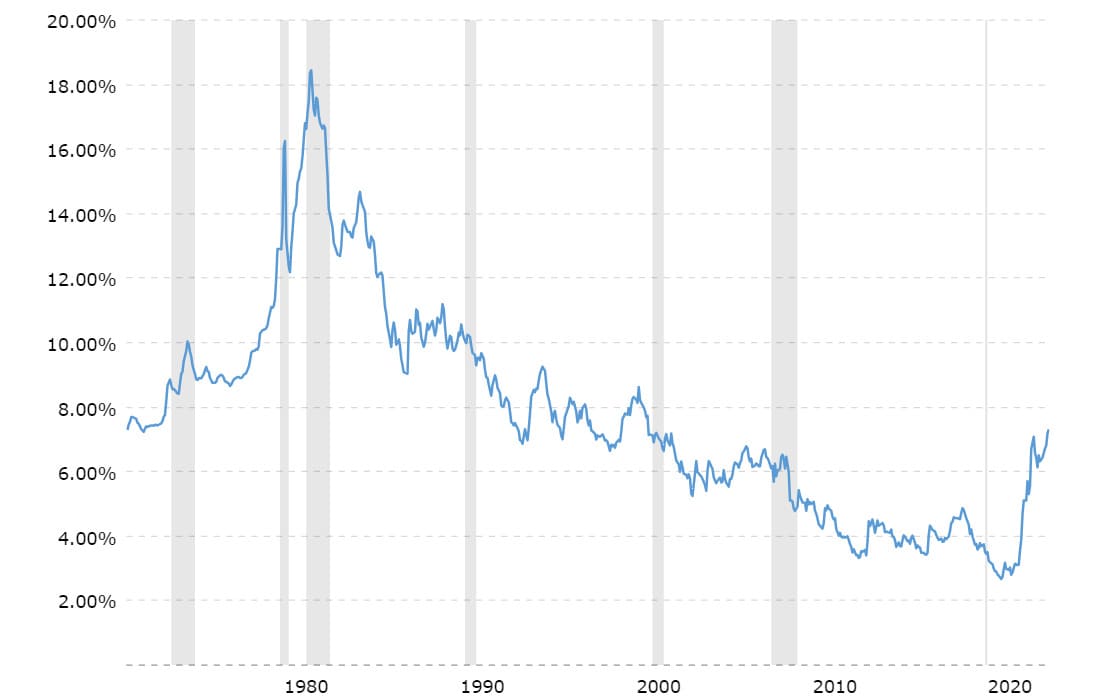
Mortgage rates have fluctuated significantly over time, depending on the changes in the factors mentioned above. According to Freddie Mac's Primary Mortgage Market Survey (PMMS), which tracks the average rates for 30-year fixed-rate mortgages since 1971, mortgage rates have ranged from a record low of 2.65% in January 2021 to a record high of 18.63% in October 1981.
The following chart shows the historical trends of 30-year fixed-rate mortgage rates from 1950 to 2023, based on data from Freddie Mac's PMMS (from 1971 onwards) and Federal Reserve Economic Data (FRED) (from 1950 to 1970).
As you can see from the chart, mortgage rates have gone through several cycles of rising and falling over time, reflecting the changes in the economic and financial conditions.
Historical Mortgage Rate Changes Since 1950
Some of the notable periods of mortgage rate movements include:
The 1950s, when mortgage rates were relatively stable and low, averaged around 4%. This was a period of strong economic growth and low inflation after World War II, supported by government spending on infrastructure, defense, education, and social programs.
The housing market also benefited from favorable policies such as low down payment requirements, long-term amortization schedules, tax deductions for mortgage interest payments, and government-backed mortgage insurance programs.
In the 1960s, mortgage rates started to increase gradually, reaching around 7% by the end of the decade. This was a period of moderate economic growth and rising inflation, driven by increased government spending on social welfare programs, such as Medicare and Medicaid, as well as military spending on the Vietnam War. The housing market also faced some challenges from tighter credit conditions, higher construction costs, and urban unrest.
The 1970s, when mortgage rates soared to double-digit levels, peaking at 12.9% in 1979. This was a period of stagflation, characterized by low economic growth and high inflation, caused by the oil price shocks, the collapse of the Bretton Woods system of fixed exchange rates, and the expansionary monetary and fiscal policies. The housing market also suffered from declining affordability, lower demand, and reduced construction activity.
The 1980s, when mortgage rates reached record highs, hitting 18.63% in 1981, before falling sharply to around 9% by the end of the decade. This was a period of disinflation, marked by a severe recession in the early 1980s, followed by a strong recovery in the mid-to-late 1980s.
The Fed adopted a tight monetary policy to curb inflation, while the government implemented a fiscal policy that combined tax cuts and spending increases. The housing market also experienced a boom-and-bust cycle, with high-interest rates and low affordability in the early 1980s, followed by lower interest rates and higher demand in the mid-to-late 1980s.
The 1990s, when mortgage rates declined steadily, reaching around 6.5% by the end of the decade. This was a period of stable economic growth and low inflation, supported by technological innovations, productivity gains, trade liberalization, and fiscal consolidation. The housing market also enjoyed a sustained expansion, with rising homeownership rates, increasing home values, and robust construction activity.
In the 2000s, the mortgage rates fluctuated within a narrow range of 4.7% to 8.6%, averaging around 6.2% for the decade. This was a period of economic volatility and financial instability, marked by the dot-com bubble and bust in the early 2000s, followed by the housing bubble and bust in the mid-to-late 2000s.
The Fed adopted an accommodative monetary policy to stimulate the economy, while the government implemented various fiscal stimulus measures to mitigate the effects of the recessions.
The housing market also witnessed a dramatic rise and fall, with lax lending standards, speculative demand, and excessive leverage fueling a housing boom in the early-to-mid 2000s, followed by a housing bust in the late 2000s that triggered the global financial crisis.
In the 2010s, the mortgage rates reached historic lows, falling below 3.5% for most of the decade. This was a period of slow economic recovery and low inflation, hampered by the aftermath of the financial crisis, the European debt crisis, the trade war between the U.S. and China, and other geopolitical uncertainties.
The Fed adopted an unconventional monetary policy to support the economy, including quantitative easing (QE), forward guidance, and near-zero interest rates. The housing market also recovered gradually from the crisis, with improving affordability, pent-up demand, limited supply, and favorable demographics boosting home sales and prices.
The 2020s saw the mortgage rates hit an all-time low of 2.65% in January 2021 amid the Covid-19 pandemic, before surging to over 7% in October 2023 amid rising inflation pressures. This was a period of unprecedented economic disruption and policy intervention due to the global health crisis that caused widespread lockdowns, business closures, job losses, and income shocks.
The Fed adopted an emergency monetary policy to provide liquidity and stimulus to the economy, including slashing interest rates to zero, expanding QE programs, launching new lending facilities, and adopting a new framework that allows for higher inflation tolerance.
The government also implemented massive fiscal stimulus measures to provide relief and support to households and businesses affected by the pandemic. The housing market also defied expectations and performed strongly during the pandemic, with record-low interest rates, increased savings rates, shifting preferences for more space and amenities, limited inventory levels, and strong demand from millennials driving home sales and prices to new highs.
How Are Mortgage Rates Determined Over Time?
Mortgage rates are the interest rates that lenders charge borrowers for borrowing money to buy or refinance a home. Mortgage rates are influenced by many factors, such as:
- The Federal Reserve's monetary policy, which affects the supply and demand of money in the economy. The Fed can raise or lower its target for the federal funds rate, which is the interest rate that banks charge each other for overnight loans. This rate affects other short-term interest rates, such as the prime rate and the London Interbank Offered Rate (LIBOR), which are benchmarks for many consumer and business loans, including some mortgages.
- The inflation rate, which measures the change in the prices of goods and services over time. Higher inflation erodes the purchasing power of money and reduces the real return on investments. Lenders demand higher interest rates to compensate for the loss of value of their money over time. Conversely, lower inflation increases the real return on investments and reduces the demand for higher interest rates.
- The economic growth, which reflects the level of activity and income in the economy. Higher economic growth increases the demand for credit and pushes up interest rates, as more people and businesses want to borrow money to invest or spend. Lower economic growth decreases the demand for credit and puts downward pressure on interest rates, as less people and businesses want to borrow money or save more.
- The supply and demand of mortgage-backed securities (MBS), which are bonds that represent pools of mortgages that are sold to investors. MBS are a major source of funding for mortgage lenders, who use the proceeds from selling MBS to make new loans. The price and yield of MBS are determined by the market forces of supply and demand, which depend on factors such as the quality and performance of the underlying mortgages, the expectations of future interest rates and inflation, and the risk appetite of investors.
- The creditworthiness of borrowers, which reflects their ability and willingness to repay their loans. Lenders assess borrowers' creditworthiness based on their income, assets, debts, credit history, and other factors. Borrowers with higher credit scores, lower debt-to-income ratios, larger down payments, and more stable income sources are considered less risky and qualify for lower interest rates. Borrowers with lower credit scores, higher debt-to-income ratios, smaller down payments, and less stable income sources are considered more risky and pay higher interest rates.