Norada Real Estate Investments

  • Home
  • Markets
  • Properties
  • Membership
  • Podcast
  • Learn
  • About
  • Contact

Average Cost of a House in 1980

June 1, 2025 by Marco Santarelli

Average Cost of a House in 1980

Have you ever found yourself pondering the financial decisions your parents or grandparents made when they purchased their first homes? Picture this: it’s the vibrant 1980s, a decade filled with iconic fashion trends like leg warmers and shoulder pads, and music that defined a generation.

This era, marked by economic fluctuations and cultural shifts, had a profound impact on the housing market. Can you believe the average cost of a house in 1980 was $76,375? It's crazy to think about how much things have changed, especially the price of buying a house! We're going to take a fun trip back to the 80s to see what the houses and apartments looked like back then. Get ready for some serious flashbacks!

What Was the Average Cost of a House in 1980?

Setting the Stage: The Economic Vibe of 1980

Before we delve into the specifics of housing costs, it’s essential to understand the broader economic context of 1980. The U.S. economy was grappling with severe inflation, presenting a unique and challenging environment for homebuyers. Picture this scenario: you stroll through the local grocery store, only to observe prices perpetually on the rise. In fact, by 1980, inflation had reached alarming heights, fundamentally altering consumer behavior and economic stability.

  • Inflation Rates: By the end of the 1970s, inflation had jumped to about 13.5%, significantly affecting everyday expenses, from groceries to housing. This created an atmosphere where costs seemed to soar overnight, leading to a cautious approach in major purchases.

The high inflation rates forced many families to rethink their strategies when it came to buying homes. Housing became a necessity in an environment where financial confidence was shaky, affecting everything from the average house price to mortgage approvals.

The Average Cost of a House in 1980: Hold onto Your Hats!

Now, let’s get to the heart of the matter—how much did a typical house actually cost in 1980? According to the Federal Reserve Bank of St. Louis, which has meticulously documented financial trends (source: Federal Reserve Bank of St. Louis), the average sales price of a house in the United States fluctuated significantly throughout the year:

Date Average Sales Price
1980-01-01 $73,600
1980-04-01 $74,400
1980-07-01 $77,500
1980-10-01 $80,000

Can you believe that the average house price just about breached the $80,000 mark by the end of the year? This figure seems startlingly low when compared to contemporary prices, where the cost of entry into the housing market can often exceed $300,000. However, it’s crucial to remember that incomes were considerably lower during this time period, creating a different dynamic in the housing market.


Why Was the Average House Price in 1980 So Different?

There are several key factors that explain why the average cost of a home in 1980 presents such a stark contrast to today’s averages:

  • Inflation: As mentioned earlier, while prices were rising due to inflation, the increase in home prices during the 1980s didn’t match the rapid uptick seen in later decades. Consequently, homes were deemed more affordable relative to income levels at the time.
  • Interest Rates: Here’s a crucial factor that changed the game entirely—mortgage interest rates in 1980 were incredibly high, peaking at over 18% at points during the decade. Imagine taking out a mortgage with such exorbitant rates! The high interest burden significantly impacted what families could afford, creating a challenging environment for potential buyers even though home prices seemed low at face value.
  • Different Housing Market Dynamics: The housing market in 1980 was characterized by a lack of emphasis on luxury and size. Unlike today’s trends, where mini-mansions and high-end amenities are prioritized, homebuyers often focused on affordability and basic comfort. This cultural shift has led to a drastic change in what is perceived as desirable in real estate, influencing demand and price growth in subsequent decades.

A Blast from the Past: What Else Could You Buy in 1980?

To gain perspective on the value of $80,000 in 1980, let’s take a whimsical ride down memory lane and see what delightful purchases were possible:

  • Arcade Games Galore: The 80s were the golden age of arcade gaming! Back when each play of Pac-Man cost only a quarter, your $80,000 could have afforded you an astounding 320,000 game plays!
  • A Fleet of Quirky Cars: The automotive industry saw a surge of colorful, boxy designs in this decade. With the price of a new car ranging from $7,000 to $8,000, you could have bought yourself an entire fleet of flashy vehicles, giving you plenty of style on the road.
  • Denim Dreams: With 1980 being an era dominated by denim, you could stock up on as much fashion as you desired. A pair of jeans cost approximately $30, so with $80,000, you could flaunt a staggering 2,666 pairs of jeans—a wardrobe reflecting the quintessential style of the 80s!

The 1980s Housing Market: A Lesson in Perspective

Reflecting on the average cost of a house in 1980 can be both shocking and enlightening. It serves as a poignant reminder of how much societal values evolve over time, influencing everything from financial choices to lifestyle preferences. The economic landscape, complementary interest rates, and the less glamorous desires in housing have all shifted dramatically.

As you listen to your parents fondly recall “the good old days” of affordable housing, remember that nostalgia often glosses over the complexities of those times. The landscape of homeownership has transformed, presenting new challenges and opportunities. Understanding the past helps us appreciate the progress made and the obstacles that still lie ahead in the ever-changing world of real estate.

Related Articles:

  • Average House Price in 1950 (Compared to Today)
  • Housing Market Graph 50 Years: Showing Price Growth
  • Average Housing Prices by Year in the United States
  • Average Home Value Increase Per Year, 5 Years, 10 Years
  • San Diego Housing Market Graph 50 Years: Analysis and Trends
  • How Much Did Housing Prices Drop in 2008?
  • Housing Market Crash 2008 Explained: Causes and Effects
  • Housing Market Predictions for Next 5 Years
  • Housing Market Predictions for Next Year: Prices to Rise by 4.4%
  • Housing Market Predictions for the Next 4 Years
Filed Under: Housing Market Tagged With: Average Cost of a House, Housing Market

Average Cost of a House in 1970, 1990, and 2000

May 30, 2025 by Marco Santarelli

Average Cost of a House in 1970, 1990, and 2000

Ever wonder what your grandparents paid for their house? The average cost of a house in 1970, 1990, and 2000 tells a fascinating story of how much things have changed. Back then, houses felt cheaper, but salaries were also way lower. Let's dive into this time-traveling adventure and uncover how house prices have skyrocketed over the years!

What Was the Average House Price in 1970?

Groovy Times and Affordable Homes

The data retrieved by FRED from the U.S. Census Bureau and the Department of Housing and Urban Development paints a pretty clear picture. In 1970, the average cost of a house hovered around $27,000. Can you believe it? That's less than the price of a new car today! Remember those bell bottoms and disco balls? Well, they came with a much smaller mortgage payment.

This really highlights how attainable homeownership seemed back then. This stark contrast with today's housing market underscores a significant shift in economic realities. While a average home price in the US now often surpasses $400,000, several factors contributed to the affordability of the 1970s

. Interest rates, while fluctuating, were generally lower than what we've seen in recent decades. Additionally, wages, relative to housing costs, held more purchasing power. A single-income household could often afford a mortgage, a dynamic that's less common today.

Beyond pure economics, the cultural landscape of the 1970s played a role. Houses were, on average, smaller and simpler. The McMansion boom was still decades away, and the emphasis was often on functionality over luxury. This focus on practicality further contributed to lower construction costs and, consequently, lower sale prices.

However, it's important to avoid romanticizing the past. The 1970s also saw economic challenges, including periods of high inflation and unemployment. Furthermore, discriminatory lending practices limited access to homeownership for many minority groups. While the $27,000 price tag seems incredibly low by today's standards, it's essential to consider the broader economic and social context of the era.

Recommended Read:

The Average Cost of a House in 1980

The Average Cost of a House in 1990: A Big Jump

Saying Goodbye to the '80s and Hello to Higher Prices

Fast forward two decades, and the average house price in 1990 had climbed significantly to about $150,000. That's more than five times the 1970 price! Things were changing fast. The economy was booming, and so were housing costs.

I remember starting my career around this time. Buying a house felt like a much bigger deal than it did for my parents. Saving for a down payment was a real challenge!

Several factors contributed to this rapid escalation in housing costs. The economic boom of the late 1980s, while creating job opportunities, also fueled inflation.

Interest rates, though lower than the double-digit peaks of the early '80s, were still relatively high compared to later decades. This combination of rising prices and interest rates meant larger monthly mortgage payments, making homeownership less accessible, especially for first-time buyers.

The changing demographics also played a role. The “baby boomer” generation, now in their prime home-buying years, created increased demand. Coupled with limited housing inventory in certain areas, this demand further pushed prices upward. The “McMansion” phenomenon also emerged during this era, with larger, more amenity-rich homes becoming increasingly popular, driving up the average cost.

Saving for a down payment became a significant hurdle for many young families. Wages hadn't kept pace with the soaring housing costs, making the 20% down payment traditionally required by lenders a daunting prospect. This often meant delaying homeownership or settling for smaller homes in less desirable locations.

The rise in housing costs in 1990 wasn't just a number; it represented a cultural shift. It underscored the growing disparity between incomes and housing affordability, a trend that would continue to shape the housing market in the decades to come.

For my generation, it meant re-evaluating expectations, embracing longer saving periods, and often relying on financial assistance from family to achieve the dream of owning a home. The experience solidified the notion that homeownership, once considered a relatively achievable milestone, was transforming into a significant financial undertaking.

The Average Cost of a House in 2000: Y2K and the Housing Market

A New Millennium, A New Price Tag

By the year 2000, the world had survived the Y2K bug, but homebuyers faced a different kind of scare: the average house price in 2000 hit around $200,000. Again, a huge leap from the previous decade. Technology was advancing rapidly, and the dot-com boom was driving up prices in many areas.

From my own experience, I remember a lot of my friends struggling to afford houses in the early 2000s. Bidding wars were common, and some people felt priced out of the market entirely. It became clear that the days of super-affordable housing were long gone.

It's important to note that the $200,000 figure represents a national average. The actual average cost varied significantly by region. Coastal areas and major metropolitan centers generally experienced higher prices than more rural or inland regions. For example, while the average cost of a house in 2000 might have been $150,000 in the Midwest, it could have easily been double that in California.

The housing market trends of the early 2000s laid the groundwork for the significant price increases seen in the following years.  The year 2000 served as a pivotal point, marking the beginning of a new era in the housing market, one characterized by increasing competition, rising prices, and the challenges faced by potential homebuyers in an increasingly expensive market.

Comparing the Average Cost of a House: 1970, 1990, and 2000

To make it easier to see the changes, let's look at the numbers in a table:

Year Average House Price
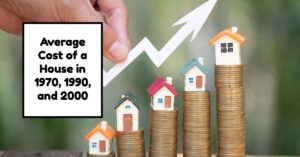
1970 $27,000
1990 $150,000
2000 $200,000

This table really emphasizes how dramatically the average cost of a house increased between 1970 and 2000. This data underscores the rapid growth in the housing market over those 30 years.

Why Did House Prices Change So Much?

Several factors contributed to these price hikes. Inflation, of course, played a role. As the general cost of goods and services went up, so did the price of building materials and labor. Interest rates also fluctuated, influencing how much people could borrow and afford.

But beyond these basic economic factors, there's also the simple issue of supply and demand. As the population grew and more people wanted to own homes, especially in desirable areas, the competition for available houses pushed up prices.

What Does It All Mean?

The average cost of a house in 1970, 1990, and 2000 tells us that the housing market is always changing. While it's fun to look back at “the good old days” of affordable housing, we also have to remember that salaries were lower back then too. Understanding these historical trends helps us appreciate the complexities of the real estate market today. It helps us form realistic expectations about average house prices and how they might change in the future.

Recommended Read:

  • Average House Price in 1950 (Compared to Today)
  • Housing Market Graph 50 Years: Showing Price Growth
  • Average Housing Prices by Year in the United States
  • Average Home Value Increase Per Year, 5 Years, 10 Years
  • San Diego Housing Market Graph 50 Years: Analysis and Trends
  • How Much Did Housing Prices Drop in 2008?
  • Housing Market Crash 2008 Explained: Causes and Effects
  • Housing Market Predictions for Next 5 Years: 2025 to 2029
  • Housing Market Predictions for Next Year: Prices to Rise by 4.4%
  • Housing Market Predictions for the Next 4 Years: 2024 to 2028

Filed Under: Housing Market Tagged With: Average Cost of a House, Housing Market

Average Home Price in San Francisco in 1980

May 30, 2025 by Marco Santarelli

Average Home Price in San Francisco in 1980

San Francisco is known for its high cost of living, but have you ever wondered what the average home price in San Francisco in 1980 was? Today, we often hear jaw-dropping numbers when discussing real estate in this city. But in 1980, buying a home in San Francisco was a whole different story. Surprisingly, home prices back then were much more manageable compared to the astronomical figures we see today. Let’s dive into what the average home price was in 1980 and explore how it compares to today's market.

Average Home Price in San Francisco in 1980

Key Takeaways

  • The average home price in San Francisco in 1980 was approximately $130,000.
  • At the time, San Francisco was not as pricey as it is today, but it was already on the rise.
  • The 1980s marked the beginning of a major boom in real estate that would change San Francisco's housing market forever.
  • Interest rates in the 1980s were significantly higher, around 15-18%, which affected affordability for many homebuyers.
  • Compared to 2024, home prices have skyrocketed by over 1,000% in some neighborhoods.

San Francisco's Real Estate Market in 1980

The average home price in San Francisco in 1980 was around $130,000. To put that into perspective, in 2024, the median home price in San Francisco exceeds $1.4 million. That’s a staggering increase in just over four decades. But back in 1980, despite this relatively modest price tag, homes in San Francisco were already considered somewhat expensive compared to national averages.

At the time, the U.S. was going through significant economic challenges. The inflation rate was high, interest rates were skyrocketing, and this had an impact on housing markets across the country, including San Francisco. High interest rates—sometimes as high as 18%—meant that even though home prices were lower than today, financing a home was a big challenge. Mortgage payments were high, and buyers faced stricter borrowing terms.

In fact, in the 1980s, San Francisco had begun to see the early stages of what would later become its massive tech boom. The Bay Area was still relatively quiet compared to today, but there were hints of change, with tech companies beginning to lay down roots.

Recommended Read:

Average Cost of a House in 1970, 1990, and 2000

How Interest Rates Impacted Housing Affordability

While the average home price in San Francisco in 1980 was more affordable compared to today's standards, it’s important to note that interest rates were much higher. Mortgage rates in 1980 ranged from 15% to 18%. This is drastically different from the low-interest environment of recent years, where rates have hovered around 3-5%.

With an interest rate of 15-18%, buyers in 1980 were paying significantly more in monthly mortgage payments. Even though the average home price was lower, the high rates made it difficult for many people to buy homes. For instance, on a $130,000 home, buyers would have faced monthly mortgage payments of over $1,700—a large sum in 1980.

So, while the price tags on homes might seem affordable in today’s terms, the reality is that high mortgage rates offset the lower prices, making homeownership challenging for many San Franciscans.

What Did $130,000 Buy You in 1980?

The average home price in San Francisco in 1980 was about $130,000, but what kind of home did that buy? Typically, this price could get you a two- or three-bedroom home in some of San Francisco’s well-known neighborhoods, like Noe Valley or Bernal Heights. These were still considered desirable areas even in the 1980s, although nowhere near as competitive as they are today.

San Francisco’s famous Victorian homes, which are a staple of the city’s architectural landscape, could be purchased for prices that seem shockingly low by today's standards. A family-sized Victorian might have sold for under $150,000, offering several bedrooms, a yard, and even a garage—a far cry from the multi-million dollar price tags on these same homes today.

The Tech Boom and Its Impact on Home Prices

While the average home price in San Francisco in 1980 was still within reach for middle-class families, the landscape began to shift dramatically in the following decades. By the late 1990s and early 2000s, the tech industry exploded in the Bay Area, attracting workers from across the country and the world. This tech boom had a massive impact on housing prices, driving demand through the roof.

By the mid-2000s, San Francisco had become one of the priciest real estate markets in the United States. The average home price in San Francisco skyrocketed, and by 2024, it sits at over $1.4 million. The increase in high-paying jobs in tech, combined with limited housing supply, caused a real estate frenzy that continues today.

The Housing Crisis of the 1980s

The 1980s were not just a time of rising interest rates; the decade also saw significant changes in housing policies and practices. In San Francisco, rent control measures were introduced in the late 1970s, and these continued into the 1980s. This limited the rent increases landlords could impose, making it a challenge for them to keep up with inflation.

Homeownership was becoming more of a priority for many people in the 1980s as renting became more expensive and challenging. As a result, even though interest rates were high, many people still wanted to buy homes. San Francisco’s limited housing supply also contributed to a growing housing crunch during this decade.

Comparing 1980 to 2024: A Huge Leap in Home Prices

When comparing the average home price in San Francisco in 1980 to today's prices, the difference is dramatic. In 1980, the average home was around $130,000, but by 2024, that number has ballooned to over $1.4 million. That’s a more than tenfold increase in just over 40 years!

This jump in prices is due to several factors, including the tech boom, increased demand for housing, and a limited supply of homes. San Francisco's geography also plays a role; there simply isn’t much space to build new homes, which has led to a highly competitive market.

It's worth noting that while home prices have soared, incomes have not increased at the same rate. In 1980, a household earning around $30,000 per year could comfortably afford a home in San Francisco. Today, the median household income in San Francisco is around $125,000, but this still falls short of what is needed to buy a median-priced home without significant financial strain.

Final Thoughts on San Francisco's 1980 Home Prices

The average home price in San Francisco in 1980 might seem like a bargain when we look back from 2024, but it's important to consider the full picture. While prices were lower, high interest rates and economic challenges made homeownership a stretch for many families. Today, even though mortgage rates are lower, the astronomical prices put homeownership out of reach for many people, despite rising incomes.

San Francisco has always been a desirable place to live, but the cost of owning a home has changed dramatically over the last few decades. Whether you're reminiscing about the more “affordable” days of 1980 or grappling with today’s sky-high prices, one thing is certain: San Francisco is a city where owning a home is a significant financial commitment, no matter the era.

Recommended Read:

  • Will the San Francisco Housing Market Crash in 2024?
  • Homebuyers Are Leaving San Francisco, New York, and Los Angeles
  • Average House Price in 1950 (Compared to Today)
  • Housing Market Graph 50 Years: Showing Price Growth
  • Average Housing Prices by Year in the United States
  • Average Home Value Increase Per Year, 5 Years, 10 Years
  • San Diego Housing Market Graph 50 Years: Analysis and Trends

Filed Under: Housing Market Tagged With: Average Cost of a House, Housing Market

Real Estate

  • Birmingham
  • Cape Coral
  • Charlotte
  • Chicago

Quick Links

  • Markets
  • Membership
  • Notes
  • Contact Us

Blog Posts

  • Interest Rates Predictions for the Next 2 Years by Goldman Sachs
    July 11, 2025Marco Santarelli
  • Denver Housing Market: Trends and Forecast 2025-2026
    July 10, 2025Marco Santarelli
  • Mortgage Rates Today: The States Offering Lowest Rates – July 10, 2025
    July 10, 2025Marco Santarelli

Contact

Norada Real Estate Investments 30251 Golden Lantern, Suite E-261 Laguna Niguel, CA 92677

(949) 218-6668
(800) 611-3060
BBB
  • Terms of Use
  • |
  • Privacy Policy
  • |
  • Testimonials
  • |
  • Suggestions?
  • |
  • Home

Copyright 2018 Norada Real Estate Investments

Loading...