Despite some bumps in the road, the new home sales trends for 2025 are showing surprising strength, and we're likely to see more sales this year compared to last. Let's dive into what's been happening and what I anticipate for the rest of the year.
New Home Sales Trends in 2025:

New Home Sales Definition
New Home Sales, commonly referred to as “new residential sales,” is an economic indicator that tracks the sale of newly constructed residences. It is extensively watched by investors since it is seen as a lagging signal of real estate market demand and, thus, a factor influencing mortgage rates. Household income, unemployment, and interest rates are all variables that influence it.
The United States Census Bureau releases two versions of the New Home Sales metric: a seasonally adjusted figure and an unadjusted one. The adjusted value is shown as a yearly total, whereas the unadjusted figure is presented as a monthly total. These numbers are provided for several areas and the entire nation.
New home sales are completed when a sales contract or deposit is signed or accepted. In any stage of construction, the home might be: not yet started, in the process of being built or fully finished. About 10% of the US housing market is made up of new house sales. Preliminary numbers for new single-family home sales are subject to major changes because they are mostly based on data from construction permits.
A Spring Surprise: April's Unexpected Boost
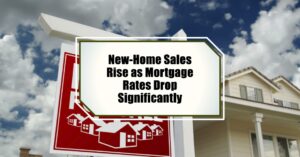
Just when we thought we had a handle on things, the numbers for April 2025 threw us a curveball – in a good way! Across the nation, sales of new single-family homes reached a seasonally adjusted annual rate of 743,000. That's a significant jump of 10.9% from March. What's even more noteworthy is that new home sales are 3.3% higher than they were in April of last year. This tells me that despite the ongoing economic chatter, there's still a good amount of activity in the new construction market.
One interesting point is that this increase wasn't uniform across the country. Every region saw a rise in new home sales except for the Northeast. This regional difference could point to varying local economic conditions or specific market dynamics at play.
The Price Point Puzzle
Now, let's talk about prices. The median price of a new house sold in April was $407,200. While that's still a considerable amount of money, it's actually 2.0% lower than it was a year ago. This decrease, in my opinion, is a key factor driving the sales. With existing home sellers also adjusting their prices, new home builders seem to be recognizing the need to be competitive to attract buyers.
Inventory Insights: Finding a Better Balance
The number of new homes available for sale at the end of April was estimated to be 504,000. At the current sales pace, this represents an 8.1-month supply. This is an improvement from the 9.1-month supply we saw in March and is slightly higher than the 7.7 months in April 2024.
From my perspective, this is a positive sign. A healthier inventory level gives buyers more choices and can ease some of the pressure we've seen in recent years. It also suggests that the frantic pace of the market might be moderating, which could lead to more sustainable growth.
Why the Uptick? Digging Deeper
So, what's fueling this unexpected rise in new home sales? Several factors seem to be at play:
- Lower Mortgage Rates: Even with some economic uncertainties, mortgage rates have been relatively stable, and at times, have dipped slightly. This makes monthly payments more manageable for potential buyers.
- Strategic Price Cuts by Builders: The data clearly shows that more builders are reducing their prices. In April, 29% of builders reported cutting prices, compared to 22% in the same month last year. While the average price reduction remained around 5%, this willingness to adjust prices is definitely attracting buyers.
- Increased Sales Incentives: Builders are also getting creative with incentives. Nearly 61% of builders offered some form of sales incentive in April, up from 57% a year prior. These incentives can range from help with closing costs to offering upgrades, making new homes more appealing.
- Resilient Buyer Demand: Despite economic jitters, there's still a fundamental demand for housing. For many, owning a home remains a key financial and personal goal.
It's interesting to see how builders are adapting to the market. They understand that while there are plenty of people who want to buy, affordability is a major hurdle. By adjusting prices and offering incentives, they're finding ways to bridge that gap.
Builder Confidence: A Note of Caution
While sales are up, it's important to note that builder confidence, as measured by the National Association of Home Builders, remains somewhat low. This suggests that builders are still navigating challenges such as:
- Cost of materials
- Labor shortages
- Uncertainty about future economic conditions
However, the fact that sales are increasing despite this cautious sentiment is encouraging. It indicates that even with their concerns, builders are finding ways to get deals done.
Looking Ahead: My Thoughts on the Rest of 2025
Based on what I'm seeing, I anticipate that the positive momentum in new home sales will likely continue for the remainder of 2025, barring any significant and unexpected economic shocks, like a sharp spike in mortgage rates. Here's why I'm cautiously optimistic:
- Affordability Remains Key: As long as builders continue to be mindful of pricing and offer incentives, they will likely find buyers. The slight decrease in median new home prices is a step in the right direction.
- Inventory Levels: The gradual increase in inventory provides more options for buyers and could lead to a more balanced market. This can prevent the kind of rapid price increases we've seen in the past.
- Receding Recession Fears: While economic uncertainties persist, the more dire predictions of a deep recession seem to have lessened somewhat. This could provide more confidence to both buyers and sellers.
However, it's crucial to remember that the housing market is influenced by many factors, and things can change quickly. Interest rate fluctuations, inflation, and overall economic growth will continue to play a significant role.
The Bottom Line: More New Home Sales in 2025
Considering the recent data and current trends, my informed opinion is that 2025 is on track to see more new home sales than the previous year. The combination of strategic price adjustments by builders, incentives, and a still-present underlying demand for housing is creating a more active market. While challenges remain, the resilience of new home sales in the face of economic headwinds is a noteworthy development.
In summary:
- New home sales in April 2025 saw a significant increase.
- Median new home prices have decreased slightly year-over-year.
- Inventory levels are improving, offering more choices for buyers.
- Builder price cuts and incentives are attracting buyers.
- Despite low builder confidence, sales are trending upwards.
- I anticipate higher new home sales for the full year of 2025 compared to 2024, assuming no major economic disruptions.
New Home Sales Forecast for the Remainder of 2025: What to Expect
Two major factors always loom large in the housing market: mortgage rates and potential tariffs.
- Mortgage Rates: When rates are low, more people can afford to buy homes. This increased demand helps builders sell their inventory. Conversely, high rates can scare away buyers. A potential sweet spot for builders seems to be around the 6% mark. Historically, when mortgage rates stabilize around this level, builder confidence tends to improve.
- Tariffs: The possibility of new tariffs adds another layer of uncertainty. Tariffs can increase the cost of building materials, squeezing builders' profit margins. This naturally makes them more hesitant to start new projects.
What's the Forecast for the Rest of 2025?
Predicting the future is never easy, but based on the current trends, here's my take on what we can expect for the rest of 2025:
- Stable Sales, Moderate Growth: I anticipate new home sales will remain relatively stable, with maybe some moderate growth if mortgage rates cooperate. Don't expect any boom or bust.
- Inventory Management is Key: Builders will remain hyper-focused on managing their inventory. We might see some strategic price adjustments or incentives to move existing homes.
- Housing Permits: Unless we see a significant drop in mortgage rates or some positive news on the tariff front, I don't foresee a major surge in housing permits.
Looking Ahead: My Opinion
Based on my knowledge, expertise, and years of closely watching the housing market, here are some key points to consider:
- The market is in a state of flux: We aren't experiencing the highs of a few years ago, nor the lows of a major crash.
- Builders are adapting: They are becoming more sophisticated in their approach to inventory management and risk assessment.
- External factors play a huge role: Mortgage rates, tariffs, and the overall economic climate will continue to heavily influence the housing market.
Navigating the Housing Market in 2025
So, what does all this mean for you, whether you're a potential homebuyer, a builder, or just curious about the market?
- For Homebuyers: If you're looking to buy, keep a close eye on mortgage rates. A slight dip could open up opportunities. Also, don't be afraid to negotiate – with the current inventory levels, builders might be willing to offer incentives.
- For Builders: Focus on managing your existing inventory and be cautious about starting new projects until the market becomes more stable.
- For Everyone: Stay informed! The housing market is constantly evolving. Keep track of the latest data, trends, and expert opinions to make informed decisions.
In conclusion, while new home sales in early 2025 show a slight increase, the larger picture is one of careful navigation. Builders are focused on managing inventory, and external factors like mortgage rates and tariffs will continue to play a significant role in shaping the market. Stay tuned for more updates as the year progresses.
New Home Sales Trends [Previous Months]
Here's the region-wise tabular data for new home sales from January 2024 to January 2024. The units displayed are in thousands and are the seasonally adjusted annual rate. The data estimates only include new single-family residential structures. Sales of multi-family units are excluded from these statistics.
NORTHEAST: Connecticut, Maine, Massachusetts New Hampshire New Jersey New York Pennsylvania Rhode Island Vermont
MIDWEST: Illinois, Iowa, Indiana, Kansas, Michigan, Minnesota, Missouri, Nebraska North Dakota Wisconsin South Dakota Ohio
SOUTH: West Virginia, Virginia, Texas, Tennessee, South Carolina, Oklahoma, North Carolina, Mississippi, Maryland, Louisiana, Kentucky, Georgia, Florida, Alabama, Delaware, District of Columbia, Arkansas
WEST: Alaska, Arizona, California, Colorado, Hawaii, Idaho, Montana, Nevada, New Mexico, Oregon, Utah, Washington, Wyoming