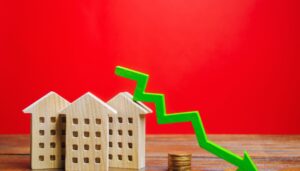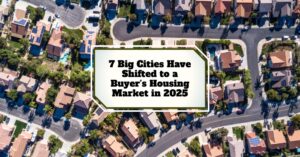
This news likely brings a smile to the faces of many house hunters: seven major cities have officially transitioned into buyer-friendly housing markets in 2025, a significant shift that gives ordinary folks more power when it comes to purchasing a home. If you're looking to buy, this means you might finally have the upper hand after a long period where sellers called all the shots.
For years, we've been talking about how tough it is to buy a house. Prices were through the roof, bidding wars were common, and you had to act lightning fast. But something has changed. The latest data from Realtor.com shows that the national housing market is finally finding a more balanced footing, with a five-month supply of homes for sale. This is the first summer in nine years that the market has hit this level of equilibrium.
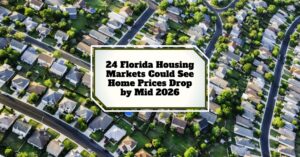
7 Buyer-Friendly Housing Markets in 2025 With Abundant Homes for Sale
Understanding the “Months of Supply”
To really get why this news is important, we need to understand what “months of supply” means. Think of it like this: it's how long it would take to sell every single house currently listed on the market if no new homes were added and sales continued at the same speed.
- Less than 4 months of supply: This is a seller's market. Sellers are in the driver's seat. Homes sell quickly, often with multiple offers, and prices tend to go up.
- 4 to 6 months of supply: This is a balanced market. Both buyers and sellers have a decent amount of say. It’s not a free-for-all, but there are opportunities for negotiation from both sides.
- More than 6 months of supply: This is a buyer's market. Buyers have more choices, more time to make decisions, and a better chance of negotiating prices and terms.
The fact that the national supply has reached five months means we're officially heading into a more neutral zone. But as is often the case with real estate, the big picture doesn't tell the whole story. When we zoom in on specific cities, a much more interesting and complex picture emerges.
Where Buyers Are Winning: The Top Buyer's Markets
While the national trend is encouraging, seven big cities are now firmly in buyer's market territory, meaning they have at least six months of supply. This is where house hunters have the most leverage, though no two markets are exactly alike.
Let's take a closer look at the cities leading this shift:
1. Miami, Florida: Nearly 10 Months of Supply
Miami takes the crown as the city with the highest months of supply among the top 50 metros, boasting nearly 10 months. This means it would take close to ten months to sell everything currently listed at the current sales pace.
Back in June, when this data was collected, the median list price was around $510,000, which was actually down 4.7% from the previous year. And the number of homes available for sale had a big jump of 35% compared to the year before. Homes were also taking longer to sell, with typical listings sitting on the market 15 days longer than the year prior. By August, this trend continued, with median prices dipping slightly and homes taking even longer to find a buyer.
Now, I've been watching the Miami market for a while, and it's always been a bit of a beast. Even with these buyer-friendly numbers, it’s important to understand what’s really going on. You see, some folks, like local real estate agent Ana Bozovic, argue that calling Miami a blanket “buyer's market” isn't the whole truth. She points out that while certain types of homes, like older condos under $500,000, might offer buyers more room to negotiate, other segments are still quite hot.
For instance, she says that single-family homes under $500,000 are almost “extinct” in Miami. So, if you're looking for one of those, you won't have much negotiating power. However, in the sub-$500,000 condo market, buyers might find more opportunities, partly because of new rules that require higher reserves for condos. This really highlights my own experience: real estate is never one-size-fits-all. You've got to know the nitty-gritty of the specific neighborhood and the type of property you're interested in.
2. Austin, Texas: Close to 8 Months of Supply
Austin, a city that experienced incredible growth during the pandemic, is now the second-biggest buyer's market. In June, it had 7.7 months of supply. This means the frenzy has cooled down, and there are significantly more homes on the market than buyers eager to snatch them up at any price.
In Austin, nearly 33% of all listed homes had price cuts in June, with the median listing price dropping by 4.5% to about $524,950. That's a huge number, meaning roughly one out of every three homes for sale came with a discount. The number of available homes also saw a massive increase, nearly 70% higher than pre-pandemic levels. By August, the typical price was just under $500,000, and that high percentage of price reductions continued.
Austin is relatively new to this buyer's market status, only crossing that six-month supply mark in June. This rapid shift is a clear indicator of how quickly market dynamics can change.
3. Orlando, Florida: 6.9 Months of Supply
Another major city in Florida, Orlando, also found itself in buyer's market territory with 6.9 months of supply in June. This aligns with the cooling trends seen in the housing market of the city famous for its theme parks.
In June, the median listing price in Orlando was $429,473, down 3.4% from the previous year. The inventory of homes for sale rose by nearly 34% year-over-year, while the pace of sales slowed. By August, prices dipped even further to $422,694, and homes were staying on the market, on average, 14 days longer. Orlando has been in a buyer's market since January, which shows a sustained shift rather than a temporary blip.
As Realtor.com senior economist Jake Krimmel correctly points out, markets like Miami, Austin, and Orlando have been moving towards buyer-friendly conditions for a while. He notes that the rise in inventory, longer times on market, and increased price reductions are clearly visible in these areas, as well as in much of the South and West of the country. He anticipates these trends might continue, making the upcoming fall season a good time for buyers who are patient and have their finances in order.
Four More Cities Joining the Buyer's Market Club
Beyond these top three, four other major cities are also experiencing conditions that favor buyers:
- New York City, New York: 6.7 months of supply. This might surprise some folks, considering New York's reputation for high prices and a historically tight market. However, Krimmel points out that there are signs of softness beneath the surface. Unlike other parts of the Northeast, New York hasn't seen price surges, and the price per square foot has actually decreased year-over-year recently.
- Jacksonville, Florida: 6.3 months of supply.
- Tampa, Florida: 6.3 months of supply.
- Riverside, California: 6.1 months of supply.
The inclusion of New York City in this list is particularly interesting. It shows that even in traditionally strong seller's markets, economic shifts and changing buyer behavior can create opportunities.
Why Are Sellers Listing and Then Delisting?
This shift to buyer's markets isn't just about more homes being available; it's also about what sellers are doing—or not doing—with their properties. The national housing market saw something of a standstill this summer. With affordability still a concern and mortgage rates remaining elevated, many buyers are hesitant.
This has led to a couple of key behaviors from sellers:
- Price Reductions: Over a quarter of homes for sale across the U.S. had a price cut in August. This is up slightly from the previous year, with buyers in the South and West most likely to find discounted properties.
- Delistings: Frustrated by the lack of buyer interest at their asking prices, some sellers are simply taking their homes off the market. Instead of lowering prices, they're choosing to wait for conditions to improve. In July, the number of delisted homes nationwide jumped a significant 57% compared to the year before. Cities like Miami, Phoenix, Riverside, and Tucson saw the most homes being pulled from the market.
This delisting trend is a double-edged sword. On one hand, it reduces the overall supply, which could eventually put upward pressure on prices. However, for now, it signals that sellers are either unwilling or unable to drop their prices to match current market realities, leading to a stalemate that buyers can often exploit for better deals.
Expert Opinions and My Take
As someone who has followed the housing market for years, I've seen my fair share of cycles. What I'm observing now is a necessary course correction. The post-pandemic boom was driven by a unique set of circumstances – ultra-low interest rates and a surge in demand as people looked for more space. Now, we're seeing a return to more sustainable market conditions.
The data from Realtor.com is crucial because it uses actual sales figures and inventory levels. It’s not just speculation; it’s based on what’s happening on the ground. This shift to buyer's markets in these seven cities is a tangible sign that buyers have more breathing room.
My own experience tells me that when inventory rises and homes sit longer, buyers gain significant negotiation power. They can often ask for concessions, negotiate on price, and avoid the stressful bidding wars that have characterized the market recently. However, as the Miami example shows, informed buyers are the ones who will win. Understanding the nuances of specific neighborhoods and property types is key. Just because a city is labeled a buyer's market doesn't mean every single home is a bargain.
The rise in delistings is also a strong indicator of seller sentiment. When sellers start delisting rather than discounting, it shows how much they are anchoring to previous sale prices or their own perceived value, which may no longer align with what buyers are willing or able to pay. This can, paradoxically, create more opportunities for those buyers who are still actively searching, as they might encounter less competition in the immediate term.
For aspiring homeowners, this is a moment to be strategic. Do your homework on the specific metro areas that interest you. Look at the inventory levels, the typical time on market, and recent price trends. Don't be afraid to negotiate. The days of accepting asking price without question might be fading, at least in these seven cities.
We're moving towards a more balanced housing market overall, but these seven cities are leading the charge toward buyer-friendliness. It's a great time to be a buyer, provided you’re prepared and informed. The market is signaling a change, and those who pay attention will be best positioned to take advantage of it.
Invest in Real Estate in the Top U.S. Markets
Discover high-quality, ready-to-rent properties designed to deliver consistent returns.
Contact Norada today to expand your real estate portfolio with confidence.
Contact our investment counselors (No Obligation):
(800) 611-3060
Also Read:
- The $1 Trillion Club: America's Richest Housing Markets Revealed
- 4 States Dominate as the Riskiest Housing Markets in 2025
- Housing Market Predictions: Home Prices to Drop by 0.9% in 2025
- Housing Market Predictions 2025 by Norada Real Estate
- Housing Market Predictions 2025 by Warren Buffett's Berkshire Hathaway
- Will the Housing Market Crash in 2025: What Experts Predict?
- Housing Market Predictions 2026: Will it Crash or Boom?
- Housing Market Predictions for the Next 4 Years: 2025 to 2029
- Real Estate Forecast: Will Home Prices Bottom Out in 2025?
- Real Estate Forecast Next 5 Years: Top 5 Predictions for Future
- Will Real Estate Rebound in 2025: Top Predictions by Experts
- Real Estate Forecast Next 10 Years: Will Prices Skyrocket?