 California Foreclosure Statistics
With Inland Empire foreclosures at pre-recession lows, Riverside County's foreclosure rate dropped to No. 21 statewide in April. A total 1,403 mortgage default notices, auction sale notices and bank repossessions were recorded in April, meaning 1 in 566 households was in some stage of foreclosure, according to Irvine-based RealtyTrac.
Of those, 45 were from Palm Desert, according to data provided by the organization to Palm Desert Patch. In Palm Desert:
- One out of every 538 households received a foreclosure filing in April
- That number was down by about 25% from March 2013, and down 55% from last April.
- In April 2012, 100 households had been in default.
 In Shelby County, there were 1,030 total foreclosures in the first quarter this year, according to real estate information company
  Hundreds of thousands of homes in the US are now labeled as “zombie” foreclosures. That's when the owner of a foreclosed home leaves only to find out years later that he or she still legally owns the home and is on the hook for property taxes and other fees. Such cases occur in more than a third of foreclosures, industry figures show.
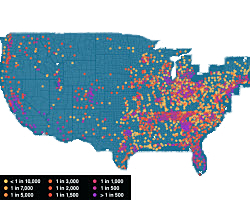 We've all heard that the housing bubble's pop led to thousands of foreclosures, but its interactive maps like this that really show how prevalent the problem was — and still is. Part of a project on 30 election issues, the map below uses data from RealtyTrac to display foreclosure rates by county.
 After nine consecutive months of appreciation, August was the first month where home values decreased by 0.1% to $152,100, according to Zillow.
 Sales of Freddie Mac REO homes took a dip in 3Q11 compared to the first two quarters of the year as nonperforming loans surged consistently over the previous quarter.
 It is an out-of-favor asset class that has attracted the attention of David Ackman, a hedge fund manager with a fondness for contrarian investments. “The best investments we've made are the ones no one else would touch,” Ackman explains. That's why he's so hot on Single Family Home Rental Property. They are cheap, he says. They are a buy.
