Planning to buy or sell a home between now and the end of the decade? The latest housing data points to a market that’s stabilizing rather than swinging wildly. Most forecasts suggest steady but modest home-price growth, with clear differences emerging by region and buyer profile. Optimism remains in some markets, while others are entering a more cautious phase.
Housing Market Predictions for 2026–2029
Despite headlines warning of either a crash or another surge, the reality looks far more measured. Housing trends over the next four years will be shaped by interest-rate policy, labor-market strength, affordability pressures, and broader economic conditions. To cut through the noise, analysts are leaning on forward-looking data such as Fannie Mae’s Home Price Expectations Survey (HPES), which aggregates forecasts from economists who track the housing market full-time.
For buyers, these projections suggest that waiting for a dramatic nationwide price drop may not pay off. For sellers, they indicate that home values are likely to remain resilient, with gradual appreciation rather than rapid gains. Understanding these expectations now can help both sides make better-timed decisions as the market moves through 2026, 2027, 2028, and 2029.
The Big Picture: What the Experts Are Saying
Fannie Mae's latest survey, from Q3 2025, gives us a snapshot of what the brightest minds in the real estate world are predicting for home price growth. They surveyed a panel of experts and asked them to weigh in on where they see prices heading.
Here’s a breakdown of the average annual home price growth expectations from that survey:
- 2025: 2.4%
- 2026: 2.1%
- 2027: 2.9%
Now, these numbers might seem small compared to the eye-popping figures we saw in recent years, but that’s exactly what makes them so important. This indicates a return to a more normal, sustainable growth pattern.
My thoughts on these numbers: This isn't a prediction of a market crash, nor is it a runaway rocket ship. It’s a sign of a maturing market. After a period of incredibly rapid price increases, partly fueled by low interest rates and a surge in demand, the market is settling down. Think of it like a runner who’s just sprinted a marathon; they’re going to slow down to a steady jog to conserve energy and maintain their pace.
Looking Beyond the Average: The Optimists vs. The Pessimists
What makes the Fannie Mae survey even more insightful is that it doesn't just give us one single prediction. It breaks down expectations into different viewpoints: the “Optimists” and the “Pessimists.” This is crucial because it shows us the range of what people think could happen, and where the biggest uncertainties lie.
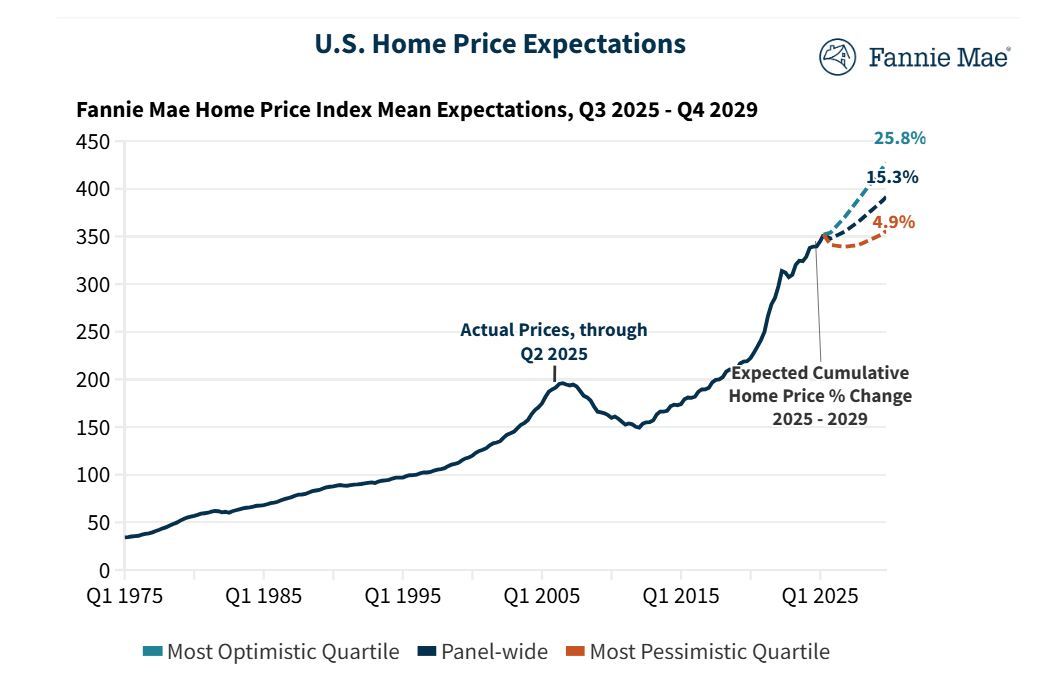
Let's look at the projected cumulative percentage value changes compared to the end of 2024:
| Year | All Panelists (Mean) | Optimists (Mean) | Pessimists (Mean) |
|---|---|---|---|
| 2025 | 2.4% | 4.3% | 0.5% |
| 2026 | 4.5% | 8.9% | -0.1% |
| 2027 | 7.6% | 14.5% | 0.4% |
| 2028 | 11.4% | 20.1% | 2.4% |
| 2029 | 15.3% | 25.8% | 4.9% |
What does this tell us?
The “Optimists” see a market that continues to climb, with significantly higher growth rates over the next few years, ending up with a cumulative increase of nearly 26% by 2029. These are the folks who likely believe that underlying demand, limited housing supply, and demographic trends will continue to push prices upward, even if there are temporary dips. They might be looking at factors like continued job growth, a desire for homeownership, and the fact that building enough new homes takes a very long time.

On the other hand, the “Pessimists” are looking at a much more subdued, or even slightly negative, outlook. Their cumulative growth expectation is just under 5% by 2029. This group might be more concerned about the lingering effects of higher interest rates, potential economic slowdowns, or a significant increase in housing inventory. They might be thinking that affordability will become a major constraint, forcing prices to stagnate or even fall in some areas.
My take on this division: This spread is what makes the housing market so fascinating and, frankly, so unpredictable at its fringes. The fact that there’s such a wide gap between the optimists and pessimists highlights the uncertainty surrounding future economic conditions. The optimists are betting on strong underlying fundamentals, while the pessimists are hedging their bets against potential headwinds.
For regular people like you and me, this means that location, location, location is more important than ever. Some markets, driven by strong local economies and limited supply, might follow the optimistic trajectory. Others, facing economic challenges or a flood of new construction, might lean towards the pessimistic outlook.
A Look Back to Understand the Future
To truly grasp where we're headed, it's always helpful to look at where we've been. Fannie Mae also provides historical data that gives us context for these future expectations.
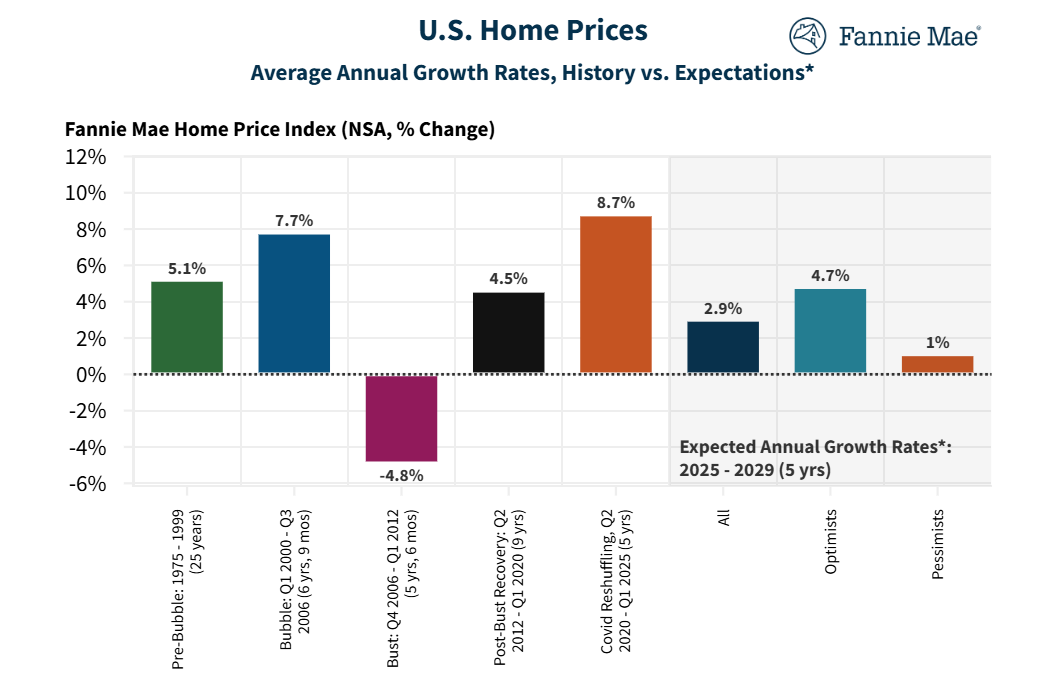
Comparing Average Annual Home Price Growth Rates: History vs. Expectations (2025-2029):
- Pre-Bubble (1975-1999): 5.1% (average annual growth)
- Bubble (Q1 2000 – Q3 2006): 7.7%
- Bust (Q4 2006 – Q1 2012): -4.8% (average annual decrease)
- Post-Bust Recovery (Q2 2012 – Q1 2020): 4.5%
- Covid Reshuffling (Q2 2020 – Q1 2022): 8.7%
- Expected Annual Growth Rates 2025-2029 (All Panelists): 2.9% (average annual estimate)
What stands out here? Our recent Covid Reshuffling period saw some of the highest annual growth rates, similar to the pre-bubble era. The bust years were, of course, a stark reminder that prices don't always go up. The post-bust recovery period shows a more typical pace before everything heated up again.
Now, look at the expected annual growth rate for 2025-2029: around 2.9%. This is lower than the pre-bubble average and the Covid reshuffling period, and significantly lower than the bubble itself. It's more in line with, though slightly lower than, the post-bust recovery.
My observation: This comparison is telling. It suggests that the experts are anticipating a return to a more “normal” growth rate, one that existed before the extreme conditions of the pandemic. The lack of high inflation and the normalization of interest rates are key factors driving this expectation, in my opinion. It’s about stability returning to the market, which is good news for long-term homeowners and potential buyers who are worried about affordability.
What's Driving These Predictions? Key Factors to Watch
Predicting the future of any market is like trying to predict the weather – there are a lot of moving parts. But based on what I'm seeing and hearing, these are the big factors that will shape our housing market from 2025 to 2029:
- Interest Rates: This is the elephant in the room. While rates have come down from their peak, they're still higher than many have become accustomed to. If rates continue to gently decline, it will boost affordability and encourage more buyers. If they stay elevated or rise again, it will put a damper on demand. The Federal Reserve's monetary policy will be critical to watch.
- Housing Supply: The chronic shortage of homes is a major underlying factor. Building new homes takes time, and there are still many regions where demand far outstrips supply. This lack of inventory is a strong support for home prices. However, if we see a significant uptick in new construction, especially in areas that have seen rapid price growth, it could help balance things out.
- Economic Stability and Job Growth: A strong economy with consistent job growth is vital for housing demand. When people feel secure in their jobs and incomes, they are more likely to buy homes. Any significant economic downturn or rising unemployment would put downward pressure on prices.
- Demographics: Millennials continue to age into prime home-buying years, and this large generation will continue to fuel demand. While the pace of this demographic wave might be slowing, it's still a significant tailwind for the housing market.
- Affordability: This is a double-edged sword. While higher prices have made homes less affordable, if wages keep pace and interest rates remain stable, affordability can gradually improve. However, if prices rise faster than incomes or interest rates jump, affordability will become a major hurdle.
- Inflation: Persistent inflation can erode purchasing power and lead to higher interest rates as central banks try to control it. A stable, low-inflation environment is generally good for housing markets.
- Geopolitical Events: Unexpected global events can have ripple effects on the economy, which in turn can impact the housing market. Think of supply chain issues or shifts in global investment.
My personal take: I emphasize affordability and supply as two of the most powerful forces. Even with good job growth, if people can’t afford the monthly payments, demand will falter. Conversely, if there are simply no homes to buy, prices often have nowhere to go but up, even with affordability challenges.
The Dispersion of Home Price Expectations: Trusting Your Gut vs. The Data
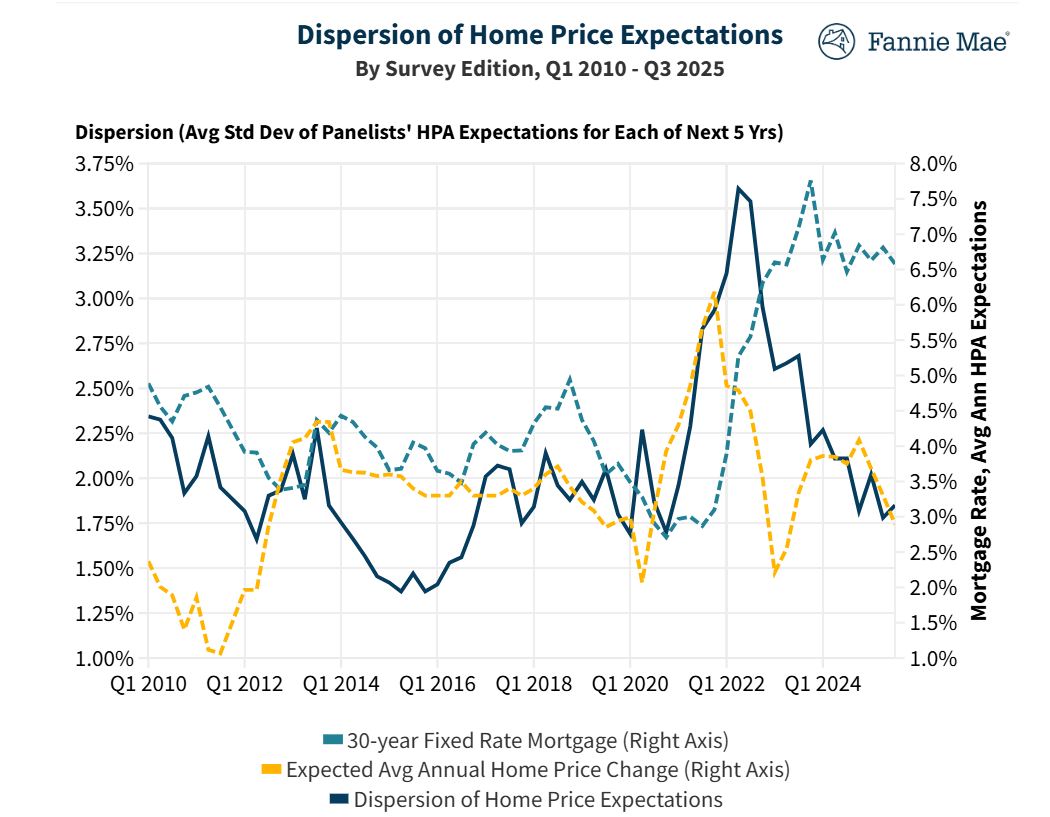
Looking at the dispersion of home price expectations from the Fannie Mae survey is really interesting. This chart shows how spread out the opinions are among the panelists over time. When the lines are far apart, it means there's a lot of disagreement and uncertainty. When they are close together, it suggests more consensus.
You can see that the dispersion of expectations has fluctuated. It peaked around 2021-2022, which was a period of extreme volatility and uncertainty due to the pandemic and the rapid shift in interest rates. More recently, the dispersion seems to be tightening a bit as we move closer to a more stable environment.
Why is this important? A wide dispersion means more risks and more potential for outliers. A tighter dispersion suggests more clarity and agreement among experts, leading to a more predictable market, even if that prediction is for modest growth.
My interpretation: The recent decrease in dispersion makes me a bit more confident in the general direction of the forecasts. It suggests that the experts are starting to see a clearer path forward, even if they disagree on the exact magnitude of change.
What Does This Mean for You? Actionable Insights
Now, let's translate these predictions into advice for you, whether you're considering buying, selling, or just want to understand your current home's value.
If you're looking to buy:
- Don't wait for a crash, but be budget-conscious: As I mentioned, a significant price crash isn't the dominant prediction. Focus on what you can afford comfortably, considering current and projected interest rates.
- Be prepared for persistent competition in desirable areas: Limited supply in strong markets will continue to drive demand and keep prices firm.
- Explore different financing options: With higher rates, understanding ARMs (Adjustable Rate Mortgages) or considering seller concessions might be part of your strategy.
- Location matters more than ever: Research local job markets, economic growth, and planned development. Some areas will undoubtedly outperform others.
If you're looking to sell:
- Your timing is likely good: The market is expected to continue appreciating, meaning your home should hold its value and likely increase.
- Price it realistically: While there's appreciation, avoid overpricing. A well-priced home in a steady market will attract serious buyers.
- Focus on presentation: In a market without extreme price surges, curb appeal and interior staging become even more important to attract offers.
- Consider the long-term outlook: If you don't need to sell immediately, holding onto your property could lead to further gains, given the optimistic outlook for longer-term appreciation.
For Homeowners:
- Your equity is likely to grow: Even at modest rates, your home is expected to continue building equity. This can be a valuable asset for future financial goals.
- Refinancing opportunities may arise: If interest rates drop significantly, you might have opportunities to refinance your mortgage to a lower rate, saving money over time.
- Stay informed: Keep an eye on local market trends, interest rate movements, and economic news.
The Road Ahead: A Normalizing Market
From where I stand, the housing market predictions for 2025 to 2029 paint a picture of a return to a more normalized environment. The frenzy of the pandemic years is behind us, and we're moving towards a period of steady, sustainable growth. This doesn't mean it will be boring; there will still be regional variations, economic shifts, and individual stories that make the market dynamic.
The Fannie Mae HPES provides a valuable guide, showing us that while there's a spectrum of opinions, the consensus leans towards continued, albeit moderate, appreciation. My hope is that this clarity helps you make informed decisions, whether you're a first-time buyer or a seasoned homeowner.
“Build Income Stability with Turnkey Property Investments”
As the housing market evolves from 2026 to 2029, smart investors are positioning themselves now. Norada offers access to prime, ready-to-rent properties that are built for long-term success.
Invest in areas poised for growth and secure your financial future with properties tailored for rental income and appreciation!
HOT NEW LISTINGS JUST ADDED!
Speak with our expert investment counselors today (No Obligation):
(800) 611-3060
Recommended Read:
- Housing Market Forecast for the Next 2 Years
- Housing Market Predictions for Next Year: Prices to Rise by 4.4%
- Housing Market Predictions for 2025 and 2026 by NAR Chief
- Real Estate Forecast Next 5 Years: Top 5 Predictions for Future
- Is the Housing Market on the Brink in 2024: Crash or Boom?
- 2008 Forecaster Warns: Housing Market 2024 Needs This to Survive
- Real Estate Forecast Next 10 Years: Will Prices Skyrocket?
- Housing Market Predictions for Next 5 Years (2024-2028)
- Housing Market Predictions 2024: Will Real Estate Crash?
- Housing Market Predictions: 8 of Next 10 Years Poised for Gains
- Trump vs Harris: Which Candidate Holds the Key to the Housing Market (Prediction)