It’s no secret that buying a home in San Francisco feels like a monumental undertaking, a significant financial leap. But if you’ve ever wondered just how much the price of a San Francisco pad has climbed, get ready for a jaw-dropping number: San Francisco home values have risen by almost 300% over the last 50 years. That’s right, a nearly three-fold increase in the real value of your San Francisco property, when you account for inflation. This isn't just a statistic; it’s a story of transformation, economic evolution, and a city that has become a global magnet.
San Francisco Home Values Skyrocket by 300% Over the Last 50 Years
As I’ve spent years navigating the San Francisco real estate market, observing its ebb and flow, I’ve seen firsthand the incredible demand and the often staggering prices. This massive appreciation isn't a random event; it's a direct reflection of profound shifts in the American economy and the unique role San Francisco has carved out for itself on the global stage, particularly as the undisputed capital of technological innovation.
The Shifting Tides of American Economy and Real Estate
From the mid-1970s to the mid-2020s, the United States has undergone a seismic economic transformation. We’ve moved from an era dominated by manufacturing and industry to one driven by service, information, and technology. According to a deep dive by Realtor.com, analyzing five decades of data from the Federal Housing Finance Agency (FHFA), this shift has led to wildly different outcomes for cities across the country.
While home values have increased everywhere, the magnitude of that growth tells a compelling story. We're seeing a stark divide between coastal hubs that have become economic powerhouses and cities that once thrived on manufacturing but have struggled to reinvent themselves.
West Coast: The Undisputed Champions of Home Value Growth
When you look at where home values have skyrocketed, the West Coast, and especially California, stands out like a beacon. It’s no surprise that San Jose, the heart of Silicon Valley, leads the pack. From 1975 to 2024, adjusted for inflation, home values in San Jose soared by a remarkable 396%. This surge is directly tied to the rise of the tech industry, attracting brilliant minds and significant investment, creating high-paying jobs and, consequently, intense demand for housing.
And then there's San Francisco. Following closely behind San Jose, our beloved Golden City saw its home values climb by an astonishing 300% over the same period. What’s particularly insightful here is the proximity of these gains. San Jose and San Francisco, mere miles apart, represent twin pillars of the tech revolution. This close clustering of innovation and industry created a powerful economic vortex, drawing people and capital to the Bay Area like never before.
This isn't just about owning a home; it's about owning a piece of a global innovation engine. The demand for housing in these areas is fueled by more than just a desire for a nice place to live; it’s driven by career opportunities, access to groundbreaking industries, and a lifestyle that embraces forward-thinking innovation.
Table: Top Metros with Highest Inflation-Adjusted Home Value Increases (1975-2024)
| Rank | Metro Area | Inflation-Adjusted Home Value Increase |
|---|---|---|
| 1 | San Jose, CA | 396% |
| 2 | San Francisco, CA | 300% |
| 3 | Los Angeles, CA | 292% |
| 4 | Seattle, WA | 280% |
| 6 | Boston, MA | 196% |
The Engine of Tech: Driving San Francisco's Ascent
As someone who has witnessed San Francisco’s evolution, I can attest to the immense impact of the technology sector. Back in the 1970s and 80s, while Silicon Valley was buzzing, San Francisco was also a vibrant city with its own unique culture and economic drivers. However, the explosion of personal computing, the internet, and then mobile technology completely reshaped the economic landscape. Companies like Apple, Google, Facebook (now Meta), and countless others either headquartered themselves or established major operations in the Bay Area.
This concentration of talent and capital created a “winner-take-all” dynamic. Highly skilled workers, drawn by the allure of groundbreaking careers and substantial salaries, flocked to the region. This influx of demand, coupled with the inherent geographical constraints of San Francisco – a peninsula with limited land for expansion – created a perfect storm for skyrocketing property values. Limited new construction, due to zoning laws and the sheer difficulty of building on the hilly terrain, further squeezed supply, pushing prices to astronomical levels.
East Coast Echoes: Finance and Innovation
While the West Coast often grabs the headlines for tech, it's important to note that other major economic hubs also saw significant gains. Cities like Boston and New York, with their strong financial sectors and esteemed universities, benefited from similar economic trends. Boston, a historic hub of education and finance, saw home values increase by a respectable 196%. New York City, the undisputed global financial capital, followed with a 161% appreciation.
These cities, like their West Coast counterparts, experienced a boom in high-paying service and information-based jobs. However, they also faced similar challenges with housing supply. Strict zoning regulations and limited space for new development in established urban cores meant that demand often outstripped supply, leading to sustained price increases.
The Other Side of the Coin: Struggling Housing Markets
The contrast between the booming coastal cities and the struggling industrial heartlands is stark. Cities that were once powered by manufacturing, jobs that have largely moved overseas or been automated, have found it difficult to adapt. Here, home value growth has been minimal, and in some cases, stagnant.
For instance, Memphis, Tennessee, and Cleveland, Ohio, cities with deep roots in manufacturing, saw inflation-adjusted home value increases of a mere 2% over the past 50 years. Birmingham, Alabama, another former industrial powerhouse, experienced a 9% rise. Pittsburgh, once the “Steel City,” saw a slightly better but still modest 26% increase.
What's the common thread here? These cities often lacked the capital—both financial and human—to successfully transition to the new economy. The loss of manufacturing jobs led to economic decline, making it harder to attract the tech and finance industries that have driven growth elsewhere. The housing market in these areas reflects this economic reality; without strong job growth and a vibrant economy, there's little pressure to drive up property values. This is a critical insight: it's not just about location, it's about the economic engine powering that location.
Looking Ahead: What Does This Mean for San Francisco?
The nearly 300% rise in San Francisco home values is a testament to the city's incredible resilience and its pivotal role in the modern economy. However, it also presents ongoing challenges. Affordability remains a major concern for residents, and the question of how to maintain a diverse and vibrant community in the face of such high living costs is a persistent debate.
As I see it, the future of San Francisco's housing market will likely remain tied to the fortunes of the tech industry. While the industry continues to innovate and attract talent, demand for housing will remain high. However, there's a growing conversation about decentralization and the possibility of more remote work impacting the need for everyone to live in the most expensive cities.
Understanding these historical trends, from the boom in tech hubs to the struggles of former industrial centers, gives us a clearer picture of the forces shaping real estate. San Francisco's story over the last 50 years is a powerful illustration of how economic shifts can radically transform a city and its housing market, proving that location, innovation, and economic opportunity are inextricable from the value of a home.
Turnkey Rental Properties = Fast Cash Flow + Lasting Wealth
Turnkey properties let you start earning rental income from day one—no renovations, no tenant hunts, no management headaches.
Work with Norada Real Estate to find vetted, cash-flowing markets tailored to your goals—so you can build steady returns without the stress.
HOT NEW LISTINGS JUST ADDED!
Speak with a seasoned Norada investment counselor today (No Obligation):
(800) 611-3060
Also Read:
- San Jose Home Values Rise by Almost 400% Over the Last 50 Years
- San Jose Housing Market: Trends and Forecast 2025-2026
- Average Home Price in San Jose Reaches $1.45 Million
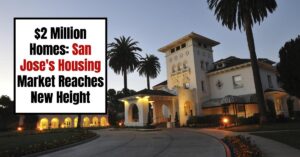
- $2 Million Homes: San Jose's Housing Market Reaches New Height
- Best Time to Buy a House in California’s Largest Metros in 2025
- Bay Area Housing Market: Prices, Trends, Forecast 2025
- Bay Area Housing Market Forecast for the Next 2 Years
- Bay Area Housing Market Predictions 2030
- Bay Area Housing Market Booming! Median Prices Hit Record Highs
- Bay Area Housing Market: What Can You Buy for Half a Million?
- Bay Area Home Prices Skyrocket: Wealthy Buyers Fuel Market