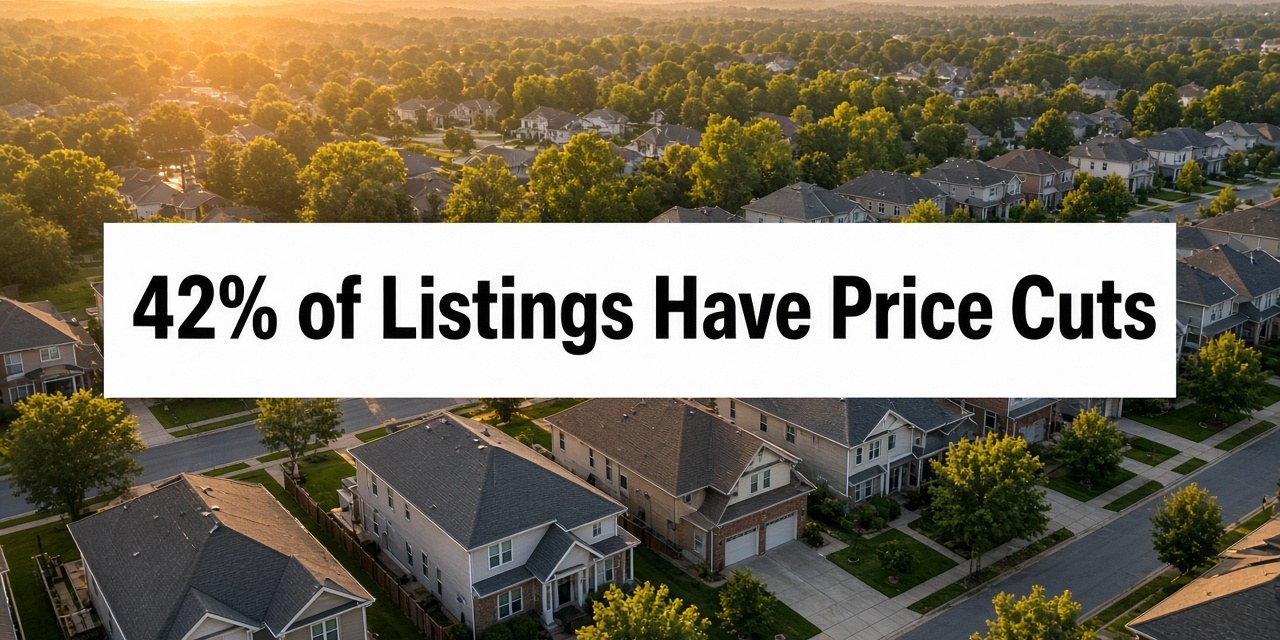
About 42% of active U.S. home listings now carry a price cut — a record share in Parcl Labs data reported in mid-September 2026 — and the pressure is far from even. Western and Sun Belt metros such as Colorado Springs and Austin have pushed past the 50% mark, while other markets still look closer to “negotiate a little” than “slash the ask.”
That pattern sits on top of a familiar financing backdrop: 30-year fixed mortgage quotes hovering near or above 7% after the Federal Reserve’s unanimous +25 bp move to a 3.75%–4.00% funds target, with the SEP median still near ~4.1% for year-end. Sales volume has already cooled — see existing-home sales at a 14-month low — and inventory has rebuilt toward roughly 1.62 million listings and 4.9 months’ supply. Price cuts are what happens when list pride meets payment math.
A Record 42% of U.S. Home Listings Now Carry Price Cuts — Where Sellers Are Cutting Most
What “42% With Price Cuts” Actually Measures
Parcl Labs’ mid-September read — covered widely after a September 10 report — put the national share of active listings with a price reduction near 41.7%–42%, up roughly 24 basis points week over week, against about 1.57 million active listings. Treat that as a stock measure: how much of what is currently for sale has already been marked down from its original ask.
Other trackers use different windows and definitions, which is why the headlines can disagree without anyone getting the data “wrong.” Redfin’s weekly tracker for the four weeks ending September 6 showed about 20.8% of listings with a price drop in that period — a flow-style reading, not the same cumulative stock. Realtor.com’s Summer 2026 seller research separately noted that less than 40% of July active listings had ever been cut, versus a much higher share a year earlier, as more sellers started closer to reality. When you cite price cuts, name the source and the metric.
- Parcl Labs (stock): ~42% of active listings currently showing a reduction
- Redfin (recent flow): ~20.8% with a drop in a recent four-week window
- Realtor.com (summer stock framing): under 40% of July actives ever cut, after sharper cuts a year ago

Where Sellers Are Cutting Most
The record national print hides a metro story. Parcl Labs flagged a Western/Sun Belt cluster where more than half of listings have already been reduced — Colorado Springs near the top of that list (mid-50%s in reporting), with Austin and other high-supply Sun Belt names close behind. Those are markets where new supply, migration normalization, and rate-sensitive demand collided first.
Elsewhere, cuts are common but not dominant. Job-center suburbs with thin turnkey inventory can still clear closer to ask if the home is clean and priced inside the recent comp range. The practical rule for fall 2026: open the metro’s price-cut share and days-on-market together, not the national average alone. For how that translates into offers, see buyer negotiating power with roughly 4.9 months’ supply.
| Signal | Mid-Sep 2026 read | Why it matters |
|---|---|---|
| National price-cut stock (Parcl Labs) | ~42% of active listings | Sellers adjusting after soft demand |
| Hot-cut metros | Western/Sun Belt names >50% | Local oversupply + rate friction |
| 30-year mortgage backdrop | Surveys ~7%+ | Payment math forces list realism |
| Existing inventory / supply | ~1.62M / ~4.9 months | More choice than the ultra-tight years |
| Policy backdrop | Fed funds 3.75%–4.00%; SEP ~4.1% | No quick cut-cycle bailout priced in |
Why Cuts Are Spreading Without a National Crash Script
Price cuts are a clearing mechanism, not a verdict that every ZIP code is breaking. Three forces are doing most of the work:
- Affordability gates. Near 7%, fewer households clear both underwriting and a payment they can sleep with — a theme we track in how the Fed hike hits home prices and affordability.
- Lock-in on the other side of the door. Owners with 3%–4% coupons still hesitate to sell and rebuy; that keeps some supply bottled up even as other listings linger and get cut. Dig into that coupon math in why lock-in is stronger again at 7%.
- New-home competition. Builders can advertise rate help and selective discounts, which pressures nearby resale asks — see builder incentives and September price cuts and builder-advertised ~4% mortgages.
None of that requires inventing a 2008 sequel. It does require sellers to stop anchoring to last year’s peak print.
Seller Playbook When Nearly Half the Board Is Already Discounted
If your metro’s cut share is climbing, the expensive mistake is a vanity list price “to leave room.” Buyers sorting at 7% skip overpriced homes faster than they negotiate them.
- Price to the last 60–90 days of closed and pending comps, including expireds.
- Budget concessions early — closing credits or rate help can beat a second public cut.
- Fix obvious inspection landmines before the first showing; thin traffic is unforgiving.
- Watch new construction within a short drive; builder incentives rewrite the payment comparison overnight.
Buyer Playbook: Cuts Are Leverage, Not a Free Put
A high price-cut share improves your odds of a credit or a cleaner inspection conversation. It does not guarantee a bargain on every address. Underwrite the full PITI — taxes and insurance included — and compare resale after concessions with new builds after buydowns. Pending contracts still lead closed sales; soft signings can foreshadow more cuts ahead, which we unpack in why pending home sales are the real leading signal.
How to Read a Price Cut Without Getting Fooled
Not every reduction is equal. A $5,000 cut on an overpriced $900,000 ask can still leave the home above the market. A 3% reduction after 45 days on market in a metro where half the board is already discounted may simply be the seller catching up to what buyers already knew. Ask three questions before you celebrate a slash:
- What was the original list relative to the last 90 days of closed comps?
- How many cuts has the listing taken, and over how many days?
- Are nearby new homes advertising payment help that undercuts this resale’s payment?
Agents who work Western and Sun Belt inventory say the first cut often arrives after the second or third weekend of thin traffic. By then, the listing has trained shoppers to wait for another reduction. Pricing correctly on day one is still the highest-ROI decision a seller can make — a theme that shows up whenever buyers regain negotiating room.
Regional Texture Beyond the National Record
Parcl Labs’ Western cluster above 50% is eye-catching because it pairs with years of rapid supply growth and a post-migration hangover. Austin’s cut share near the top of national lists is not a morality play about “tech”; it is arithmetic: more competing listings, rate-sensitive demand, and sellers who bought or refinanced into expectations that no longer clear at ~7%. Colorado Springs and similar mid-size Western markets show the same pattern with a military and remote-work overlay.
In the Northeast and parts of the Midwest, cut shares can look milder even when sales are soft, because inventory never exploded the same way. That does not mean buyers should overpay. It means your leverage may show up as inspection credits and closing help rather than a double-digit list slash. Always pair national “record cut” headlines with the MLS absorption rate on your specific price band.
Investors Watching Cut Shares for Entry Timing
For small landlords, a rising cut share is a screen, not a green light. Underwrite rent against a 7% acquisition or refinance assumption, include vacancy and capex, and assume exit liquidity matches today’s quieter existing-sales tempo. If mega-capital is already stepping back — investors near 27% of purchases in Q2 — you may face fewer bidding wars on tired stock, but you also inherit whatever deferred maintenance scared them off. Price cuts do not repair roofs.
Bottom Line
A record ~42% of U.S. listings with price cuts — per Parcl Labs’ mid-September read — is the market admitting that asks written for cheaper mortgages no longer clear. The deepest cuts cluster in Western and Sun Belt metros already past 50%, while other areas still trade on condition and micro-supply. Near 7% rates and a firmer Fed stance, expect more realism on list prices, more negotiation, and a premium on local data over national panic headlines.
VS
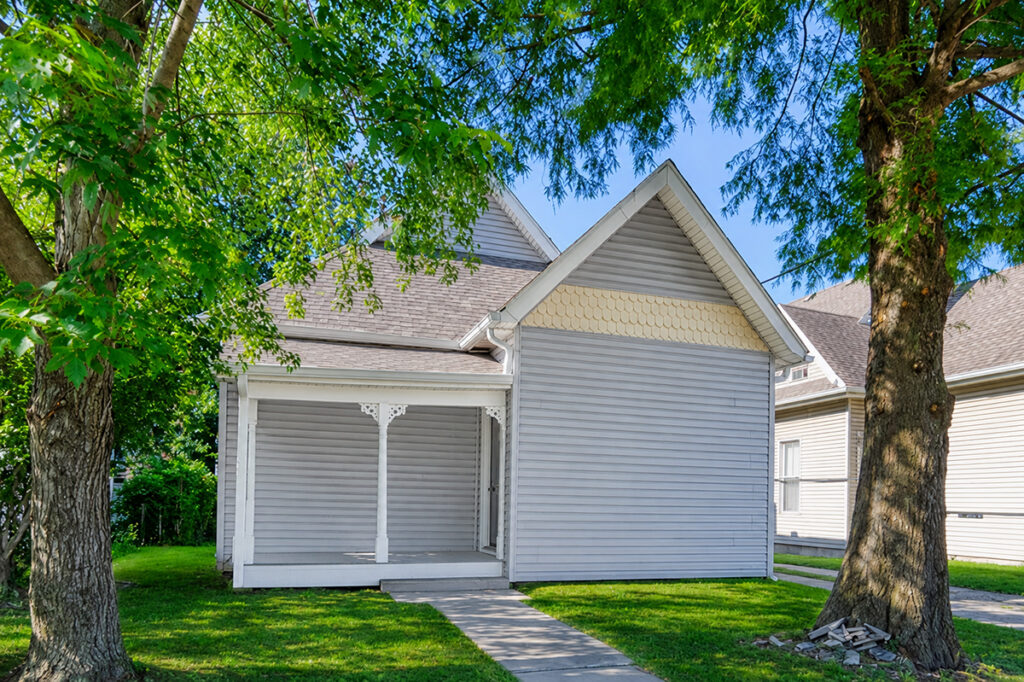
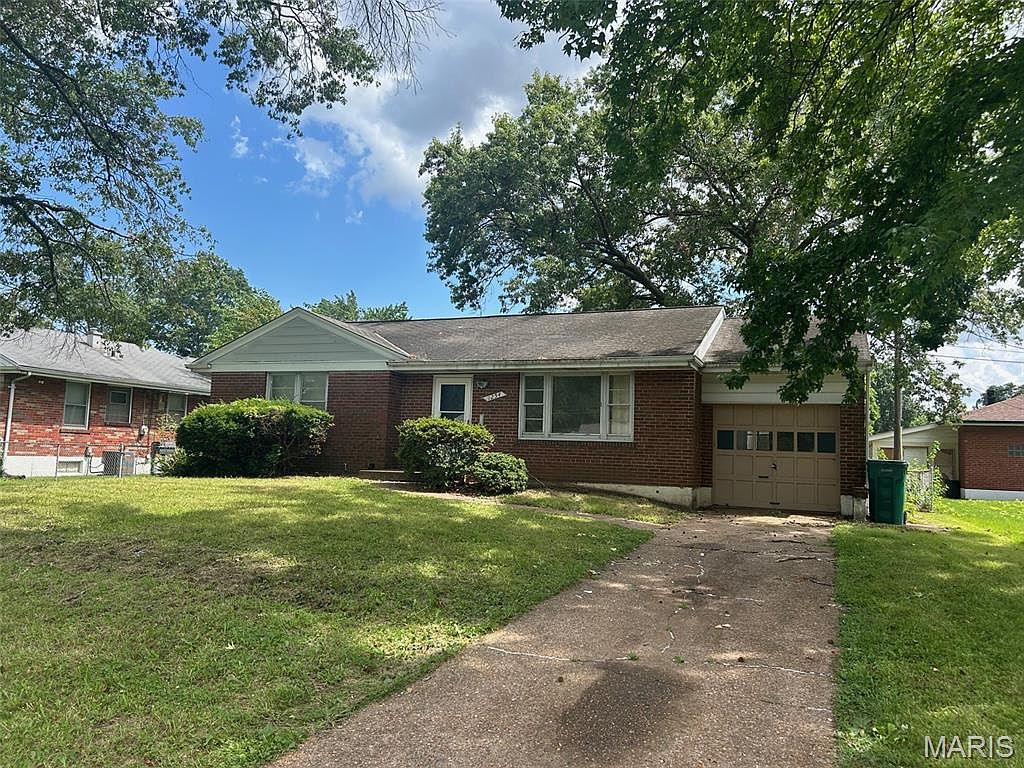
Saint Louis offers a budget‑friendly 4‑bed rental with a high cap rate, while Indianapolis provides a classic 2‑bed property with steady cash flow. Which Midwest market fits YOUR investment strategy?
We have much more inventory available than what you see on our website – Let us know about your requirement.
📈 Choose Your Winner & Contact Us Today!
Speak to a Norada Investment Counselor (No Obligation):
(800) 611-3060
Also Read:
- Top 10 Housing Markets Set to Deliver High ROI in 2026
- Top 10 Most Popular Housing Markets of 2025 for Homebuyers
- Will Real Estate Rebound in 2026: Top Predictions by Experts
- Housing Market Predictions for the Next 4 Years: 2026, 2027, 2028, 2029
- Housing Market Predictions for 2026 Show a Modest Price Rise of 1.2%
- Housing Market Predictions 2026 for Buyers, Sellers, and Renters
- 12 Housing Markets Set for Double-Digit Price Decline by Early 2026
- Real Estate Forecast: Will Home Prices Bottom Out in 2025?
- Housing Markets With the Biggest Decline in Home Prices Since 2024
- Why Real Estate Can Thrive During Tariffs Led Economic Uncertainty
- Rise of AI-Powered Hyperlocal Real Estate Marketing in 2025
- Real Estate Forecast Next 5 Years: Top 5 Predictions for Future
- 5 Hottest Real Estate Markets for Buyers & Investors in 2025