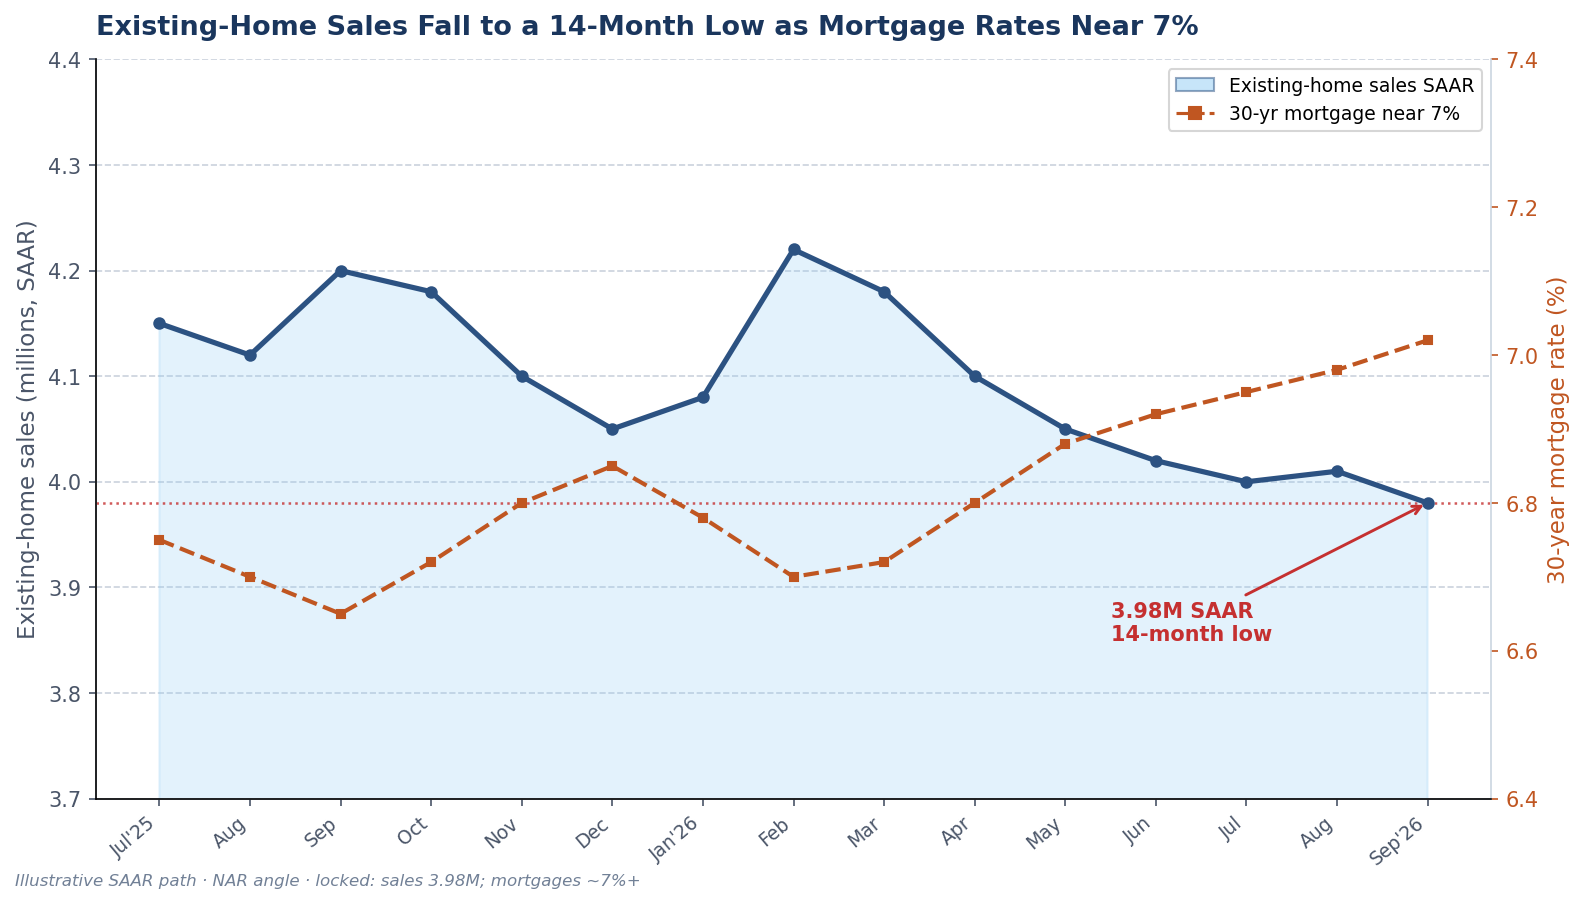
Existing-home sales slipped to a seasonally adjusted annual rate of about 3.98 million — a 14-month low — as 30-year fixed mortgage rates hover near 7%. If you have been waiting for the market to “feel different,” this is that quieter tempo: fewer closings, longer conversations, and less of the frantic weekend bidding that defined earlier cycles.
The slowdown did not start the morning after the Fed moved. Payment math at roughly 7.00%–7.08% in major surveys (with some sources higher) had already thinned the buyer pool. The Federal Reserve’s unanimous +25 bp hike to a 3.75%–4.00% funds target under Chair Kevin Warsh in mid-September 2026 — the first hike in more than three years — with an SEP median near ~4.1% for end-2026 mostly confirmed a firmer policy stance. Sales are the scoreboard; rates and listings are the game film. For the stock of homes behind this print, see housing inventory at 1.62 million and 4.9 months’ supply. For lender pipelines, see mortgage applications and purchase demand.
Existing-Home Sales Fall to a 14-Month Low as Mortgage Rates Near 7%
What a 3.98 Million SAAR Print Really Means
Existing-home sales track closed deals on previously owned homes, expressed as a seasonally adjusted annual rate so we can compare months with different numbers of business days. A reading near 3.98 million is soft — soft enough to mark a 14-month low — without claiming the market has frozen solid. Think of it as a market that still functions, but with a smaller set of households who can clear both underwriting and a payment they can live with.
That matters because headlines sometimes jump from “sales down” to “prices must crash.” Volume and prices are related, yet they are not the same dial. Sales can fall while median prices hold if the homes that do trade skew nicer, if sellers who refuse to cut simply wait, or if local inventory never becomes a true glut. The honest read for fall 2026 is cooler transactions, not a guaranteed national reset.
- Headline sales: ~3.98M SAAR
- Context: 14-month low
- Mortgage backdrop: surveys ~7.00%–7.08%; some quotes higher
- Policy backdrop: fed funds 3.75%–4.00% after unanimous +25 bp; SEP median ~4.1% end-2026
- Inventory backdrop: ~1.62M listings / ~4.9 months’ supply
Why Sales Weakened Around Expensive Financing
Mortgage rates are not set one-for-one by the federal funds rate. The overnight policy rate influences bank funding and many variable products more directly; the 30-year fixed quote leans on longer Treasury yields and mortgage-backed securities pricing. That is why rates could press toward 7% before the September decision — a mechanism we unpack in why mortgage rates hit 7% before the Fed hike. Oil, inflation expectations, and bond yields did heavy lifting; the hike then reinforced “higher for longer” rather than inventing a brand-new mortgage market overnight.
For families, the lived experience is simpler. A payment that felt stretchy in the mid-6% area can feel impossible once quotes sit near or above 7%. Add still-elevated home prices in many metros, and the number of households that both qualify and feel comfortable shrinks. Lock-in compounds the effect: owners with much lower coupons hesitate to sell and rebuy at today’s rates, which keeps some inventory bottled up even as other listings linger on the market.
Lock-In, Life Events, and Who Still Transacts
Not everyone can wait. Job moves, divorces, estates, and growing families still force sales. Investors sometimes rotate out. Those forced or motivated sellers meet a thinner buyer pool — which is exactly how days on market stretch and how negotiating room opens, a theme we cover in homebuyer negotiating power in fall 2026.
First-time buyers feel rate pain especially hard because they often have less equity and less cash cushion. Move-up buyers face a double hit: selling into a quieter market while financing the next home at ~7%. Cash buyers and high-equity households remain comparatively advantaged, which can keep pockets of activity alive even when the national SAAR looks soft.
Sales vs. Prices: Keep Them Straight
A 14-month low in sales is a demand and friction story. Price paths still depend on local supply, migration, insurance costs, and how stubborn list prices remain. In some suburbs, you will already see credits and modest cuts. In supply-constrained job centers, you may still see firm asking prices on turnkey homes. Use the national print as a mood ring, then open your MLS for absorption, list-to-sale ratios, and concession trends.
| Signal | Mid-Sep 2026 read | Practical meaning |
|---|---|---|
| Existing-home sales | ~3.98M SAAR (14-month low) | Fewer closings; slower tempo |
| 30-year fixed | Surveys ~7.00%–7.08% (some higher) | Payment math remains binding |
| Fed funds | 3.75%–4.00% (+25 bp, unanimous) | Policy firm; not a cut-cycle restart |
| Inventory / supply | ~1.62M / ~4.9 months | More choice than the ultra-tight years |
| Builder sentiment | HMI 32 (12-month low) | New-home sellers also cautious |
What Sellers Should Do With a Soft Sales Print
If you need to sell into this tape, price for the market you have — not the one you remember from peak frenzy. Practical steps that usually help:
- Use fresh comps from the last 60–90 days, including withdrawn and expired listings, not only dream sales.
- Pre-list repairs and staging that remove easy objections; thin traffic is unforgiving of deferred maintenance.
- Decide your concession budget early — rate buydown help, closing credits, or repair allowances can save a deal when list-price pride is sticky.
- Watch new construction nearby. Builders are already leaning on incentives and selective cuts; ignoring that competition is expensive. See builder incentives and price cuts in September.
- Coordinate timing if you are also buying. Rate locks, contingencies, and rent-backs need breathing room when closings are less predictable.
Carrying costs add up quietly: mortgage, taxes, insurance, utilities, HOA. A slightly lower net with a firm buyer often beats two more months of hoping the “right” full-price offer appears.
What Buyers Should Take From Quieter Sales
Soft sales are not a free put on home prices nationwide. They are an invitation to shop with patience and structure. Inspection leverage returns in more neighborhoods. Seller credits toward points can matter more than a symbolic $5,000 haircut on a list price. Comparing new vs. resale after incentives is now basic due diligence, not a niche tactic.
- Underwrite the full payment — principal, interest, taxes, insurance, HOA — especially as premiums rise (home insurance as a second payment shock).
- If you qualify, compare FHA/VA paths with conventional quotes (FHA and VA rates vs conventional).
- Ask about temporary payment help such as 2-1 buydowns rather than stretching the purchase price to force the payment down.
- Keep financing and inspection contingencies unless you are in a rare must-win micro-market.
Investors: Volume Softness Changes Exit Assumptions
For rental and small multifamily buyers, a 3.98M SAAR backdrop means exit liquidity may take longer if you need to sell into the same rate regime. Underwrite hold periods and refinance assumptions carefully while retail 30-year quotes sit near 7% and the Fed’s SEP still leaves room for roughly another firming step toward ~4.1% by year-end. Soft purchase applications (MBA purchase demand down sharply YoY) reinforce that you should not assume a quick bounce in retail demand.
How This Fits the Broader Fall 2026 Housing Tape
Put the pieces together and the story is coherent: expensive mortgages, cooler existing sales, rebuilding inventory toward roughly five months’ supply, cautious builders, and buyers who finally have room to negotiate in more places. None of that requires inventing a crash narrative. It does require respectful math — on payments, on insurance, on incentives, and on how long a listing may sit.
If you are deciding whether to list, buy, or wait, use the 14-month low as confirmation that urgency has shifted from buyers to many sellers. Then zoom into your street-level data. National SAAR figures set the tone; local contracts set your price.
Bottom Line
Existing-home sales near 3.98 million SAAR — a 14-month low — tell you the market is still rate-constrained while financing hovers near 7% and policy has just tightened to 3.75%–4.00%. Expect fewer closings, more negotiation, and a premium on clean underwriting. Pair this sales read with inventory, builder behavior, and your personal payment ceiling, and you can make a calm decision in a quieter — but still workable — fall market.
VS
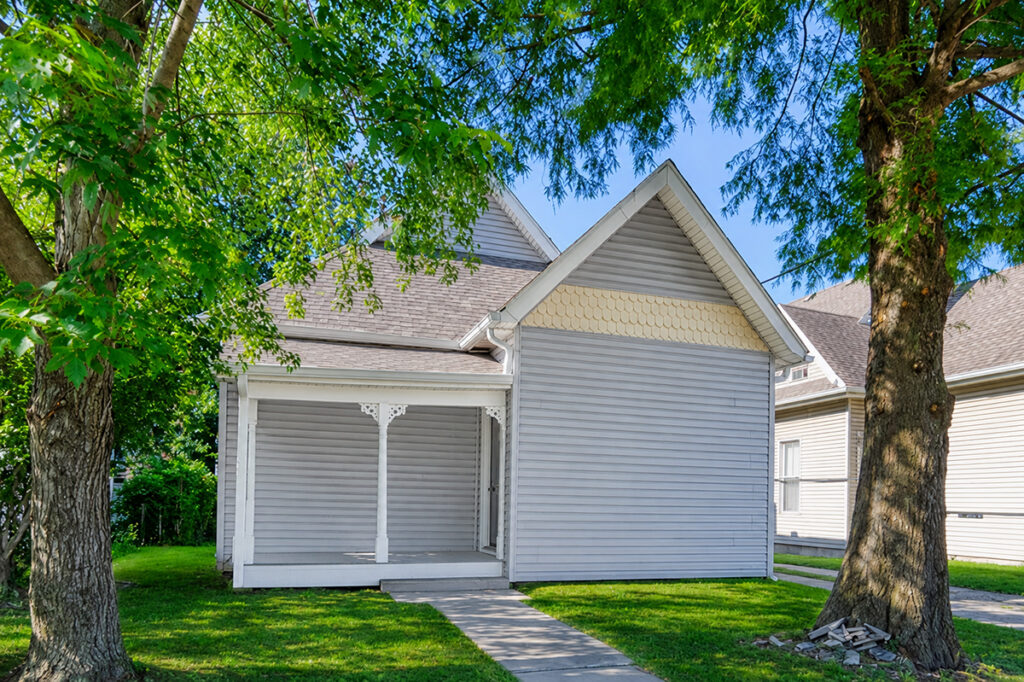
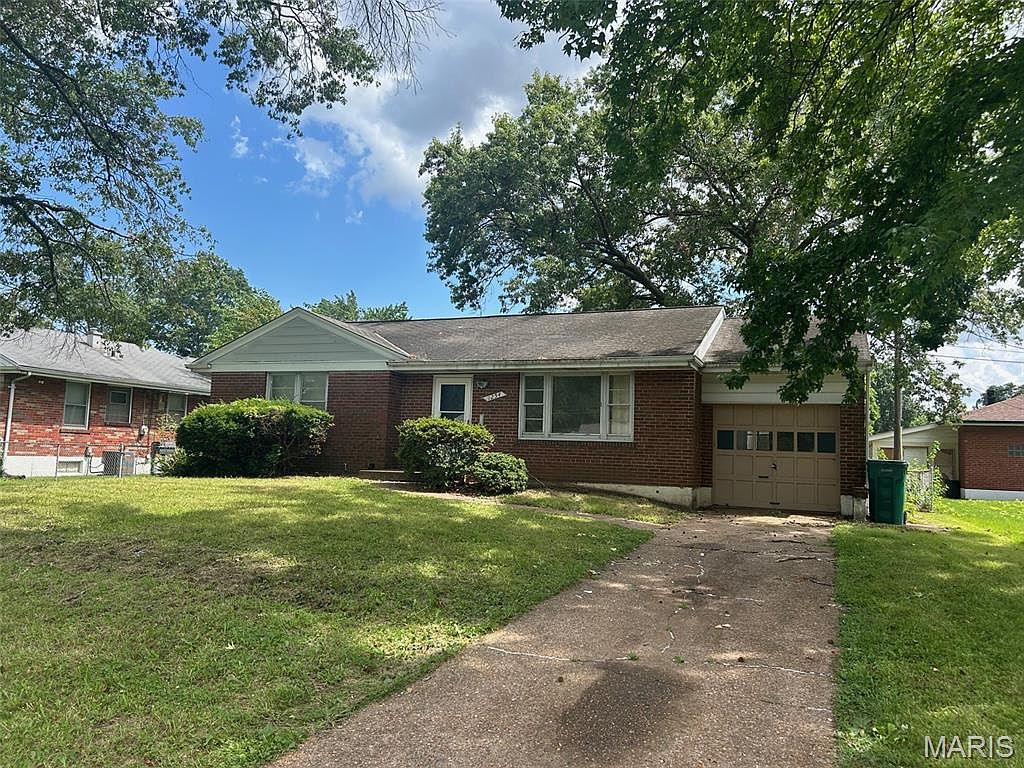
Saint Louis offers a budget‑friendly 4‑bed rental with a high cap rate, while Indianapolis provides a classic 2‑bed property with steady cash flow. Which Midwest market fits YOUR investment strategy?
We have much more inventory available than what you see on our website – Let us know about your requirement.
📈 Choose Your Winner & Contact Us Today!
Speak to a Norada Investment Counselor (No Obligation):
(800) 611-3060
Also Read:
- Top 10 Housing Markets Set to Deliver High ROI in 2026
- Top 10 Most Popular Housing Markets of 2025 for Homebuyers
- Will Real Estate Rebound in 2026: Top Predictions by Experts
- Housing Market Predictions for the Next 4 Years: 2026, 2027, 2028, 2029
- Housing Market Predictions for 2026 Show a Modest Price Rise of 1.2%
- Housing Market Predictions 2026 for Buyers, Sellers, and Renters
- 12 Housing Markets Set for Double-Digit Price Decline by Early 2026
- Real Estate Forecast: Will Home Prices Bottom Out in 2025?
- Housing Markets With the Biggest Decline in Home Prices Since 2024
- Why Real Estate Can Thrive During Tariffs Led Economic Uncertainty
- Rise of AI-Powered Hyperlocal Real Estate Marketing in 2025
- Real Estate Forecast Next 5 Years: Top 5 Predictions for Future
- 5 Hottest Real Estate Markets for Buyers & Investors in 2025