The summer sun bakes the U.S. housing market, transitioning from its peak season. While analysts predict some softening in the latter half of 2024, most agree on positive national growth for the year, extending the appreciation streak to 13 years. But what lies ahead in 2025? Here, housing experts offer their diverse insights:
Experts Forecast the 2025 Housing Market
The Bullish Outlook: Goldman Sachs Bets on Supply Constraints
Goldman Sachs, known for its optimistic outlook, predicts a 4.4% national home price increase in 2025. Their reasoning goes beyond just a lack of available housing stock. They acknowledge that rising interest rates could dampen demand from some potential buyers. However, Goldman Sachs believes the supply shortage will be a more powerful force, pushing prices upwards.
Decades of underbuilding have created a structural imbalance in the housing market. The demand for homes, fueled by demographics like millennials entering prime homebuying years, continues to rise.
Meanwhile, new construction has lagged, failing to keep pace with this growing demand. This persistent mismatch between supply and demand is likely to be the dominant factor influencing home prices in 2025, according to Goldman Sachs' forecast.
The Cautious Approach: Moody's Analytics Sees Affordability Hurdles
Moody's Analytics takes a more cautious stance, forecasting a meager 0.3% national price rise for 2025. Their primary concern is affordability. The turbocharged housing market of the pandemic era, fueled by historically low interest rates, drove a significant increase in home prices.
Now, with interest rates rising and inflation on the upswing, many potential buyers are finding themselves priced out. Moody's Analytics believes this affordability squeeze will act as a significant headwind for home price growth in the near future.
First-time homebuyers, a critical segment of the market, will be particularly impacted. Even existing homeowners looking to upgrade may find themselves facing sticker shock and larger monthly mortgage payments. This affordability hurdle is likely to keep a lid on significant price increases in 2025, according to Moody's Analytics.
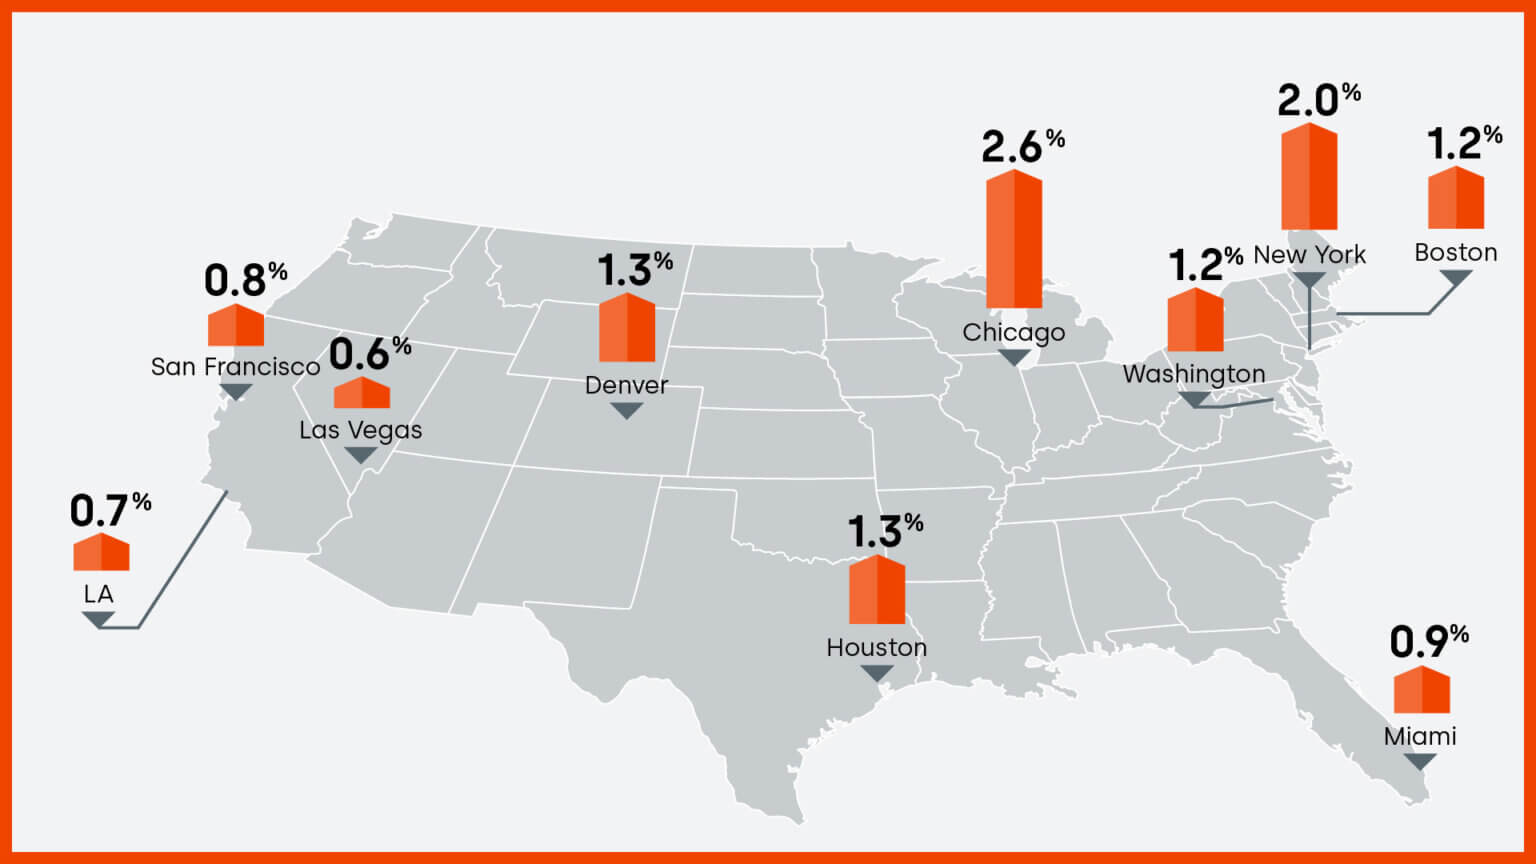
Beyond National Numbers: Regional Variations Take Center Stage
Experts warn against getting fixated on national forecasts. Regional markets will likely experience a diverse performance.
- Sunbelt Slowdown: Areas heavily reliant on tourism or facing economic slowdowns, particularly in the Gulf Coast states like Florida and Texas, might see price declines as potential buyers grapple with a combination of factors. Rising interest rates and inflation, coupled with a possible slowdown in tourism or local industries, could make them reconsider their purchasing power. For example, vacation home markets or retirement destinations could be particularly vulnerable if economic conditions worsen.
- Inventory Squeeze: Markets with limited housing stock, especially in desirable locations with strong job markets and high quality-of-life factors, could experience continued growth fueled by competition among buyers. Think tech hubs like Austin, Seattle, or Denver, where a constant influx of new jobs and a limited supply of housing has driven prices upwards for years. This trend is likely to persist in 2025, potentially outpacing the national average increase.
Emerging Market Movers: Keep an Eye on the Labor Market and Inventory
Two key metrics will be crucial for gauging regional market health:
- Labor Market: A weakening labor market, particularly in areas heavily reliant on specific industries, could signal a cooling market as potential buyers face job insecurity. This is especially concerning for industries that are sensitive to economic downturns, such as manufacturing or energy. If companies in these sectors start laying off workers, it could lead to a decrease in buyer demand and put downward pressure on home prices. Conversely, a strong labor market with low unemployment rates and rising wages would bolster buyer confidence and potentially lead to continued price growth.
- Active Inventory: A rise in available homes suggests more options for buyers, potentially leading to price stabilization or even dips in markets with previously low inventory. This can happen for a few reasons. One possibility is that homeowners who previously held off on selling due to a lack of alternatives in the market may decide to list their properties if they see more inventory become available. Additionally, new construction activity could also contribute to a rise in active listings. If the number of homes for sale starts to approach or even exceed buyer demand, it could tip the scales in favor of buyers and lead to a more balanced market, with prices potentially stagnating or even declining in some areas.
The Local Market: Where Insights Become Actionable
National forecasts provide a national temperature, but local markets have their own weather patterns. To make informed decisions in 2025, delve into your specific market. Research local employment rates, new construction activity, and listing inventory levels. These details, coupled with insights from experienced local real estate professionals, will equip you to navigate the 2025 housing market with confidence, whether you're a buyer, seller, or simply curious about the future.
ALSO READ:
- Real Estate Forecast Next 10 Years: Will Prices Skyrocket?
- Housing Market Predictions for Next 5 Years (2024-2028)
- Housing Market Predictions for 2027: Experts Differ on Forecast
- Housing Market Predictions for the Next 2 Years
- Housing Market Predictions 2024: Will Real Estate Crash?
- Will the Housing Market Crash in 2025?