Is the word “recession” making you sweat? Especially when you hear it attached to “real estate”? I get it. The news can sound scary, painting pictures of crashing markets and lost dreams. But here’s the thing: fear sells headlines, and fortunes are often made when others are fearful. So, how do you make the real estate recession work for you?
By understanding that a recession isn't the end of the world, but rather a shift in the market that actually creates incredible opportunities for those who are prepared and willing to act smartly. It’s a chance to play the long game, to position yourself for future growth, and potentially snag deals you wouldn’t even dream of in a booming market.
How to Make the Real Estate Recession Work for You?
Understanding the Real Estate Recession: It's Not Always Doom and Gloom
Before we jump into how to make this recession work for you, let's take a deep breath and understand what a real estate recession actually is. It’s not some sudden apocalypse. It’s a phase in the real estate cycle, just like seasons changing. Think of it as a cooldown period after a hot streak.
What exactly does a real estate recession look like? You'll typically see a few key signs:
- Falling Home Prices: This is probably the most noticeable sign. After years of prices going up and up, they start to come down or at least level off. Sellers might have to lower their asking prices to attract buyers.
- Slowing Sales: Homes take longer to sell. There are fewer bidding wars, and open houses might feel a bit empty. The frantic pace of the market slows down considerably.
- Increased Inventory: More homes are listed for sale, but fewer are being bought. This means buyers have more choices, and sellers have more competition.
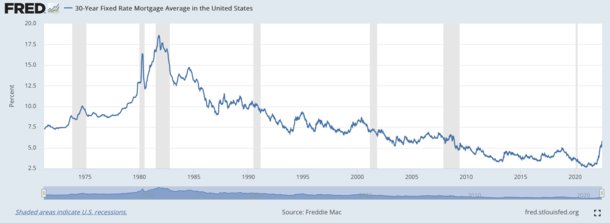
- Rising Interest Rates: Often, recessions are linked to or triggered by rising interest rates. Higher mortgage rates make it more expensive to borrow money, cooling down buyer demand.
Why are we talking about a real estate recession now? Well, if you've been following the news, you know that inflation has been stubbornly high, and to combat that, central banks have been raising interest rates. This impacts everything, including the cost of mortgages. Combine this with other global economic uncertainties, and you have the perfect recipe for a real estate market slowdown.
Now, is this really a recession or just a market correction? Honestly, the line can be blurry. Sometimes it's a bit of both. A “correction” implies a temporary dip, while a “recession” suggests a more prolonged period of economic downturn. Regardless of the label, the effects on the real estate market are similar: a shift from a seller's market to a buyer's market, and that, my friend, is where opportunity lies.
I've seen markets go up and down throughout my years watching real estate. What’s crucial to remember is that real estate is cyclical. Just like seasons change, so do markets. The boom times don't last forever, and neither do the downturns. And savvy folks understand this cycle and position themselves to benefit from it.
Opportunities Blooming in a Real Estate Recession: Where the Smart Money Moves
Okay, so prices might be softening, and things are slowing down. Instead of panicking, let's flip the script. A real estate recession isn't a curse; it's a reset button for the market. It’s a time when the balance of power shifts, and if you're smart, you can use this to your advantage.
Let’s break down the opportunities for different folks:
For First-Time Home Buyers: This might be your moment. For years, many first-time buyers have been priced out of the market, constantly outbid, and facing insane competition. A recession can be a game-changer.
- Lower Prices, Less Competition: Finally, you might find homes within your budget. You won't have to compete with ten other offers, and you might even get the seller to come down on the price. Imagine – actually having time to think and make a reasoned decision, instead of rushing into an offer just to keep up!
- More Inventory, More Choices: Remember those days of slim pickings? Now, you'll have more homes to choose from. You can be picky, take your time, and find a place that truly fits your needs and wants, not just grab whatever is available.
- Negotiating Power is Back: Sellers are now more motivated. They might be willing to negotiate on price, repairs, or closing costs. This is your chance to get a better deal and potentially build in some equity from day one.
- Long-Term Investment Potential: Real estate is still a solid long-term investment. Buying during a recession means you're likely buying at a lower point in the cycle. As the market recovers (and it always does, eventually), your property value should increase. Think of it as buying low and preparing to sell higher down the road (or simply enjoy the appreciation in your own home!).
For Real Estate Investors: For experienced investors, a recession can be like Christmas morning. It's a time of discounts and distressed deals.
- Distressed Properties Galore: Recessions often lead to an increase in foreclosures and short sales. These are properties where homeowners are struggling financially and might need to sell quickly, often at below market value. This is where seasoned investors find opportunities to buy low, renovate, and either rent out or flip for a profit when the market recovers. This is not about preying on misfortune, but providing solutions for those who need to sell and creating value in the process.
- Rental Demand Increases: As homeownership becomes less affordable or people become hesitant to buy, the demand for rentals often goes up. This can mean higher rental income and lower vacancy rates for rental property owners. Investing in rentals during a recession can provide a stable income stream and position you for long-term appreciation.
- Creative Financing Opportunities: In a tighter credit market, sellers and investors might get more creative with financing options. Think seller financing, where the seller acts as the bank, or private lending. These alternative financing methods can open doors for investors who might not qualify for traditional bank loans in a recession.
- Wholesaling and Flipping Comeback: While flipping got a bad name after the last big recession, the strategy itself is still valid. Buy low, fix it up, and sell when the market turns. A recession can be the perfect time to build a pipeline of deals, get properties under contract at discounted prices, and be ready to capitalize on the eventual market rebound. Wholesaling, which involves getting properties under contract and then assigning the contract to another buyer (often a rehabber) for a fee, can also be a lucrative strategy in this environment without requiring significant capital upfront.
For Existing Homeowners: Okay, you might be thinking, “What about me? I already own a home.” Don't worry; there are still ways to make a recession work for you, even if you're not planning to buy or sell right now.
- Refinancing Opportunities (Eventually): Interest rates might be high now, but they are cyclical too. If rates eventually come down (which is often the case in or after a recession to stimulate the economy), you could refinance your mortgage at a lower rate. This can significantly reduce your monthly payments and save you a lot of money over the life of your loan. Keep an eye on rate trends and be ready to jump when the time is right.
- Focus on Home Improvement and Value Adds: Instead of worrying about the market fluctuations, focus on making your current home even better. Invest in upgrades that increase your home's value and your enjoyment of it. A new kitchen, a finished basement, energy-efficient upgrades – these can all pay off in the long run, both in terms of your quality of life and your home's resale value when the market recovers.
- Review Your Mortgage Terms: Take this time to review your current mortgage and explore your options. Could you prepay some principal? Are you on the best possible loan program? Talking to a mortgage advisor can help you optimize your financial situation, regardless of market conditions.
- Ride Out the Storm and Think Long-Term: Real estate is a long-term game. If you're not planning to sell immediately, don't panic about short-term price dips. Historically, real estate values tend to recover and appreciate over time. Focus on your long-term financial goals and remember that your home is more than just an investment; it's your home.
Smart Strategies to Thrive in a Real Estate Recession: Playing Your Cards Right
Knowing the opportunities is one thing; seizing them is another. Here’s my take on some key strategies to really make a real estate recession work for you:
- Cash is King (and Liquidity is Queen): In any downturn, cash is king. Having cash on hand gives you flexibility and power. You can jump on deals quickly, make all-cash offers (which are very attractive to sellers in a slower market), and weather any financial uncertainties. Don't overextend yourself financially. Maintain a healthy cash reserve. Liquidity is equally important. Make sure your investments aren't all tied up in illiquid assets. Being able to access funds quickly is crucial.
- Due Diligence is Your Best Friend: In a hot market, people sometimes skip steps in their haste to buy. Don't do that in a recession. Due diligence becomes even more critical. Thoroughly inspect properties, research market values, understand the neighborhood, and don't rush into any deals. Get professional inspections, review disclosures carefully, and don't be afraid to walk away if something feels off.
- Negotiation Skills Become Your Superpower: In a buyer's market, negotiation is key. Don't be afraid to make offers below asking price. Be prepared to negotiate on repairs, contingencies, and closing dates. Remember, sellers are likely more motivated, so you have leverage. Practice your negotiation skills or work with a real estate agent who is a skilled negotiator.
- Think Long-Term, Act Short-Term Opportunistically: While real estate is a long-term investment, recessions present short-term opportunities. Think long-term about your goals – building wealth, owning a home, generating income – but be ready to act quickly and decisively when those opportunities arise during the downturn. Be patient but be ready to pounce.
- Seek Expert Advice and Build Your Network: Don't go it alone. Work with experienced real estate agents, mortgage brokers, financial advisors, and real estate attorneys. They can provide valuable insights, help you navigate the complexities of the market, and guide you to make smart decisions. Build your network. Connect with other investors, attend real estate events, and learn from those who have been through market cycles before.
I've personally seen people make incredible gains by being smart and strategic during market downturns. It's not about being a financial wizard; it's about being informed, prepared, and willing to see opportunity where others see only risk.
Conclusion: Recessions are Stepping Stones, Not Roadblocks
Look, recessions aren't fun for anyone. They can bring challenges and uncertainty. But they are also a natural part of the economic cycle. And for those who are prepared and willing to shift their mindset, a real estate recession can be a powerful catalyst for growth and wealth building.
Instead of fearing the headlines, use this time to educate yourself, strategize, and position yourself for future success. Whether you're a first-time buyer, a seasoned investor, or a current homeowner, there are ways to make this market work for you.
Remember, the market will recover. It always does. And those who act strategically during the downturn will be the ones who reap the rewards when the market bounces back. So, take a deep breath, stay informed, and get ready to make this real estate recession your springboard to success. This isn't the time to panic; it's the time to plan and prosper.
Profit From Real Estate—Even in a Down Market
Recessions create rare opportunities for savvy investors to secure deeply discounted properties and build long-term wealth.
Norada helps you target resilient markets with strong rental demand, ensuring positive cash flow—even when home prices soften.
HOT NEW LISTINGS JUST ADDED!
Talk to a Norada investment counselor today (No Obligation):
(800) 611-3060