Remember back when a dollar actually felt like it could buy you something? Seems like a distant memory, right? Over the past few years, we've all felt the pinch as prices for pretty much everything – from gas in our tanks to groceries in our carts – have jumped up. The big question on everyone's mind, and especially on the minds of folks at the Federal Reserve (the folks in charge of keeping our money system healthy), is: The Road to 2% Inflation: Are We There Yet?
Well, if you're looking for a straight yes or no, here it is: not quite, but we’ve definitely come a long way. Inflation, which peaked in mid-2022, has thankfully come down quite a bit. But hitting that sweet spot of 2% inflation that the Fed aims for? That’s proving to be a bit trickier than we hoped, and recent data suggests progress might be slowing down. Let's break down what's been happening with prices and see where we actually stand on this bumpy road back to normal.
Is Fed's 2% Inflation Target Possible in 2025: The Road Ahead
The Inflation Rollercoaster: A Look Back
To really understand where we are now, we need to take a quick trip down memory lane. Let’s look at how prices have been behaving since before the pandemic hit. Thanks to the recent data and article published by the Federal Reserve Bank of St. Louis, we can get a clear picture.
Think back to the years before 2020. From 2016 to 2019, things were pretty stable. Prices were inching up at a rate of about 1.7% each year. This is based on something called the Personal Consumption Expenditures (PCE) price index. Don't let the fancy name scare you; it’s just a way of measuring how much prices are changing for all the stuff we buy as people – from haircuts to TVs.
The Fed really likes to watch this PCE number because it gives a good overall view of inflation. Their target? They want to keep inflation at 2% annually. Close to 2%, but not too much higher or lower, is considered healthy for the economy.
Now, if we look at this PCE price index chart going back to 2016, you’ll see that nice, steady climb before 2020. Then, BAM! The pandemic hits. Suddenly, things went a little haywire.
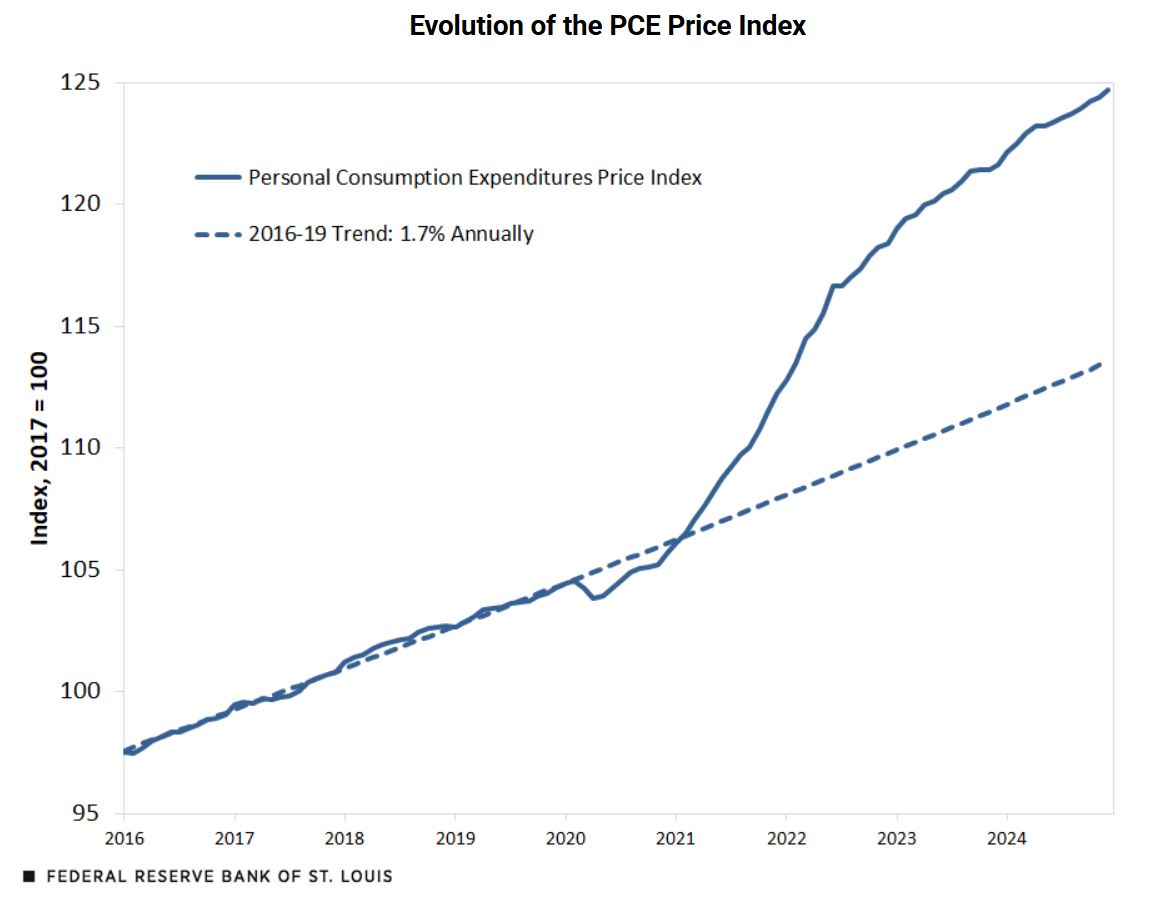
As you can see from the chart above, in the very beginning of the pandemic, prices actually dipped below where they were expected to be if they had just kept growing at that pre-pandemic 1.7% pace. This makes sense, right? Everyone was staying home, businesses were closed, and demand for many things dropped.
But then, things flipped. Starting in late 2020 and going all the way to mid-2022, prices took off like a rocket! We saw some of the highest inflation rates in decades. Since mid-2022, thankfully, the rate of price increases has slowed down. However, and this is the key takeaway, even though inflation is slower now, prices are still going up, just not as fast.
By the end of 2024, as the data shows, overall prices were about 10% higher than they would have been if we’d just stuck to that pre-pandemic trend. Think about that – ten extra dollars for every hundred you used to spend on the same basket of goods. That’s a real bite out of our wallets.
The Inflation Peak and the Road Down (…and Maybe a Plateau?)
Let's look at another key chart that shows the rate of inflation – how quickly prices are changing from one year to the next. This is often called headline inflation.
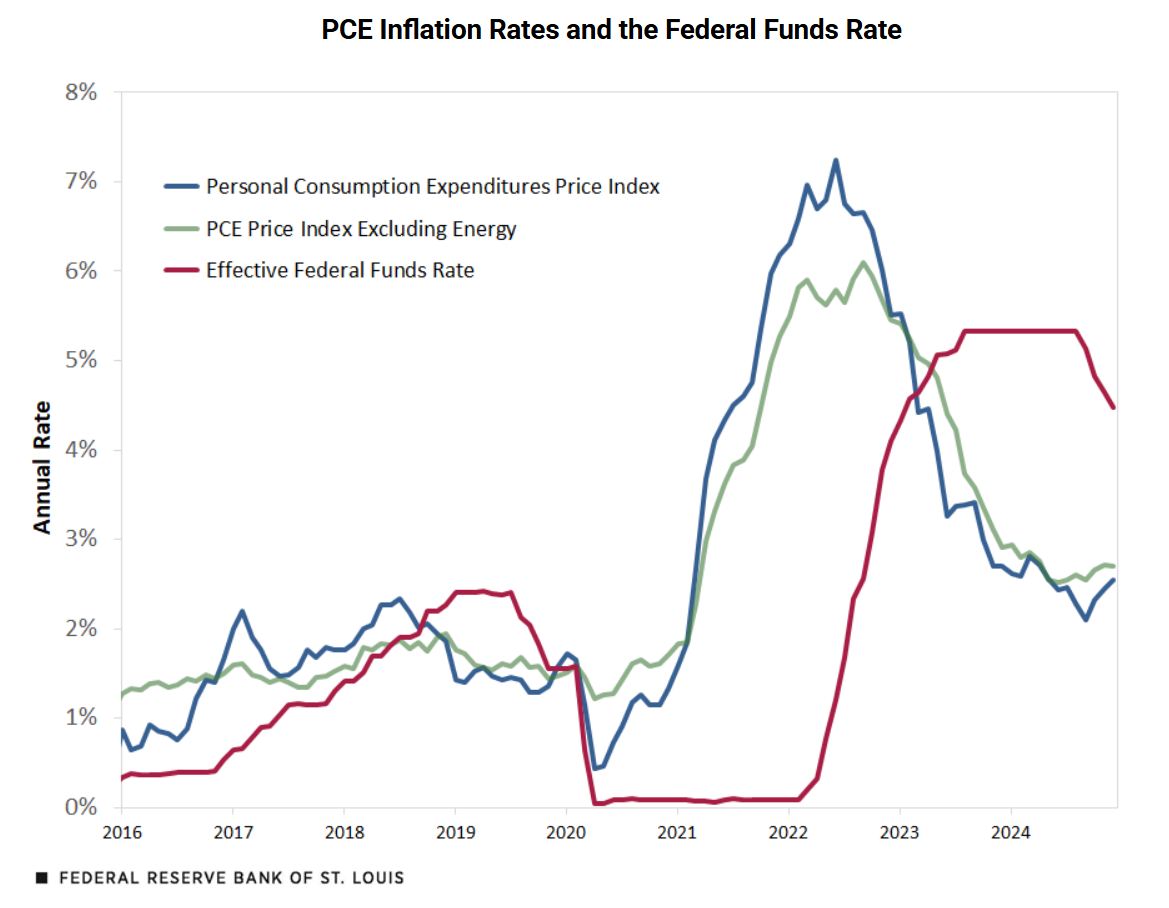
This second chart is really interesting because it shows both the overall inflation rate (the blue line) and the inflation rate when we take out energy prices (the green line). Energy prices, like gas and heating oil, can jump around a lot and sometimes give a misleading picture of what’s really happening with underlying inflation.
You can clearly see that sharp drop in inflation at the start of the pandemic, followed by that massive spike peaking in mid-2022. After that peak, the blue line shows inflation coming down pretty steadily. That's the good news! It means the really rapid price increases we saw are behind us.
However, if you look closely, especially at the green line (inflation excluding energy), something interesting pops out. While headline inflation (blue line) dropped quite a bit in 2024, a lot of that drop was because energy prices actually fell. If you take energy out of the picture, the green line shows that the progress in lowering inflation might have stalled a bit recently. That’s a bit concerning because it suggests that while lower gas prices are helping us feel a little relief, the underlying problem of higher prices across the board might still be stubbornly sticking around.
And look at that red line on the chart – that’s the federal funds rate. This is the interest rate that the Federal Reserve controls, and it's their main tool to fight inflation. Notice how for a long time, even as inflation was starting to rise in 2021, the Fed kept interest rates near zero? They didn't start raising rates until March 2022! In my opinion, that was a bit late. Many of us were wondering why they waited so long as prices were clearly climbing. Once they did start raising rates, though, they did it aggressively. Interest rates shot up and stayed high for a while. In late 2024, they started to bring rates down a little bit, signaling that maybe they felt they were starting to get inflation under control.
Is Inflation Just About a Few Things Going Up? Nope, It’s Broad-Based.
When inflation first started to take off, some people thought it was just because of a few specific things. Maybe it was just used cars getting expensive, or maybe it was just lumber prices going crazy. The idea was that these were temporary problems that would sort themselves out soon. This idea was often called “transitory inflation.”
But as 2021 went on, it became clear that inflation was much broader than just a few items. It wasn't just one or two things getting more expensive – it was lots of things. This is what we mean by broad-based inflation.
The Federal Reserve Bank of St. Louis provided another really helpful chart that shows this:
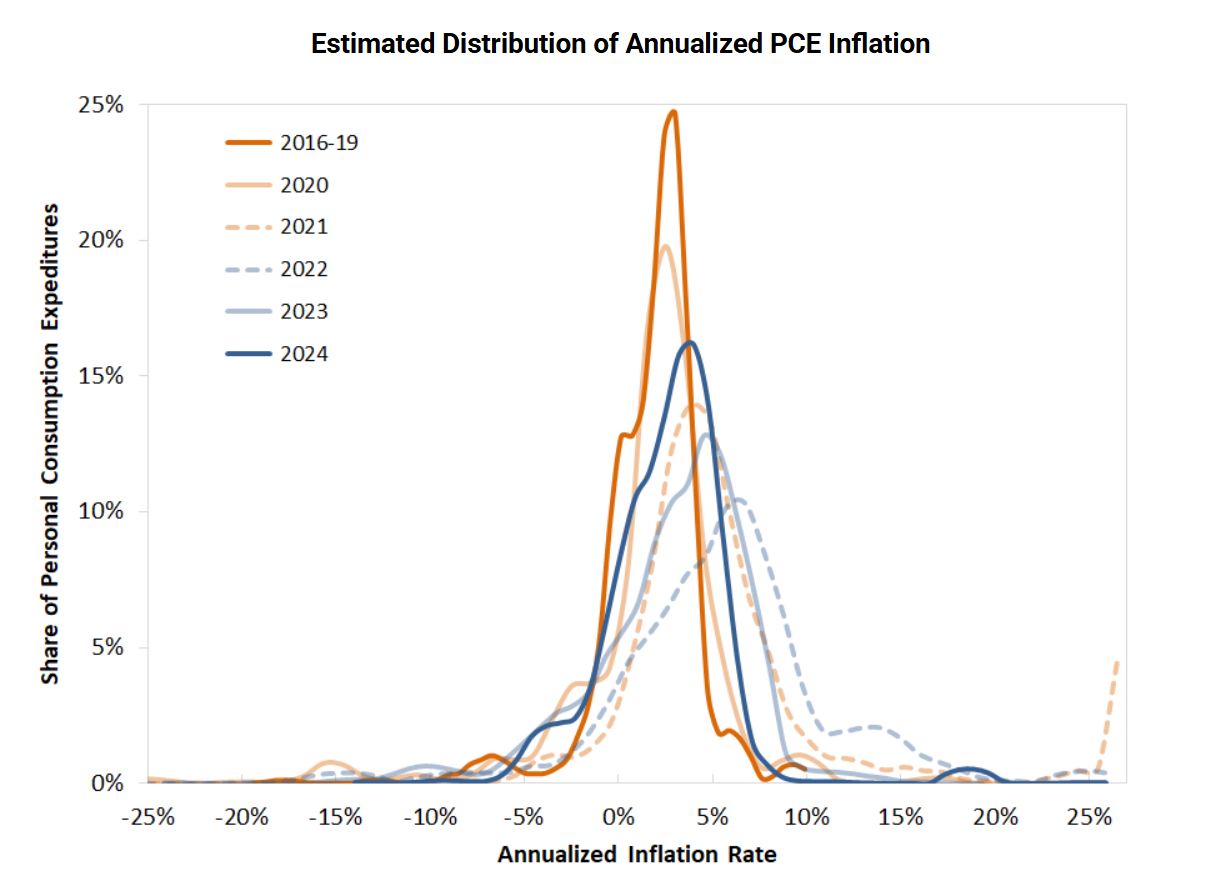
This chart might look a little complicated, but it’s actually quite insightful. Imagine each line in this chart as showing a snapshot of all the different things we buy in different years. The horizontal axis shows how much prices changed for each of those things, and the vertical axis shows how much of our spending goes to those items.
The orange line, representing 2016-2019, is our pre-pandemic benchmark. See how it's mostly clustered around the middle, around 0% to 5% inflation? That’s normal.
Now look at the lines for 2021 and 2022. These lines shift way over to the right. This means that in those years, a much larger share of the things we buy saw higher price increases than in the pre-pandemic years. Inflation wasn't just hitting a few categories; it was hitting almost everything.
Even in 2024, while the line has shifted back to the left a bit (good news!), it’s still significantly to the right of that pre-pandemic orange line. This tells us that even now, most of the things we buy are still experiencing higher inflation than they used to. It’s not just a few outliers anymore; it’s widespread. According to the data, about three-quarters of what we spend our money on in 2024 was still experiencing higher inflation than before the pandemic.
This broad-based nature of inflation is a key challenge. It means that getting back to 2% isn't just about fixing a few supply chain bottlenecks or waiting for one specific price to come down. It means we need to see a more general slowing of price increases across the entire economy.
Breaking It Down: Inflation by Product Category
To get even more specific, let's look at how inflation has behaved in different categories of things we buy. The Federal Reserve Bank of St. Louis provided a table that breaks this down:
| Annualized Inflation Rates by Product Category | Food | Energy | Core Goods | Core Services Excluding Housing | Housing | All |
|---|---|---|---|---|---|---|
| 2016-19 | 0.2% | 4.2% | -0.6% | 2.2% | 3.4% | 1.7% |
| 2020 | 3.9% | -7.7% | 0.1% | 2.0% | 2.2% | 1.3% |
| 2021 | 5.6% | 30.6% | 6.2% | 5.3% | 3.7% | 6.2% |
| 2022 | 11.1% | 6.7% | 3.2% | 4.9% | 7.7% | 5.5% |
| 2023 | 1.5% | -2.0% | 0.0% | 3.4% | 6.3% | 2.7% |
| 2024 | 1.6% | -1.1% | -0.1% | 3.5% | 4.7% | 2.6% |
Take a look at this table. Energy is the only major category where inflation was lower in 2024 than it was in the pre-pandemic period. This confirms what we saw in the charts – falling energy prices really helped bring down the overall inflation rate in 2024.
But look at everything else. Food prices are still rising faster than they were before. “Core goods” (things like appliances, furniture, clothes) actually saw deflation (prices going down) before the pandemic, but in 2024, they were essentially flat. “Core services excluding housing” (things like haircuts, transportation, entertainment) and “Housing” are all showing much higher inflation rates than they did before.
What this table really drives home is that inflation isn’t just an energy story. It’s impacting almost every part of our lives. Even though the overall inflation rate in 2024 was 2.6%, which is closer to the Fed’s 2% target, it's still significantly higher than the 1.7% we saw in 2016-2019. And importantly, that 2.6% is still above the Fed’s 2% goal.
So, Are We There Yet? The Verdict.
Let's circle back to our main question: The Road to 2% Inflation: Are We There Yet? Based on all this data, I think it's clear that we're not quite there yet. We've made real progress in bringing inflation down from those scary highs of 2022. Falling energy prices have been a big help. But when you dig deeper, you see that inflation is still pretty widespread across the economy, and in many key areas like housing and services, price increases are still running hotter than before the pandemic.
The Fed wants to see inflation at 2%. In 2024, we ended the year at 2.6%. That’s closer, but still a noticeable gap. And the fact that progress seems to have slowed down when you exclude energy prices is a bit worrying. It suggests that getting that last bit of inflation down to 2% might be the hardest part.
What caused this whole inflation mess in the first place? Well, that’s a whole other discussion, but the author of the data we've been looking at hints that the massive government spending during the pandemic, combined with very low interest rates from the Fed, played a big role. And with government spending still high, there might be more inflationary pressure to come.
For now, the road to 2% inflation feels like it's still under construction. We've traveled a good distance, but there might be more bumps and detours ahead before we reach our destination. We'll have to wait and see what the next set of inflation data tells us, but for now, I'm keeping a close eye on prices and hoping we can finally get back to that 2% target without too much more pain.
Navigate Economic Uncertainty with
Norada Real Estate Investments
Whether it's recession or inflation, turnkey real estate offers stability and consistent returns.
Diversify your portfolio with ready-to-rent properties designed to withstand economic fluctuations.
Speak with our expert investment counselors (No Obligation):
(800) 611-3060
Read More:
- Are We in a Recession or Inflation: Forecast for 2025
- Inflation's Impact on Home Prices & Mortgages: What to Expect in 2025
- Interest Rates vs. Inflation: Is the Fed Winning the Fight?
- Is Fed Taming Inflation or Triggering a Housing Crisis?
- Will Inflation Go Down Below 2% in 2025: Economic Forecast
- How To Invest in Real Estate During a Recession?
- Will There Be a Recession in 2025?
- When Will This Recession End?
- Should I Buy a House Now or Wait for Recession?