Wondering what's happening with the current Boise housing market trends? Here's the deal: the Boise housing market is seeing a bit of a reset this summer. Home prices are staying pretty steady, but the number of homes for sale is going up. This means buyers have more choices, and they're being a little pickier!
I've been watching the real estate scene here in Boise for a while now, and it's definitely been a wild ride. We went from a crazy seller's market to something a bit more balanced. Let's dig into the details to see what's really going on.
Current Boise Housing Market Update:
Home Sales
Good news for the market overall, the number of homes being sold has increased.
- According to recent data (We Know Boise), in Ada County, 855 homes were sold in July, which is a 17% increase compared to last year.
- Canyon County saw even bigger growth, with 488 homes sold, a 21% jump from the same time last year.
This tells us that people are still buying, even with everything else going on.
Home Prices
Okay, let's talk about the money. While we aren't seeing huge price jumps, they are inching up slightly.
- The average sold price in Ada County in July was $580,000, which is almost 2% higher than a year ago.
- In Canyon County, prices rose to $439,900, a 3.5% increase compared to last year.
So, prices aren't crashing, but they're not skyrocketing either. It’s a more stable situation than we've seen in recent years.
Are Home Prices Dropping?
In general, no. As we just covered, home prices are stable. Some sources even point to minor gains when comparing this year to last.
Housing Supply
This is where things get interesting. The number of homes available for sale is on the rise. We're seeing a change in Housing Supply.
- Ada County now has 2.94 months of supply.
- Canyon County isn't far behind with 2.92 months of supply.
Now, what does this mean? Basically, if no new homes came on the market, it would take about three months to sell all the houses currently listed. This increase in inventory is giving buyers more options.
Is Boise a Seller's Housing Market?
This is the million-dollar question! Technically, anything under 4 to 5 months of supply is still considered a seller's market. However, the trend is moving towards a more balanced market. Buyers have more negotiating power now than they did a year or two ago. It's not a screaming deal for buyers, but it's a much better position than they were in.
Market Trends
Let's break down some other key indicators:
| Indicator | Current Value | Change |
|---|---|---|
| Median List Price | $549,900 | Down 1.3% |
| Median Sold Price | $544,710 | Down 2.1% |
| Avg. Price per Square Foot | $335 | Up 6% |
| Total Home Sales | 324 | Up 58 |
| Median Days on Market | 9 | Unchanged |
| Available Homes for Sale | 2.43 Month Supply | Up 0.18 |
| 30-Year Mortgage Rate | 6.82% | Down 0.10 |
Here’s a peek at what’s happening in the Treasure Valley:
- Ada County: $580,000 (up 1.8%)
- Eagle: $899,890 (up 4%)
- Garden City: $511,950 (down 26.8%)
- Kuna: $472,500 (up 5%)
- Meridian: $565,000 (up 3.2%)
- Star: $622,727 (up 13.2%)
- Canyon County: $439,990 (up 3.5%)
- Caldwell: $405,000 (up 6.6%)
- Middleton: $529,950 (down 7%)
- Nampa: $421,782 (up 0.01%)
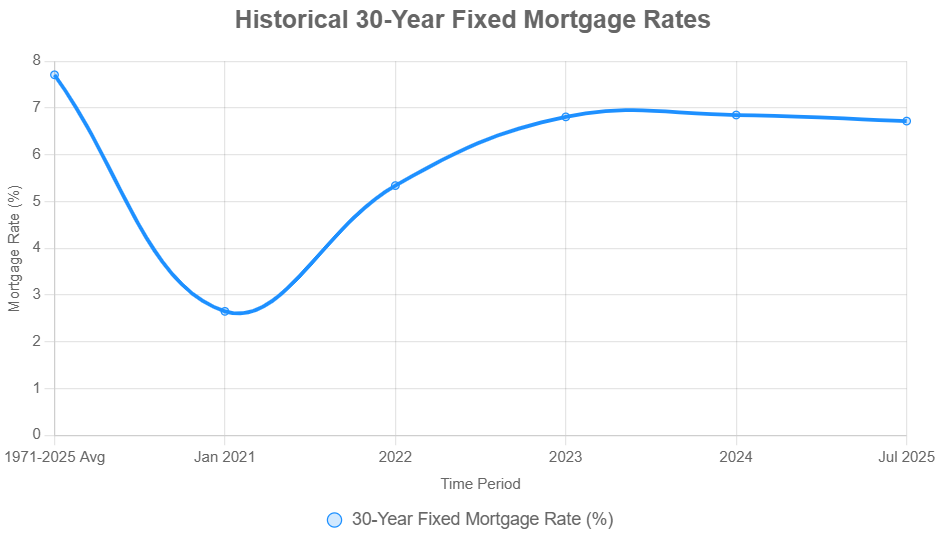
Impact of High Mortgage Rates
Okay, this is a big one. Mortgage rates definitely play a huge role in what's happening.
Currently, U.S. weekly averages as of 07/31/2025, the average 30-year fixed mortgage rate is around 6.72%, and the 15-Year FRM is about 5.85%, according to the Primary Mortgage Market Survey® by Freddie Mac. The 30-year fixed-rate mortgage showed little movement, remaining within the same narrow range for the fourth consecutive week.
These rates are definitely higher than what we saw a couple of years ago, and that makes a difference. Even so, activity tends to pick up when rates dip, purchase applications rose 25% compared to this time last year suggesting that some buyers are on the sidelines.
This is a pretty stable scenario for those looking to get a mortgage, and various forecasts predict the 30-year FRM rate will end 2025 between 6.0 to 6.5 percent. Borrowers should find comfort in the stability of mortgage rates, which have only fluctuated within a narrow 15-basis point range since mid-April.
Looking Ahead
The Boise housing market is always changing. As summer ends, things usually slow down a bit. With more homes for sale and buyers being careful because of higher rates, the next few months will show us what's coming this fall. If the number of homes for sale keeps growing without more people wanting to buy, we might see prices go down a little and homes take longer to sell.
In Conclusion: The current Boise housing market trends point to a shift towards a more balanced market. Prices are relatively stable, but inventory is increasing, giving buyers more choices. Mortgage rates are still a factor, but some buyers are finding opportunities, especially with new construction.
Boise Housing Market Forecast 2025-2026
Is the Boise housing market about to change? Well, here's the short answer: Experts predict a slight dip in home values in the near future, but nothing catastrophic. The current average home value in Boise City is $495,832, showing a modest increase of 0.4% over the past year. Homes are going into pending status in about 13 days. But what does the future really hold for Boise? Let's dig into what the experts are saying.
What Does the Data Say About Boise's Housing Prospects?
According to Zillow's latest forecast, the Boise housing market is expected to experience some adjustments over the next year. Here's a breakdown:
- July 2025: Zillow predicts a decrease of 0.5% in home values
- September 2025: The forecast indicates a further dip of 1.7%.
- June 2025 to June 2026: Over the next year, the anticipated decline is around 2.2%.
| Timeframe | Boise Real Estate Change |
|---|---|
| July 2025 | -0.5% |
| September 2025 | -1.7% |
| June 2025 – June 2026 | -2.2% |
How Does Boise Compare to Other Idaho Cities?
It's always good to see how Boise stacks up against other areas in the state. Here’s what Zillow projects for a few other Idaho metros:
| City | July 2025 | September 2025 | June 2025 – June 2026 |
|---|---|---|---|
| Coeur d'Alene | -0.2% | -0.6% | 0.1% |
| Idaho Falls | -0.6% | -1.7% | -1.3% |
| Twin Falls | -0.3% | -1.3% | -0.2% |
| Pocatello | -0.4% | -1.1% | 0.2% |
| Rexburg | -0.2% | -1.2% | -0.3% |
| Lewiston | -0.3% | -1.0% | -0.5% |
| Boise City | -0.5% | -1.7% | -2.2% |
As you can see, Boise is forecasted to have a steeper decline when compared with other regions of Idaho.
National Outlook: Brighter Days Ahead for Housing?
Looking beyond Idaho, what's the national picture? According to Lawrence Yun, chief economist for the National Association of Realtors (NAR), there’s reason for optimism. Here are some key predictions:
- Existing Home Sales: Expected to increase by 6% in 2025 and 11% in 2026.
- New Home Sales: Projected to rise by 10% in 2025 and another 5% in 2026.
- Median Home Prices: Forecasted to increase modestly by 3% in 2025 and 4% in 2026.
- Mortgage Rates: Anticipated to average 6.4% in the second half of 2025 and drop to 6.1% in 2026.
These are all positive signs that the overall housing market is on the path to recovery. Now the question is when?
Will Boise Home Prices Crash?
Based on the available data, a major crash in the Boise housing market seems unlikely; it's more of a modest correction. I believe the slight dip is more of a readjustment after the significant gains we've seen in recent years, rather than something to panic over.
Looking Ahead to 2026
While we only have specific projections until June 2026, if national forecasts ring positive, here's my gut feeling for the Boise housing market forecast into 2026: Once those mortgage rates decline, it could cause the market to level out. It might even cause the price to increase slightly.
The Bottom Line
It looks like Boise is adjusting. It's not going to be a wild ride, and with the nation experiencing “brighter days”, so will the Boise housing market in the future!
Should You Invest in the Boise Real Estate Market?
1. Population Growth and Trends
The first crucial factor to consider when contemplating real estate investment is the population growth and trends in Boise. As of the latest data, Boise has experienced a significant surge in population, with a growth rate well above the national average. This influx of residents is indicative of a thriving city, making it an attractive prospect for real estate investment.
2. Economy and Jobs
Boise's robust economy and job market play a pivotal role in determining the city's real estate potential. The region has seen consistent economic growth, driven by diverse industries. The presence of stable employment opportunities is a positive sign for real estate investors, as a strong job market contributes to increased housing demand.
3. Livability and Other Factors
Investors should also assess the livability of the city, considering factors such as education, healthcare, and recreational amenities. Boise consistently ranks high in livability indices, boasting quality schools, healthcare facilities, and a plethora of outdoor activities. A city with a high livability score tends to attract long-term residents, ensuring sustained demand for housing.
4. Rental Property Market Size and Growth
For real estate investors, the size and growth of the rental property market are critical considerations. Boise's rental market has expanded in tandem with its population growth, providing ample opportunities for investors. The demand for rental properties is on the rise, creating a favorable environment for those looking to capitalize on rental income.
Boise's rental market has witnessed a substantial increase in size in direct correlation with the city's population growth. As more individuals migrate to Boise, the demand for housing, particularly in the rental sector, has surged. This expansion in the market size not only signifies a robust housing demand but also presents a wealth of opportunities for investors to tap into a growing pool of tenants.
The growth trajectory of Boise's rental property market is a testament to the city's economic vitality and attractiveness. The consistent influx of residents, coupled with a thriving job market, has contributed to a sustained demand for rental properties. Investors looking for markets with a positive growth outlook will find Boise's rental sector aligning seamlessly with their objectives.
One of the key drivers of this growth is the booming local economy. Boise has become a hub for various industries, attracting professionals and individuals seeking employment opportunities. As these individuals relocate to the city, the need for rental accommodations intensifies, creating a dynamic and competitive rental property market.
Moreover, the rising demand for rental properties in Boise is not solely driven by population growth. The city's appeal as a desirable place to live, work, and raise a family contributes to a steady influx of residents. The quality of life, outdoor recreational options, and community amenities make Boise an attractive destination, enhancing the demand for rental housing options.
For investors, this scenario creates a favorable environment to capitalize on rental income. With a growing market and increasing demand, rental properties in Boise present a lucrative opportunity for both short-term and long-term returns on investment. The potential for rental appreciation and a consistent stream of tenants make Boise a strategic choice for those looking to build a robust and diversified real estate portfolio.
5. Other Factors Related to Real Estate Investing
Several additional factors contribute to Boise's allure for real estate investors. These include favorable real estate policies, a well-established real estate infrastructure, and a proactive local government supporting sustainable development. Investors should also keep an eye on market trends and forecasts to make informed decisions.