 As you have probably heard, China seems to be on the edge of a significant crash. This has prompted questions of how to predict and prepare for the next real estate market crash in the US. We've had a couple of suggestions that tracking NODs (Notice of Default – the first step in the foreclosure process) would be a good indication. We have no crystal balls but here are our thoughts.
There is probably no single, reliable technique for predicting the next real estate market crash because each crash has a different cause. More than once we've been asked if tracking NODs would be a good predictor of a coming crash. I believe tracking NODs will tell you what has already happened as opposed to what is going to happen.
Perhaps this metaphor will help explain my view. If you contract measles, you will likely have a red rash. However, by the time the red rash appears, you already have the virus and your options for preventing the virus are nonexistent. The rash is the same as NODs. By the time NODs ramp up, the economy is already well into the crash. There is also a long time lag between when the first payment is missed and the NOD is filed.
In Las Vegas during the 2008 crash, the time between when the first payment was missed and the NOD was filed was between 6 months to 3 years. So, we do not think that tracking NODs would be a good predictor. All the experts failed to predict the previous crashes and are likely to fail in future crashes. A much better approach is to prepare for the next crash.
In my opinion, the best way to prepare for a crash is careful selection of your investment properties. This includes the location, type and rent range. What I will cover in this article is the effects of rent range on rental income stability during times of economic stress.
Part of the necessary elements to achieve sustained profitability in investment real estate:
- A population of tenants that are unlikely to lose their jobs during reasonable instability.
- Good tenants – A good tenant as one who: pays all of the rent on schedule, takes care of the property, does not cause problems with neighbors, does not engage in illegal activities on the property and stays for multiple years. Please note that tenant quality does not necessarily correlate to rent rate.
Rental Sweet Spot
Each market has what I call a rental sweet-spot. This is the range of rents that has the largest population of potential tenants. I will explain “rental sweet-spot” later but first I will make some generalizations that I will use in the explanation. Remember that generalizations do not work for specific cases but are usually right more often than wrong. The assumptions I will use are:
- A property that rents for $500/mo. is generally less desirable than a property that rents for $1,000/mo. to the average tenant.
- People would choose to live in a property that rents for $1,000 than a property that rents for $500, if money were no barrier.
- If a person can afford $1,000/mo. rent, they are unlikely to want to rent a $500/mo. property.
- Except in special cases, people are unlikely to spend more than 30% of their monthly income on rent.
If you plotted the number of tenants who both:
- Wish to live in a property
- Can afford to live in that property
the number of prospective tenants by rental price would be something like the curve below.

For example, the left edge of the curve indicates that there are a relatively small number of renters who choose to live in low rent areas if they can afford better. And, there is a relatively small number of tenants that can afford to pay a very high rent. In real life, the curve would be flatter, wider or skewed to the left or right or even bi-modal but the concept does not change.
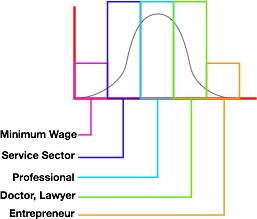
The green rectangle below brackets what I call the rental sweet-spot. Properties that rent in this rent range have the largest population of potential tenants (resulting in higher rent and lower time-to-rent) plus you are more likely to end up with the highest quality tenants. More about quality tenants later.

You could segment the curve by job/income level as shown below: (The following is a silly segmentation but bear with me.)

The tenants in each segment are subject to different market challenges. For example, if your rental properties targeted the minimum wage earners and as the minimum wage increases, if the number of available jobs are reduced, you are going to have decreased rents and increased time to rent. If you targeted entrepreneurs and the federal government increased the tax rate on high income earners to 90% they would no longer be able to afford such proprieties. The point is:
- Different rent ranges are likely to be affected by different market changes.
- To minimize the vulnerability to such market risk, you want to buy properties that fall into the rental sweet-spot because you will have the largest pool of potential tenants. If you do this, you are more likely to find tenants even in times of economic challenges.
Tenant Quality vs. Rent
I mentioned earlier what I consider to be the characteristics of a good tenant. Good tenants come from effective screening by the property manager, not from the rent range. So, if I targeted the “doctor/lawyer” segment (a property that is expensive to rent), I might have only one or two applicants to select from. If this is the case, the odds of getting a good tenant are reduced. If I target the sweet-spot I will have more applicants to select from and the odds of getting a good tenant are increased.
Summary
- Market crashes will occur in the future.
- It is very hard to predict a coming crash. All the “experts” missed the prior crashes and they will likely miss the next one.
- The best way to protect yourself from a future crash is to buy properties that will profitably rent in the rental sweet-spot so you have the largest number of potential tenants.
- Only careful screening by the property manager of a significant number of applicants will increase your odds of getting a good tenant.
What are your measures of weathering a real estate market crash?


