Norada Real Estate Investments

  • Home
  • Markets
  • Properties
  • Membership
  • Podcast
  • Learn
  • About
  • Contact

When Will Mortgage Rates Go Down to 3% or 2% Again?

August 28, 2025 by Marco Santarelli

Will Ultra-Low 2% and 3% Mortgage Rates Ever Return Again?

Many of us remember the days of super-low mortgage rates, when you could snag a 30-year fixed rate around 2% or 3%. Those days felt amazing, didn't they? But times have changed. So, will the mortgage rates drop to 2% or 3% rates again? The short answer is: it's highly unlikely, at least not anytime soon. While the average 30-year U.S. mortgage rate is fluctuating, dropping to its lowest level since October at 6.58%, we're a long way off the historic lows reached during the pandemic. Let's dive into why those amazing rates were a bit of an anomaly and what the future likely holds for homebuyers.

When Will Mortgage Rates Go Down to 3% or 2% Again?

Looking Back: How Rates Got So Low

To figure out where we're going, we need to understand where we've been. Mortgage rates have always danced to the tune of the economy, bouncing up and down based on things like inflation, how the Federal Reserve acts, and even global events.

  • The Bad Old Days: 1970s and 80s. Imagine paying 18% on your mortgage! That's what folks faced when inflation went wild. The Fed had to slam on the brakes hard to get things under control.
  • The Gradual Slide: 1990s and 2000s. Things calmed down, and rates slowly dropped. Then came the 2008 financial crisis. To help the economy, the Fed cut rates and started buying bonds. This pumped money into the system.
  • The Pandemic Plunge: 2020-2021. The Fed went all-in to fight the economic impact of COVID-19. They slashed rates to almost zero and bought even more bonds. This sent mortgage rates crashing. We saw that historic low of around 2.65%!

It was like a shot of adrenaline for the housing market. Everyone was buying! Prices went through the roof, and people were saving tons of money by refinancing. But, like all good things, it couldn't last forever.

Where Are We Now? (August 2025)

Fast forward to today. The average 30-year fixed rate is around 6.58%. That's a big jump from the 2% to 3% range. While we've seen that decline to it's lowest since October, rates are still twice as high as they were during the pandemic. What happened?

  • Inflation Strikes Back. As the economy recovered, inflation started to rise. All that government stimulus and supply chain problems made things more expensive. The Fed had to respond.
  • The Fed Gets Tough. To fight inflation, the Fed started raising the federal funds rate. This rate influences other interest rates, including mortgage rates. They also stopped buying bonds.

This chart shows how rates have changed over time:

Year Average 30-Year Fixed Rate (%)
1981 (Peak) 18+
2000 8+
2010 5+
2021 (Low) 2.65
2023 6.8
Today (Aug 2025) 6.58

What's Driving Mortgage Rates Now?

It's not just the Fed's actions. Several things work together to push mortgage rates up or down:

  1. The Federal Reserve (Again): The Fed controls the federal funds rate, which influences short-term rates. If the Fed suggests upcoming rate cuts, it can signal future easing, but this depends on managing inflation risks.
  2. Inflation: Keeping an eye on inflation is critical. If inflation stays high, rates are less likely to fall significantly. PCE inflation has been projected at 3.0% for 2025, which is down but still above the Fed's target.
  3. Economic Growth and Bond Yields: Economic growth impacts Treasury yields. Strong growth can push yields higher, which then translates to higher mortgage rates.
  4. Global Events: Trade wars and political uncertainty can also impact rates.

What the Experts Say

I've been following this stuff for a while, and most experts don't think we'll see those ultra-low rates again anytime soon. I agree with them. Unless there's a major economic disaster, it's unlikely we'd see a return to rates below 4%.

  • Consensus View: Most economists believe rates will stay above 6% for a while, possibly easing to 5-6% if inflation cools off.
  • Possible Scenarios: If the economy slows down a lot, the Fed might cut rates faster, and we could see rates drop more. But that's not the most likely case.

My Opinion: I think that ultra-low rates were a once-in-a-lifetime event. They were a response to a very specific situation.

How This Affects the Housing Market

Higher rates have definitely cooled things down. It's harder for people to afford homes, so sales have slowed. Some people who locked in low rates are hesitant to sell, which means fewer homes on the market.

  • Affordability Crisis: Many potential buyers are priced out of the market.
  • Inventory Shortage: The “lock-in effect” keeps homeowners from selling.


Related Topics:

30-Year Fixed Rate Mortgage Drops to Lowest Level This Week

Mortgage Rates Predictions Next 60 Days

Mortgage Rates Predictions for the Next 6 Months: August to December 2025

Mortgage Rates Predictions Next 90 Days: August to October 2025

Here's What You Can Do

So, what if you're looking to buy a home or refinance? Don't despair! There are still options:

  1. Consider an Adjustable-Rate Mortgage (ARM): ARMs usually have lower initial rates. This can be a good option if you don't plan to stay in the home for a long time.
  2. Look for Assistance Programs: First-time buyer programs can help with down payments and closing costs. FHA, VA, and USDA loans are examples of that.
  3. Shop Around: Get quotes from multiple lenders and see if you can buy points to lower your rate. Paying for points can potentially reduce your rate.
  4. Refinance Wisely: If rates drop in the future, consider refinancing to a shorter term or taking cash out.
  5. Explore Home Equity Options: A HELOC or Home Equity Loans can be used for repairs so you aren't using your current mortgage.
  6. Improve Your Credit: The better your credit score, the better the rate you'll get.

The Bottom Line: Be Realistic

I said that the current state is highly unlikley to return, and I still believe that. Ultra-low rates were an exception, not the rule. Don't wait around for them to come back. Instead, focus on what you can control: your credit score, your down payment, and your budget.

Be smart, be patient, and you'll find the right opportunity.

Capitalize Amid Rising Mortgage Rates

With mortgage rates expected to remain high in 2025, it’s more important than ever to focus on strategic real estate investments that offer stability and passive income.

Norada delivers turnkey rental properties in resilient markets—helping you build steady cash flow and protect your wealth from borrowing cost volatility.

HOT NEW LISTINGS JUST ADDED!

Speak with a seasoned Norada investment counselor today (No Obligation):

(800) 611‑3060

Get Started Now

Also Read:

  • Will Mortgage Rates Go Down in 2025: Morgan Stanley's Forecast
  • Mortgage Rate Predictions 2025 from 4 Leading Housing Experts
  • Mortgage Rate Predictions for the Next 3 Years: 2026, 2027, 2028
  • 30-Year Fixed Mortgage Rate Forecast for the Next 5 Years
  • 15-Year Fixed Mortgage Rate Predictions for Next 5 Years: 2025-2029
  • Will Mortgage Rates Ever Be 3% Again in the Future?
  • Mortgage Rates Predictions for Next 2 Years
  • Mortgage Rate Predictions for Next 5 Years
  • How Lower Mortgage Rates Can Save You Thousands?
  • How to Get a Low Mortgage Interest Rate?
  • Will Mortgage Rates Ever Be 4% Again?
Filed Under: Financing, Mortgage Tagged With: Interest Rate, mortgage, Mortgage Rate Trends, mortgage rates, Mortgage Rates Today

Mortgage Rates Today: 30-Year Fixed Refinance Rate Drops by 5 Basis Points

August 28, 2025 by Marco Santarelli

Mortgage Rates Drop: Today's 30-Year Fixed Refinance Rate Goes Down by 23 Basis Points

Are you keeping an eye on mortgage rates like I am? It's a wild ride, but here's the good news: the average 30-year fixed refinance rate has dipped slightly. As of today, August 28, 2025, the national average stands at 6.83%, according to Zillow. That's a 5 basis point drop from last week's average of 6.88%. While it's not a massive plunge, any decrease is welcome news for homeowners considering a refinance.

Mortgage Rates Today: 30-Year Fixed Refinance Rate Goes Down by 5 Basis Points

What the Current Mortgage Rate Picture Looks Like

Let's break down the specifics a little further. While the 30-year fixed rate saw a modest decrease, other popular refinance options are holding steady:

  • 30-Year Fixed Refinance Rate: 6.83% (down 5 basis points)
  • 15-Year Fixed Refinance Rate: 5.61% (unchanged)
  • 5-Year ARM Refinance Rate: 7.32% (unchanged)

While the drop in 30 year fixed rate maybe a reason to cheer up, there will be some questions popping in your head about the economic outlook. Let's get them clarified subsequently to help you build your knowledge.

Is Refinancing at 6.83% a Smart Move?

That's the million-dollar question, isn't it? The answer, as always, depends entirely on your individual circumstances. Here's what I consider when advising people I know:

  • Your Current Mortgage Rate: If you're paying significantly higher than 6.83%, refinancing could save you money over the long term.
  • How Long You Plan to Stay: Refinancing involves costs. If you plan to move in a year or two, the savings might not outweigh the fees.
  • Your Financial Situation: Lenders will look at your credit score, debt-to-income ratio, and overall financial health.
  • Closing Costs: These can add up! Factor them into your calculations to see if refinancing makes sense.

A Quick Example

Let's say you have \$300,000 left on your mortgage at 7.5%. Refinancing to 6.83% could potentially save you hundreds of dollars per month. Use a mortgage refinance calculator to get a personalized estimate. Do you know that as rates fluctuate, the savings also change?

Peering into the Crystal Ball: Mortgage Rate Forecasts

No one has a perfect crystal ball, but economic forecasts can give us a general idea of where mortgage rates might be headed:

  • National Association of REALTORS®: Expects rates to average 6.4% in the second half of 2025 and 6.1% in 2026. They see lower rates as a “magic bullet” for the housing market.
  • Realtor.com: Anticipates a slow easing of rates, potentially reaching 6.4% by year-end.
  • Fannie Mae: Projects rates to end 2025 at 6.5% and 2026 at 6.1%. They've also revised their mortgage origination forecasts slightly downwards.
  • Mortgage Bankers Association: Predicts rates will remain around 6.8% through September 2025, then settle in the mid-6% range for the rest of the year, ending near 6.7%. They foresee rates holding steady around 6.3% into 2026.

Forecasts Table

Source End of 2025 End of 2026
National Association of REALTORS® 6.4% 6.1%
Realtor.com 6.4% Not Provided
Fannie Mae 6.5% 6.1%
Mortgage Bankers Association 6.7% 6.3%

The Fed's Role: More Important Than Ever

The Federal Reserve's actions are the biggest influence on mortgage rates. Here's a recap of how they've impacted rates recently:

  • Pandemic Era: The Fed's bond-buying program kept rates artificially low.
  • 2022-2023: To combat inflation, the Fed aggressively raised the federal funds rate, pushing mortgage rates to 20-year highs.
  • Late 2024: After holding steady, the Fed cut rates three times.
  • 2025 (So Far): The Fed has paused rate hikes, but internal divisions suggest a potential shift.

The market currently anticipates a rate cut at the Fed's September 16-17 meeting. This expectation is based on:

  • Cooling Inflation: CPI has moderated, moving closer to the Fed's target.
  • Weakening Labor Market: Unemployment is rising, and job growth is slowing.
  • Predicted Slowdown: Economic forecasts point to a cooldown.

All you have to do is keep an eye on Fed Chair Jerome Powell's speech at the Jackson Hole Economic Symposium on August 22.

What a Fed Rate Cut Could Mean for You

A September rate cut is widely expected to finally trigger a more sustained decline in mortgage rates. This could:

  • Lower borrowing costs across the economy.
  • Spur business investment.
  • Create movements in stock and bond markets.

Keep in Mind!!!

While a September cut is highly probable, it's not guaranteed. Lingering inflation or unexpected economic strength could change the Fed's mind.

Key Dates and Scenarios to Watch

  • September 16-17 Meeting: The next critical point. Watch for updated economic projections.
  • December Meeting: Another potential opportunity for a rate cut.
  • Long-Term: The Fed anticipates gradually easing, with rates potentially near 2.25%-2.5% by 2027.

Recommended Read:

Mortgage Rates August 27, 2025: 30-Year Fixed Refinance Rate Goes Down by 13 Basis Points

Best Time to Refinance Your Mortgage: Expert Insights

Should I Refinance My Mortgage Now or Wait Until 2026? 

What does all this mean for different people?

Current Buyers: Relief might be on the horizon! Be ready to act when rates drop.

Refinancers: If you're paying over 7%, keep a close eye on the September meeting. A rate cut could be your sign to refinance.

Investors: Bond markets are volatile, so stay informed of Fed rhetoric. A confirmed rate cut would likely push yields lower.

My Final Thoughts

While a 5 basis point drop is modest, it's a step in the right direction. The upcoming Fed meeting is a crucial event that could significantly impact mortgage rates. As always, do your research, consider your individual circumstances, and consult with a financial advisor before making any decisions. I'll be keeping my eye on the market and will update you with any more interesting developments!

Maximize Your Mortgage Decisions in 2025

Thinking about whether to refinance now? Timing is critical, and having the right strategy can save you thousands over the life of your loan.

Norada's team can guide you through current market dynamics and help you position your investments wisely—whether you're looking to reduce rates, pull out equity, or expand your portfolio.

HOT NEW LISTINGS JUST ADDED!

Talk to a Norada investment counselor today (No Obligation):

(800) 611-3060

Get Started Now

Recommended Read:

  • When You Refinance a Mortgage Do the 30 Years Start Over?
  • Should You Refinance as Mortgage Rates Reach Lowest Level in Over a Year?
  • NAR Predicts 6% Mortgage Rates in 2025 Will Boost Housing Market
  • Mortgage Rates Predictions for 2025: Expert Forecast
  • Half of Recent Home Buyers Got Mortgage Rates Below 5%
  • Mortgage Rates Need to Drop by 2% Before Buying Spree Begins
  • Will Mortgage Rates Ever Be 3% Again: Future Outlook
  • Mortgage Rates Predictions for Next 2 Years
  • Mortgage Rate Predictions for Next 5 Years
  • Mortgage Rate Predictions for 2025: Expert Forecast

Filed Under: Financing, Mortgage Tagged With: mortgage, mortgage rates, Mortgage Refinance Rates

Mortgage Rates Today: 30-Year Fixed Refinance Rate Goes Down by 13 Basis Points

August 27, 2025 by Marco Santarelli

Mortgage Rates Drop: Today's 30-Year Fixed Refinance Rate Goes Down by 23 Basis Points

If you're thinking about refinancing your home, you're probably glued to mortgage rate updates. The good news is that as of Wednesday, August 27, 2025, the national average for a 30-year fixed refinance rate has decreased to 6.75%, a drop of 13 basis points from the previous week. Let’s break down what this means for you and how the current economic climate is influencing these fluctuations.

Mortgage Rates Today: 30-Year Fixed Refinance Rate Goes Down by 13 Basis Points

What's Happening with Refinance Rates Right Now?

According to Zillow data, here’s the snapshot as of today:

  • 30-Year Fixed Refinance Rate: 6.75% (Down 13 basis points from last week)
  • 15-Year Fixed Refinance Rate: 5.70% (Up 3 basis points)
  • 5-Year ARM Refinance Rate: 7.27% (Down 14 basis points)

It’s interesting to see the 30-year rate moving downward, while the 15-year rate nudges slightly upward. This shows there are complexities in the market that go deeper than just an overall trend. If you're wondering whether it's a good time to refinance, there's a lot to consider.

Is It Worth Refinancing Today?

Frankly, that's the million-dollar question! Whether refinancing makes sense for you depends on your current mortgage rate, your financial goals, and what the future holds.

  • If you have a rate significantly higher than 6.75%: Refinancing could save you a considerable amount of money over the life of the loan.
  • If you're looking to shorten your loan term: Even with a slightly higher interest rate (as we see with the 15-year), the faster equity build-up could be worth it.
  • If you need to tap into your home equity: A cash-out refinance could provide the funds you need, but carefully weigh the costs and risks.

What Are the Experts Saying About Where Rates Are Headed?

Okay, so rates dipped a little. Is this the start of a big fall, or just a blip? Let’s peek at what forecasters are predicting. I've been following these trends for years, and I've learned to take forecasts with a grain of salt. But they can give us a general idea.

  • National Association of REALTORS®: Expects mortgage rates to average 6.4% in the second half of 2025, and then drop further to 6.1% in 2026. Their chief economist even called mortgage rates a “magic bullet” for the market, emphasizing their impact on affordability.
  • Realtor.com: Predicts mortgage rates will ease slowly, averaging around 6.4% by the end of the year.
  • Fannie Mae: Slightly more conservative, forecasting rates to end 2025 at 6.5% and 2026 at 6.1%. They also adjusted their mortgage origination forecasts slightly downward to $1.85 trillion in 2025 and $2.26 trillion in 2026.
  • Mortgage Bankers Association (MBA): Believes rates will remain mostly unchanged near 6.8% through September 2025, before settling in the mid-6% range (6.4%-6.6%) later in the year. They expect this to hold steady into 2026.

Factors Influencing Mortgage Rates: What's Under the Hood?

Several moving parts influence mortgage rates. It's not just about one number going up or down.

Here's what's important:

  • Inflation: High inflation generally leads to higher mortgage rates.
  • Economic Growth: A strong economy can put upward pressure on rates.
  • Federal Reserve Policy: The Fed's actions have a HUGE impact.
  • Global Events: Unexpected events can send ripples through financial markets, affecting rates both positively and negatively.

The Federal Reserve's Next Move: Will They Cut Rates in September?

This is the question on everyone's mind, and for good reason. The Federal Reserve's monetary policy decisions are the main drivers of mortgage rates.

Here's the scoop in mid-2025:

  • From Rate Hikes to a Pause: After aggressively raising rates in 2022-2023 to fight inflation, the Fed has been holding steady in 2025.
  • Pressure to Cut: Some members of the Fed are now pushing for rate cuts to address a slowing economy.
  • Economic Crosscurrents: Inflation is proving stubborn, but economic growth is slowing down. This puts the Fed in a tough spot.
  • Market Expectation: There's a strong expectation (85-95% chance) for a rate cut at the September 16-17 meeting. This is based on moderating inflation and a weakening labor market.

All eyes are on Fed Chair Jerome Powell's speech at the Jackson Hole Economic Symposium on August 22. This could provide clues about the Fed's September decision, which might start a sustained downward trend in borrowing costs.

Recommended Read:

Mortgage Rates August 26, 2025: 30-Year Fixed Refinance Rate Goes Down by 2 Basis Points

Best Time to Refinance Your Mortgage: Expert Insights

Should I Refinance My Mortgage Now or Wait Until 2026? 

What This Means for Those Looking to Refinance: Scenarios to Consider

So, how should you play this? Let's look at a few possible situations.

  • Current Buyers: If you're in the market to buy, be patient. A rate cut in September could provide some relief, making homes slightly more affordable.
  • Refinancers with Rates Above 7%: Monitor the September Fed meeting closely. If rates drop, it could be a great time to refinance.
  • Investors: Bond markets are likely to respond to any Fed action. Keep an eye on the 10-year Treasury yield.

Key Dates to Watch:

Date Event Potential Impact
August 22, 2025 Fed Chair Powell's Speech at Jackson Hole Economic Symposium Hints about September rate decision
September 16-17, 2025 Federal Reserve Meeting Potential interest rate cut, updated economic projections
December 2025 Federal Reserve Meeting Possible second interest rate cut of 2025 to complete the cycle.

My Take:

While the recent dip in the 30-year fixed refinance rate is encouraging, it's crucial to stay informed and not jump to conclusions. The market is still volatile, and the Fed's next move will be a key factor.

Remember, your financial situation is unique. Consult with a financial advisor or mortgage professional to determine the best course of action for you. Don't just chase the lowest rate; consider the long-term implications and costs.

Maximize Your Mortgage Decisions in 2025

Thinking about whether to refinance now? Timing is critical, and having the right strategy can save you thousands over the life of your loan.

Norada's team can guide you through current market dynamics and help you position your investments wisely—whether you're looking to reduce rates, pull out equity, or expand your portfolio.

HOT NEW LISTINGS JUST ADDED!

Talk to a Norada investment counselor today (No Obligation):

(800) 611-3060

Get Started Now

Recommended Read:

  • When You Refinance a Mortgage Do the 30 Years Start Over?
  • Should You Refinance as Mortgage Rates Reach Lowest Level in Over a Year?
  • NAR Predicts 6% Mortgage Rates in 2025 Will Boost Housing Market
  • Mortgage Rates Predictions for 2025: Expert Forecast
  • Half of Recent Home Buyers Got Mortgage Rates Below 5%
  • Mortgage Rates Need to Drop by 2% Before Buying Spree Begins
  • Will Mortgage Rates Ever Be 3% Again: Future Outlook
  • Mortgage Rates Predictions for Next 2 Years
  • Mortgage Rate Predictions for Next 5 Years
  • Mortgage Rate Predictions for 2025: Expert Forecast

Filed Under: Financing, Mortgage Tagged With: mortgage, mortgage rates, Mortgage Refinance Rates

Today’s Mortgage Rates – August 27, 2025: Rates Drop Overall Across the Spectrum

August 27, 2025 by Marco Santarelli

Today's Mortgage Rates - August 27, 2025: Rates Drop Overall Across the Spectrum

Mortgage rates today on August 27, 2025, have fallen slightly across the board, with the national average 30-year fixed mortgage rate dipping to 6.59%—down 8 basis points from last week’s 6.67% (source: Zillow). This small but notable decline is mirrored in 15-year fixed and 5-year ARM rates as well. Refinance rates have also dropped, with the 30-year fixed refinance rate down to 6.75%, marking a 13 basis-point decrease from the previous week. These trends reflect growing market expectations of a Federal Reserve interest rate cut in September, which could bring further reductions in mortgage borrowing costs.

Today's Mortgage Rates – August 27, 2025: Rates Drop Overall Across the Spectrum

Key Takeaways

  • 30-year fixed mortgage rates today average 6.59%, down from 6.67% last week (Zillow).
  • 15-year fixed rates dropped to 5.65%, and 5-year ARM rates decreased to 6.74%.
  • 30-year fixed refinance rates fell to 6.75%, a big 13 basis-point drop week over week.
  • Federal Reserve widely anticipated to cut interest rates in September 2025, likely lowering mortgage rates further.
  • Experts expect rates to stay above 6% through 2025, with forecasts predicting a gradual decline toward 6.1%-6.4% into 2026.
  • Government loan rates show mixed moves—VA loans trending lower; FHA loans slightly higher.

Current Mortgage Rates: An In-Depth Look

Let’s review today's mortgage rates by loan type (Zillow, August 27, 2025):

Loan Type Rate 1-Week Change APR 1-Week Change
30-Year Fixed Rate 6.59% Down 0.08% 7.08% Down 0.03%
20-Year Fixed Rate 6.43% No Change 6.94% Up 0.03%
15-Year Fixed Rate 5.65% Down 0.12% 5.98% Down 0.08%
10-Year Fixed Rate 5.79% No Change 6.09% No Change
7-Year ARM 6.63% Down 0.57% 7.59% Down 0.16%
5-Year ARM 6.74% Down 0.39% 7.53% Down 0.20%

Government loans show some variation:

Loan Type Rate 1-Week Change APR 1-Week Change
30-Year Fixed FHA 6.75% Up 0.73% 7.78% Up 0.75%
30-Year Fixed VA 5.91% Down 0.30% 5.99% Down 0.43%
15-Year Fixed FHA 5.25% Down 0.30% 6.21% Down 0.30%
15-Year Fixed VA 5.54% Down 0.30% 5.68% Down 0.52%

Refinance Rates: Big Drops Signal Opportunity

Refinance borrowers saw significant rate decreases this week (Zillow, August 27, 2025):

Refinance Loan Type Rate 1-Week Change APR 1-Week Change
30-Year Fixed Refinance 6.75% Down 0.11% N/A N/A
15-Year Fixed Refinance 5.70% Up 0.03% N/A N/A
5-Year ARM Refinance 7.27% Down 0.14% N/A N/A

This marked drop in refinance rates is driven by expectations of an upcoming Federal Reserve rate cut, making refinancing more appealing for homeowners who locked in higher rates last year.

Why Are Mortgage Rates Falling? The Fed Factor

Mortgage rates largely move in sync with the broader interest rate environment influenced by the Federal Reserve’s monetary policy. Here’s what’s driving today’s rates downward:

  • Weak Job Growth: Economic reports in early August showed slowing employment gains, signaling a cooling labor market. This reduces pressure on the Fed to keep rates high to curb inflation.
  • Sticky But Moderating Inflation: Inflation data indicated prices rising slower than expected, easing urgency for aggressive rate hikes.
  • Fed Rate Cut Expectations: The CME FedWatch Tool now shows an 89-91% probability of the Fed cutting the federal funds rate by 25 basis points in their upcoming September meeting. Such a move usually leads to lower mortgage rates.

The Federal Reserve’s recent rate history and outlook is critical to understanding today’s mortgage numbers:

  • From 2021 through mid-2023, the Fed raised rates sharply to fight inflation, lifting mortgage rates into the 6.6%-6.8% range seen for much of 2025.
  • After a long plateau in 2025, the market identifies a significant chance for cuts beginning in September to spur the economy as growth slows.
  • This anticipated “pivot” is expected to bring mortgage rates down gradually, possibly dipping below 6% by late 2026, based on Fannie Mae and Realtor.com forecasts.

Mortgage Rate Forecasts for the Rest of 2025 and Beyond

Different reputable organizations offer varying but broadly consistent forecasts for mortgage rates in the near term:

Source 2025 Year-End Forecast 2026 Forecast Notes
Fannie Mae (Aug 2025) ~6.5% ~6.1% Modest upward revision from July; origination increases expected
Realtor.com ~6.4% Not specified Anticipates steady easing
Mortgage Bankers Assoc. 6.7% ~6.3% Rate holding steady, mid-6% range due to inflation worries
National Assoc. of REALTORS® 6.4% 6.1% Emphasizes rates as a “magic bullet” impacting affordability

While the consensus points to rates staying above 6% this year, markets are watching closely for signs the Fed’s September rate cut will trigger a more significant drop. This aligns with the expectation that mortgage rates are unlikely to return to the historic lows of early 2020 but may slowly ease toward more affordable levels in 2026.

Understanding How These Rates Impact Borrowers: Example Calculations

To clarify the impact of these rate changes, here’s a comparison of monthly payments on a $300,000 mortgage for two scenarios:

Loan Term & Rate Monthly Principal & Interest Total Interest Over 30 Years
30-Year Fixed at 6.67% (Last Week) $1,936 $395,616
30-Year Fixed at 6.59% (Today) $1,914 $389,040

Difference: $22 per month less, saving $6,576 in interest across the life of the loan, just from an 8 basis point rate drop.

If the Fed cuts rates as expected in September and mortgage rates fall closer to 6%, monthly payments could drop even more substantially — a meaningful impact for homebuyers and those considering refinancing.


Related Topics:

Mortgage Rates Trends as of August 26, 2025

Mortgage Rates Predictions Next 90 Days: August to October 2025

Mortgage Rates Predictions for the Next 60 Days

Mortgage Rates Predictions for Next 90 Days: July-Sept 2025

Longer-Term Outlook: Federal Reserve’s Strategy and Inflation Impact

The Fed’s monetary policy plays a decisive role in shaping mortgage rates. After hiking aggressively to tackle inflation, the Fed paused in 2025 due to signs of economic slowdown and persistent inflation near 2.7%. The Fed's next moves:

  • September 2025: Likely rate cut of 0.25% to support the cooling economy.
  • December 2025: Possible additional cut to continue easing financial conditions.
  • 2026: Gradual approach to rate cuts with a longer-term target for the federal funds rate near 2.25%-2.5%.

This path reflects balancing growth slowdown concerns with inflation risks. How inflation behaves will be a key factor influencing mortgage rates beyond 2025.

Final Thoughts on Mortgage Rates Today

Mortgage rates today are inching downward, influenced by labor market softness and inflation data that point toward a Federal Reserve interest rate cut in September. For borrowers, these small declines already translate into meaningful savings on monthly payments, with further decreases expected if the Fed follow through.

Despite these promising signs, most forecasts agree rates will remain above 6% through 2025, only gradually falling to more borrower-friendly levels in 2026. This marks a shift from the historic low-rate environment of recent years, requiring borrowers and investors alike to carefully monitor economic data and Fed actions in the coming months.

Capitalize Amid Rising Mortgage Rates

With mortgage rates expected to remain high in 2025, it’s more important than ever to focus on strategic real estate investments that offer stability and passive income.

Norada delivers turnkey rental properties in resilient markets—helping you build steady cash flow and protect your wealth from borrowing cost volatility.

HOT NEW LISTINGS JUST ADDED!

Speak with a seasoned Norada investment counselor today (No Obligation):

(800) 611‑3060

Get Started Now

Also Read:

  • Will Mortgage Rates Go Down in 2025: Morgan Stanley's Forecast
  • Mortgage Rate Predictions 2025 from 4 Leading Housing Experts
  • Mortgage Rate Predictions for the Next 3 Years: 2026, 2027, 2028
  • 30-Year Fixed Mortgage Rate Forecast for the Next 5 Years
  • 15-Year Fixed Mortgage Rate Predictions for Next 5 Years: 2025-2029
  • Will Mortgage Rates Ever Be 3% Again in the Future?
  • Mortgage Rates Predictions for Next 2 Years
  • Mortgage Rate Predictions for Next 5 Years
  • Mortgage Rate Predictions: Why 2% and 3% Rates are Out of Reach
  • How Lower Mortgage Rates Can Save You Thousands?
  • How to Get a Low Mortgage Interest Rate?
  • Will Mortgage Rates Ever Be 4% Again?
Filed Under: Financing, Mortgage Tagged With: Interest Rate, mortgage, Mortgage Rate Trends, mortgage rates, Mortgage Rates Today

Is the Florida Housing Market on the Edge of a Crash or Downturn?

August 27, 2025 by Marco Santarelli

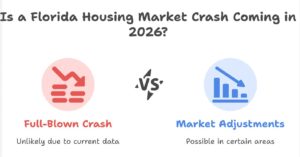
Is a Florida Housing Market Crash Coming in 2026?

Let’s talk about the big question on everyone’s mind here in the Sunshine State: Will the Florida housing market crash in 2026? After looking at the latest data and talking to folks who make it their business to understand these things, my take is that a full-blown crash – meaning a sharp, widespread drop in prices like we saw in 2008 – is unlikely in Florida by 2026.

However, that doesn't mean we won't see some bumps and even some price drops in certain areas. Things are definitely shifting from the red-hot market of a few years ago into a more balanced, and dare I say, more normal, environment.

Is the Florida Housing Market on the Edge of a Crash or Downturn?

As someone who's kept a close eye on Florida real estate for a while, I've seen it go through its ups and downs. Right now, what I’m seeing is not a panic situation, but a market that’s maturing. The frenzy might be over, but that doesn’t automatically mean a collapse is coming. It’s more about a recalibration after a period of intense growth. The August 2025 data from Cotality (formerly CoreLogic) paints a picture of a slowing national price growth as of August 2025, and Florida is part of that bigger trend.

While the national year-over-year price growth dipped to 1.7% in June 2025, and Florida itself saw some negative price growth in certain areas like Cape Coral, North Port, and Fort Myers reported in the “Markets to Watch” section, it’s not a universal decline across the entire state.

Will the Florida Housing Market Crash in 2026?
Source: Cotality

Understanding the Current Scene: What the Numbers Say

Let’s break down what the recent data tells us about Florida’s housing market. According to Florida Realtors® data for June 2025:

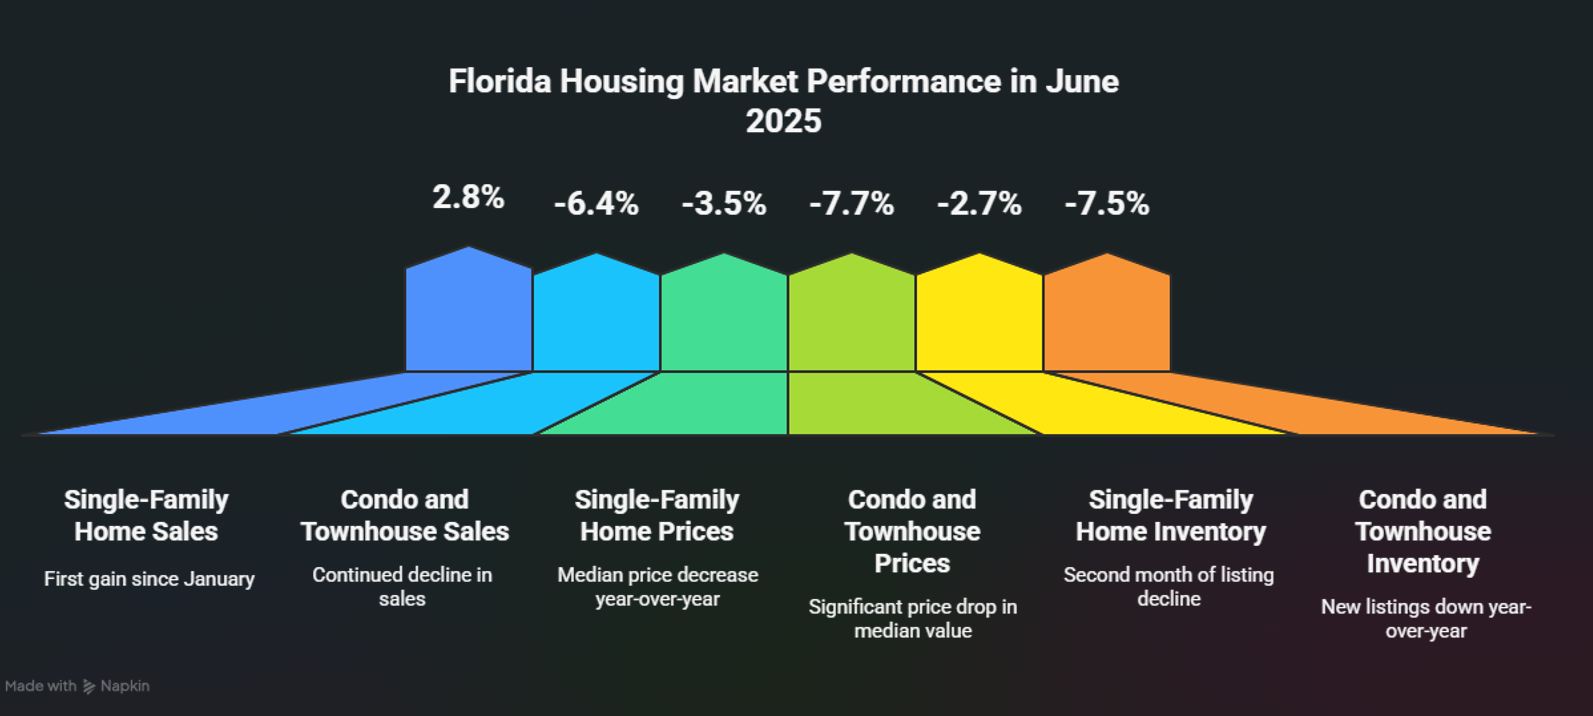
  • Single-Family Home Sales: We saw a 2.8% year-over-year increase in closed sales of existing single-family homes. This is notable because it's the first gain in that metric since January, suggesting a bit of life returning to the sales activity.
  • Condo and Townhouse Sales: These, however, were still down, with a 6.4% year-over-year decline in closed sales. This indicates a difference in how the different types of housing are performing.
  • Median Prices: The statewide median sales price for single-family existing homes in June was $412,000, which is a 3.5% decrease compared to June 2024. For condos and townhouses, the median price was $300,000, marking a 7.7% drop year-over-year. This is a key indicator of the cooling trend; prices are easing, not soaring.
  • Inventory: One of the most important factors influencing market crashes is inventory – how many homes are for sale. In Florida, we saw 2.7% fewer single-family homes listed for sale in June 2025 compared to the previous year. This is the second straight month of decline in new listings after a period of growth. For condos and townhouses, new listings were down 7.5% year-over-year in June. While inventory growth has slowed, the months' supply for single-family homes was at 5.6 months in June and the second quarter, and 10 months for condos and townhouses. Generally, a six-month supply is considered balanced, so this is giving buyers more room to negotiate.

From my perspective, these numbers are telling a story of a market that’s moving away from seller dominance. When prices are coming down and inventory is increasing at a decent pace (even if new listings are slowing a bit), buyers have more power. This is a healthy adjustment after years of extremely tight inventory and rapidly rising prices.

Florida Housing Market Performance

Why a Full-Blown Florida Housing Market Crash in 2026 is Unlikely

So, back to the main question: crash or no crash? Here’s why I lean towards “no crash” for the overall Florida market by 2026:

  • Strong Underlying Demand: Florida continues to be a desirable place to live. We’re seeing domestic in-migration – people moving into the state – which is a major driver of housing demand. People are drawn to our climate, lower taxes, and job opportunities, especially in certain sectors. This steady stream of new residents provides a baseline of demand that helps prevent a drastic price drop.
  • Affordability is Improving (Slowly): While affordability has been a major challenge, the slight easing of prices and slower price growth is making housing more accessible. The Cotality data mentions that year-over-year price growth dipped to 1.7% in June 2025, which is below the rate of inflation. This means real home prices are becoming slightly more affordable. The income required to afford a median-priced home is a critical metric. If this number starts coming down, more people can enter the market.
  • Insurance Costs are a Factor, Not a Deal-Breaker for Everyone: I can’t talk about Florida without mentioning insurance. Rising insurance premiums are a serious concern and are indeed eroding long-term affordability, as noted by Cotality’s Chief Economist. These variable costs have jumped significantly. However, for many buyers, the dream of homeownership, especially in areas with strong job markets or desirable amenities, will likely outweigh the insurance hurdle, provided they can secure a loan and afford the monthly payments. It's a headwind, for sure, but not the same as a complete market collapse.
  • Less Speculative Activity Than Before: The easy money and speculative buying that some saw in past boom cycles seems to have died down. More buyers today are looking for primary residences, not just investments to flip quickly. This makes the market more resilient.
  • Not All Markets are Created Equal: Florida is a massive state with diverse local economies. While some areas might see more significant price adjustments, others will remain relatively stable or even continue to experience modest growth. For instance, the “Markets to watch” list from Cotality identifies areas like Cape Coral, Lakeland, North Port, St. Petersburg, and West Palm Beach as having a very high risk of price decline. This highlights that localized dips are possible, but they don't necessarily signal a statewide crash.

Factors That Could Potentially Temper the Market Further

While I don't foresee a nationwide-style crash, there are factors that could lead to more cooling in Florida by 2026:

  • Interest Rate Stability (or Increases): Mortgage interest rates have a huge impact. If rates remain elevated or even climb higher, it will continue to dampen demand and put downward pressure on prices. The “Homes required to afford median-priced home” metric from Cotality shows a figure of $89,600, which is quite high. If this number increases due to rising rates, it further curbs affordability.
  • Economic Slowdown or Recession: A significant economic downturn, leading to job losses and decreased consumer confidence, would naturally impact housing demand. If the projected “slowing U.S. economy” discussed by Dr. Selma Hepp intensifies, we could see a more pronounced effect.
  • Persistent Insurance Challenges: If insurance costs continue to skyrocket or insurers pull out of certain markets, it could make homeownership in those areas prohibitively expensive, leading to a more significant correction.
  • Overbuilding in Specific Areas: While generally inventory has been tight, if certain regions or construction types experience overbuilding, it could lead to localized price drops.

What Does This Mean for Buyers and Sellers in Florida?

For Buyers:

  • More Negotiating Power: This is a more balanced market where buyers can potentially find better deals and have more room to negotiate on price and terms.
  • Patience is Key: Don't rush. Continue to monitor interest rates and housing prices. The market is likely to continue its gradual adjustment into 2026.
  • Focus on Long-Term Value: Look for properties in areas with strong fundamental demand, good schools, and job growth, regardless of short-term price fluctuations.
  • Factor in Insurance: Get a clear understanding of insurance costs for any property you consider, as this is a crucial part of your budget.

For Sellers:

  • Realistic Pricing is Crucial: Overpricing your home will likely result in it sitting on the market. Work with your real estate agent to set a competitive price based on current market conditions.
  • Home Presentation Matters: With more inventory, making your home stand out is essential. Ensure it’s in good condition and appealing to buyers.
  • Be Prepared to Negotiate: You might not get the bidding wars and multiple offers we saw a couple of years ago. Be open to reasonable negotiations on price and terms.

Florida's Unique Position

Florida's housing market has always had its own rhythm, influenced by natural disasters, tourism, and its status as a retirement and vacation destination. The trends we’re seeing now are more about returning to a normal cycle after an overheated period. The Cotality data points to a national slowdown, and Florida is participating in that trend, but the state’s inherent attractiveness creates a strong undercurrent of demand.

The “Top 10 coolest markets” where prices are declining (like Cape Coral, FL, North Port, FL, etc.) are areas to watch closely. These are often markets that saw extremely rapid appreciation and might be more susceptible to price corrections as the broader market normalizes. The fact that Florida Realtors® is highlighting these areas isn't a sign of impending doom for the entire state, but rather a signal of natural market adjustments in specific pockets.

My Personal Take

Having weathered previous real estate cycles, I see the current situation in Florida as a necessary correction, not a catastrophe. The days of every home garnering multiple offers sight unseen are likely behind us for now. This is a good thing for long-term market health. Homeownership should be built on sustainable prices and incomes, not just speculation.

The data from Cotality and Florida Realtors® is consistent: price growth is slowing, inventory is becoming more available (though not flooding the market), and buyers have more leverage than they did a year or two ago. These are all signs of a market transitioning towards balance, which is the opposite of a market crash. A crash typically involves a rapid, widespread collapse in prices driven by a severe economic shock or a bursting speculative bubble. While economic uncertainty is present, the fundamental demand for housing in Florida remains strong due to its population growth and appeal.

So, will the Florida housing market crash in 2026? I believe the answer is no, not in the way most people fear. Expect continued cooling, perhaps some localized price drops, and a market that requires more careful consideration from both buyers and sellers. It's a shift from a “seller's market” to a more “buyer's market,” and that's a healthy evolution for the long run.

Position Yourself for Stability Amid Market Uncertainty

With growing speculation about a potential Florida housing market crash, the smartest investors are diversifying into markets with proven resilience.

Norada provides turnkey rental properties in high-demand, economically stable areas—helping you secure passive income and safeguard against market downturns.

NEW CASH-FLOWING PROPERTIES JUST LISTED!

Speak with an experienced Norada investment counselor today (No Obligation):

(800) 611-3060

Get Started Now 

Read More:

  • 24 Florida Housing Markets Could See Home Prices Drop by Early 2026
  • Is the Florida Housing Market Headed for Another Crash Like 2008?
  • Key Trends Shaping the Florida Housing Market in 2025
  • This Florida Housing Market Bucks National Trend With Declining Prices
  • Florida Housing Market Crash 2.0? Analyst Warns of 2008 Echoes
  • Tax Relief Proposed as Florida Housing Market Faces Deepening Crisis
  • Florida Housing Market: Record Supply Expected to Favor Buyers in 2025
  • Florida Housing Market Forecast for Next 2 Years: 2025-2026
  • Florida Housing Market: Predictions for Next 5 Years (2025-2030)
  • When Will the Housing Market Crash in Florida?
  • South Florida Housing Market: Will it Crash?

Filed Under: Housing Market, Real Estate Market Tagged With: Florida, Housing Market, housing market crash

24 Florida Housing Markets Could See Home Prices Drop by Mid 2026

August 27, 2025 by Marco Santarelli

24 Florida Housing Markets Could See Home Prices Drop by Mid 2026

According to recent data and forecasts, around 24 Florida housing markets may experience a drop in home prices by mid-2026. This isn't a cause for widespread panic, but it does signal a shift from the red-hot market we've seen in recent years towards a more balanced, and in some areas, a slightly cooler environment.

As someone who's been following Florida real estate for a while, this kind of adjustment is actually healthy for the long-term stability of the market. It means we're moving away from unsustainable price growth and towards a reality where affordability might become a bit more attainable for more people.

24 Florida Housing Markets Could See Home Prices Drop by Mid-2026

First, let's clear the air: “price drop” doesn't necessarily mean a crash. It means moderation, a cooling off after a period of intense appreciation. Think of it less as a nosedive and more as a gentle descent back to earth after a rocket launch. The data from Florida Realtors® for June and the second quarter of 2025 actually shows some interesting trends that support this, even as we look ahead to potential price moderation.

What's happening on the ground? In June, Florida saw its first year-over-year gain in closed single-family home sales since January, with a 2.8% increase. That's a positive sign, indicating more activity. However, when you dig into the second quarter numbers, sales were down 2.6%. It's a mixed bag, but the overall story is one of transition.

Dr. Brad O’Connor, the Chief Economist at Florida Realtors®, pointed out that this June rebound helped soften what would have been a tougher second quarter. For condos and townhouses, sales were down 6.4% in June, which, while still a decline, was significantly less severe than the 20% drop seen in May. This suggests that while the market is cooling, it's not collapsing.

The median sales price for single-family homes in June was $412,000, down 3.5% from June 2024. Condo prices saw a sharper drop of 7.7%, with the median price at $300,000. This is crucial information: prices are moderating. For the second quarter, the single-family median price was $414,900 (down 3.1%), and the condo median was $310,000 (down 6.1%). This moderation is a key indicator of the market shifting from a seller's advantage to a more balanced playing field.

What's Driving the Shift in Florida's Housing Market?

Several factors are contributing to this evolving market. One major player is inventory. Dr. O’Connor noted that active listings for single-family homes were down 2.7% in June compared to the previous year. This follows a period of growth in new listings earlier in the year. For condos and townhouses, new listings were down even more, 7.5% year-over-year in June.

What does this mean? While the number of homes for sale might be slightly down compared to last year, the months' supply is still healthy. We're looking at 5.6 months' supply for single-family homes and a robust 10 months' supply for condos and townhouses. A “months' supply” tells us how long it would take to sell all the homes currently on the market at the current sales pace. Anything over 4-6 months is generally considered a balanced market, and 10 months definitely favors buyers. This increased supply gives buyers more choices and more negotiating power, which naturally puts downward pressure on prices that were previously being bid up aggressively.

Another significant factor is interest rates. While not explicitly detailed in the provided data, we all know that higher mortgage rates make buying a home more expensive, even if the list price hasn't changed. For many potential buyers, this increased cost can price them out of the market or force them to look for more affordable options, thus slowing down demand and eventually impacting prices.

Tim Weisheyer, the 2025 Florida Realtors® President, hit the nail on the head when he said the market is “transitioning toward balance.” He also highlighted that “motivated sellers who understand today’s market dynamics are attracting qualified buyers.” This is the human element of the market. Sellers who overprice their homes or are unwilling to negotiate are going to be left waiting. Those who are realistic about current conditions and are working with skilled Realtors® are the ones who are seeing success.

Spotlight on the 24: Which Florida Markets Could See Price Declines?

Now, let's get to the specifics. Zillow's data offers a projection of potential price changes in various Florida metropolitan areas (MSAs) through mid-2026. It's important to remember that these are forecasts, not guarantees, and they are based on sophisticated modeling. However, they do give us a strong indication of where more significant price moderation might occur.

The table below outlines some of these markets, showing the projected percentage change in home prices from June 2025 through July 2025, September 2025, and finally, June 2026.

Florida Market Projected Price Change (July 2025) Projected Price Change (Sept 2025) Projected Price Change (June 2026)
Punta Gorda, FL -1.4% -3.3% -4.0%
North Port, FL -1.1% -3.2% -3.2%
Cape Coral, FL -1.2% -2.9% -2.9%
Crestview, FL -0.7% -2.0% -2.6%
The Villages, FL -0.4% -1.3% -2.4%
Tallahassee, FL -0.4% -1.4% -2.1%
Panama City, FL -0.6% -2.0% -2.1%
Deltona, FL -0.7% -1.9% -1.9%
Gainesville, FL -0.5% -1.7% -1.8%
Jacksonville, FL -0.6% -1.7% -1.7%
Palm Bay, FL -0.6% -1.7% -1.6%
Sebastian, FL -0.8% -1.9% -1.6%
Tampa, FL -0.7% -2.0% -1.5%
Orlando, FL -0.7% -1.8% -1.5%
Lakeland, FL -0.6% -1.6% -1.3%
Pensacola, FL -0.4% -1.3% -1.3%
Palatka, FL -0.3% -1.4% -1.3%
Naples, FL -0.9% -2.4% -1.2%
Homosassa Springs, FL -0.7% -1.9% -0.9%
Miami, FL -0.7% -1.8% -0.7%
Port St. Lucie, FL -0.7% -1.7% -0.7%
Arcadia, FL -0.5% -1.6% -0.7%
Key West, FL -0.7% -1.7% -0.5%
Ocala, FL -0.5% -1.3% -0.2%

Looking at this table, you can see that markets like Punta Gorda, North Port, and Cape Coral are projected to see the most significant price moderation by mid-2026, with percentages in the negative territory. These are areas that, like much of Florida, experienced substantial price growth over the past few years. As the market normalizes, it's natural that some of the more rapid appreciation will be reined in.

Why These Specific Markets? Insights and Nuances

It's not a coincidence that many of the markets showing potential price moderation are in Southwest Florida and along the Gulf Coast. These regions, including Punta Gorda, North Port, Venice (part of the North Port-Sarasota-Bradenton MSA), Fort Myers, and Cape Coral, saw some of the most dramatic price increases during the boom years. This was fueled by a combination of factors, including robust demand from out-of-state buyers, limited inventory, and relatively lower price points compared to some other popular coastal areas which made them attractive.

As the market cools, these areas are likely to experience a more pronounced correction because the feverish demand that drove prices sky-high may also be the first to temper. When inventory levels rise, as they have been, and demand softens slightly due to economic conditions and higher interest rates, prices can begin to adjust downwards.

The Villages, known for its unique demographic and active adult community, also appears on this list. While it has its own distinct market dynamics, it's not immune to broader economic trends. The projected slight dip here might reflect a normalization of demand after a period of intense interest.

Other areas like Crestview, Tallahassee, and Panama City in the Panhandle are also showing projected declines. These markets might be more sensitive to shifts in local economic drivers, perhaps related to military presence or specific industry employment.

Jacksonville, Tampa, and Orlando – the major metropolitan hubs – are also included, though with more modest projected declines. These are larger, more diverse economies, which can sometimes buffer the impact of market shifts compared to smaller, more specialized areas. However, even in these larger markets, the overall trend of softening prices is evident in the data.

I’ve lived and worked in various parts of Florida, and in my experience, these markets often lead the way in price adjustments, both up and down. When growth was rapid, these were the places seeing the biggest jumps. Now, as things settle, they are showing the most significant moderation.

What Does This Mean for Buyers and Sellers?

For buyers, this is potentially good news. If you've been priced out of the market or struggling to compete, softer prices and increased inventory could mean more opportunities to find a home that fits your budget. It might be the time to be patient, get pre-approved for a mortgage, and work with a local expert to understand the nuances of specific neighborhoods. Don't rush into a purchase, but be ready to act when the right opportunity arises. This period of moderation can help you avoid overpaying, which is a smart long-term strategy.

For sellers, it means adjusting expectations. The days of multiple offers significantly over asking price might be fewer and farther between. It's crucial to price your home accurately based on current market conditions and be prepared to negotiate. Working with a Realtor® who has their finger on the pulse of your local market is more important than ever. They can help you stage your home effectively, market it strategically, and guide you through negotiations to ensure the best possible outcome.

The Bigger Picture: A Healthy Market Adjustment?

From my perspective, this isn't a sign of impending doom for Florida real estate. Instead, it looks like a natural correction after an unsustainable period of growth. The rapid price increases we saw were driven by a confluence of factors: low interest rates, a surge in demand from people relocating, and a lack of available housing. As interest rates have climbed and inventory has started to improve (even with some recent dips in new listings), the market is recalibrating.

The fact that closed sales are starting to tick up is encouraging. It suggests that demand hasn't disappeared; it's just becoming more selective and price-sensitive. A market with steady demand and more balanced prices is often healthier and more sustainable in the long run than one that experiences wild, unpredictable swings.

The expert consensus, as echoed by Tim Weisheyer, points to a market that's moving toward “balance.” This means that we'll likely see more predictable price trends, more reasonable negotiation periods, and a more stable environment for both buyers and sellers. It's about restoring a sense of normalcy after an unusual period.

Looking Ahead: Key Takeaways

  • Price Moderation is Expected: Approximately 24 Florida housing markets are projected to see home prices decline by mid-2026.
  • Southwest Florida Impact: Areas like Punta Gorda, North Port, and Cape Coral may experience more notable price adjustments.
  • Data Supports a Shift: Recent Florida Realtors® data shows moderating prices and a mixed bag for sales, indicating a market in transition.
  • Inventory and Interest Rates are Key: Increased supply and higher borrowing costs are influencing demand and price trends.
  • Opportunity for Buyers: Potential buyers may find more favorable conditions and greater affordability.
  • Sellers Need Realistic Expectations: Pricing and negotiation strategies are critical for sellers in this evolving market.

It's an exciting time in Florida real estate, not because of sky-high price appreciation, but because we're moving towards a more stable and predictable market. For anyone involved in buying or selling a home in Florida, staying informed and working with experienced professionals are your best tools. The market is always changing, and understanding these shifts is key to making smart decisions.

Stay Ahead of the Florida Housing Market Shifts

With reports suggesting that multiple Florida housing markets could face price declines by mid-2026, smart investors are preparing now.

Norada helps you identify stable, cash-flowing rental properties in resilient markets—so you can protect your portfolio and grow long-term wealth.

STRATEGIC OPPORTUNITIES AVAILABLE NOW!

Talk to a Norada investment counselor today (No Obligation):

(800) 611-3060

Get Started Now

Read More:

  • Key Trends Shaping the Florida Housing Market in 2025
  • This Florida Housing Market Bucks National Trend With Declining Prices
  • Florida Housing Market Crash 2.0? Analyst Warns of 2008 Echoes
  • Tax Relief Proposed as Florida Housing Market Faces Deepening Crisis
  • Is the Florida Housing Market on the Verge of Collapse or a Crash?
  • 3 Florida Cities at High Risk of a Housing Market Crash or Decline
  • Florida Housing Market: Record Supply Expected to Favor Buyers in 2025
  • Florida Housing Market Forecast for Next 2 Years: 2025-2026
  • Florida Housing Market: Predictions for Next 5 Years (2025-2030)
  • Hottest Florida Housing Markets in 2025: Miami and Orlando
  • Florida Real Estate: 9 Housing Markets Predicted to Rise in 2025
  • 3 Florida Housing Markets Are Again on the Brink of a Crash
  • Florida Housing Market Predictions 2025: Insights Across All Cities
  • When Will the Housing Market Crash in Florida?
  • South Florida Housing Market: Will it Crash?

Filed Under: Housing Market, Real Estate Market Tagged With: Florida, Housing Market, housing market crash, Housing Market Trends

Florida Housing Market Graph 50 Years

August 27, 2025 by Marco Santarelli

Florida Housing Market Graph 50 Years

Want to know what the Florida housing market graph 50 years looks like? Buckle up, because we're about to take a whirlwind tour through five decades of home price fluctuations in the Sunshine State. Understanding this history is crucial whether you're a seasoned investor, a first-time homebuyer, or just plain curious about Florida real estate.

This isn't your average, dry statistical report. We'll look at the raw data, sure, but we'll also dig into the why behind the numbers. We'll explore major events, economic shifts, and even speculate on what the future might hold for Florida's dynamic housing market. I've been following the Florida real estate market for years, and trust me, it's been one heck of a ride.

Florida Housing Market Graph 50 Years: A Deep Dive

Florida Housing Market Graph 50 Years: A Deep Dive
Source: FRED

The Data: A 50-Year Picture of Florida Housing Prices

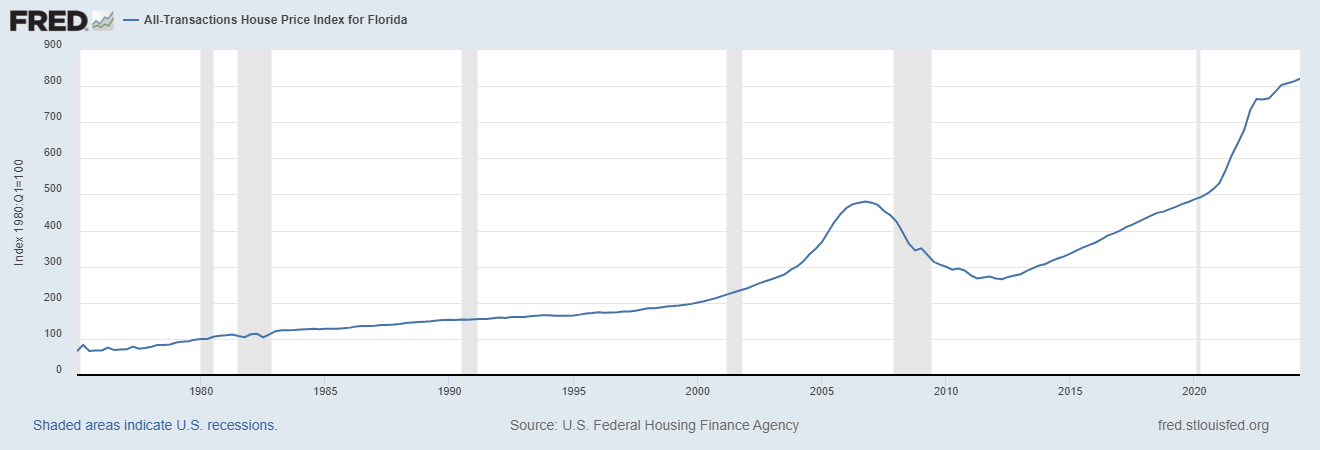
Our journey starts with the All-Transactions House Price Index for Florida (FLSTHPI), sourced directly from the Federal Reserve Bank of St. Louis's FRED database. This index provides a quarterly snapshot of average home prices, adjusted for inflation. This data, available since 1975, gives us a powerful glimpse into the long-term trends of the Florida housing market graph 50 years.

Remember, this is an index, meaning the starting point (1980:Q1) is set at 100. So, a value of 200 would signify that home prices have doubled since that baseline. While not every individual home's price will match the index precisely, it gives us an excellent overall picture.

I've personally found this data invaluable in my own real estate analyses. Its consistent methodology makes it a reliable tool for understanding long-term price changes in the state.

Here's a condensed table highlighting key periods, but we will dive into specifics later:

Period Notable Trends
1975-1980 Relatively slow growth
1980-2000 Gradual, steady increase
2000-2006 Boom years, rapid price appreciation
2007-2011 The Great Recession: sharp decline
2012-2020 Recovery and moderate growth
2020-Present Exponential growth, driven by various factors

Early Years (1975-1980): A Foundation Is Laid

The early years of the Florida housing market graph 50 years reveal relatively modest growth. Looking at the data, the index increased from around 65 in 1975 to 100 by 1980. This period was one of gradual development, with population growth and economic expansion setting the stage for more significant changes later on. Many factors contributed, including slower population growth compared to what we’d see in later decades. Think of it as the quiet before the storm.

The Steady Climb (1980-2000): Gradual Growth and Regional Variations

From the 1980s to the turn of the millennium, the Florida housing market graph 50 years shows a consistent upward trend. The increase was not uniform across the state, though. Coastal areas and popular retirement destinations experienced comparatively faster growth, while other regions moved at a slower pace. This reflects the beginning of the diversification of Florida's housing market. Different regions experienced fluctuations based on economic influences specific to those areas.

The Boom and the Bust (2000-2011): The Housing Bubble and Its Aftermath

The first decade of the 21st century presented one of the most dramatic periods in the history of the Florida housing market graph 50 years. The early 2000s saw rapid appreciation in home prices – a period often referred to as a housing bubble. Low-interest rates, easy credit, and speculation drove prices to unprecedented levels. However, this boom was unsustainable. The 2008 financial crisis, stemming from the subprime mortgage crisis, burst the bubble. This period witnessed a severe decline in home prices, with many homeowners facing foreclosure. I’ve personally witnessed the struggles of families during this time and the lasting impact on the market remains very real.

Recovery and Resurgence (2012-2020): A Slow but Steady Climb

The period after the Great Recession saw a slow but steady recovery. While home prices didn’t return to their pre-crash highs immediately, the Florida housing market graph 50 years illustrates a gradual upward trajectory. Cautious lending practices and government interventions aimed to stabilize the market and prevent further collapse. While growth was slower than during the boom, the recovery showed resilience. Florida's economic diversification played a role as well.

The Pandemic Surge (2020-Present): Unprecedented Growth

The Florida housing market graph 50 years reaches a remarkable inflection point starting in 2020. The COVID-19 pandemic triggered an unexpected surge in home prices. Several factors contributed to this unprecedented boom: low-interest rates, increased remote work opportunities (leading to a migration to Florida), and a shortage of available housing. These factors caused an exceptionally rapid increase in home values, creating both opportunities and challenges for buyers and sellers.

This period underlines just how unpredictable the market can be. I’ve watched many forecasts fall short in this era of unexpected change.

Analyzing the Florida Housing Market Graph 50 Years: Key Observations

Looking at the complete Florida housing market graph 50 years, some overarching trends stand out:

  • Long-term Appreciation: Despite periodic downturns, the long-term trend is one of steady price appreciation.
  • Cycles of Boom and Bust: The market has exhibited distinct periods of rapid growth (boom) followed by correction or decline (bust).
  • Regional Variations: Price changes aren't uniform across the state. Coastal regions and major urban centers generally experience faster growth.
  • External Factors: Economic conditions, interest rates, and population shifts significantly influence home prices.
  • Supply and Demand: The balance of supply and demand plays a crucial role, with shortages often leading to rapid price appreciation.

Future Predictions: What Lies Ahead for Florida Real Estate?

Predicting the future of the Florida housing market graph 50 years is always a risky proposition. However, considering past patterns and current market dynamics, we can speculate on some potential scenarios.

  • Continued Growth, but Perhaps at a Slower Pace: While it is unlikely to maintain the explosive growth of the last few years, we can expect prices to likely continue increasing over the long term.
  • Increased Volatility: Market cycles are likely to persist, meaning periods of faster and slower growth.
  • Rising Interest Rates: Interest rates will likely exert a moderating influence on prices.
  • Infrastructure Development: Investments in Florida's infrastructure could lead to regional variations in home price growth.
  • Climate Change Concerns: The impact of climate change, including sea-level rise, might affect the desirability and value of properties in certain areas.

This is simply educated speculation, of course. A lot can change in the coming years. In my experience, adaptability and a keen eye on market changes are crucial for success in Florida real estate.

Florida Housing Market Graph 50 Years: A Conclusion

The Florida housing market graph 50 years tells a fascinating story of growth, resilience, and unexpected shifts. Understanding the past helps us navigate the present and prepare for the future. From periods of quiet growth to explosive booms and challenging corrections, the market has proven its dynamism.

I hope this deeper dive provides you with a better understanding and appreciation of the complex world of Florida real estate. It is a market brimming with opportunities, but also one that demands careful planning, smart decisions, and an understanding of the forces that shape it. Remember to always consult with professionals and conduct thorough research before making any real estate decisions.

Related Articles:

  • 24 Florida Housing Markets Could See Home Prices Drop by Mid 2026
  • Florida Housing Market Forecast: 5 Cities at High Risk of Price Crash
  • Is a Major Florida Housing Market Crash Coming in 2026?
  • House Price Graph Last 20 Years USA
  • Housing Market Graph 50 Years: Showing Price Growth
  • San Diego Housing Market Graph 50 Years: Analysis and Trends
  • California Housing Market Graph 50 Years
  • Average Housing Prices by Year in the United States
  • Average Home Value Increase Per Year, 5 Years, 10 Years
  • How Much Did Housing Prices Drop in 2008?
  • Housing Market Crash 2008 Explained: Causes and Effects

Filed Under: Housing Market Tagged With: Florida Housing Market Graph 50 Years, Housing Market, Housing Market Graph

Housing Market Graph 50 Years: Showing Price Growth

August 27, 2025 by Marco Santarelli

Housing Market Graph 50 Years

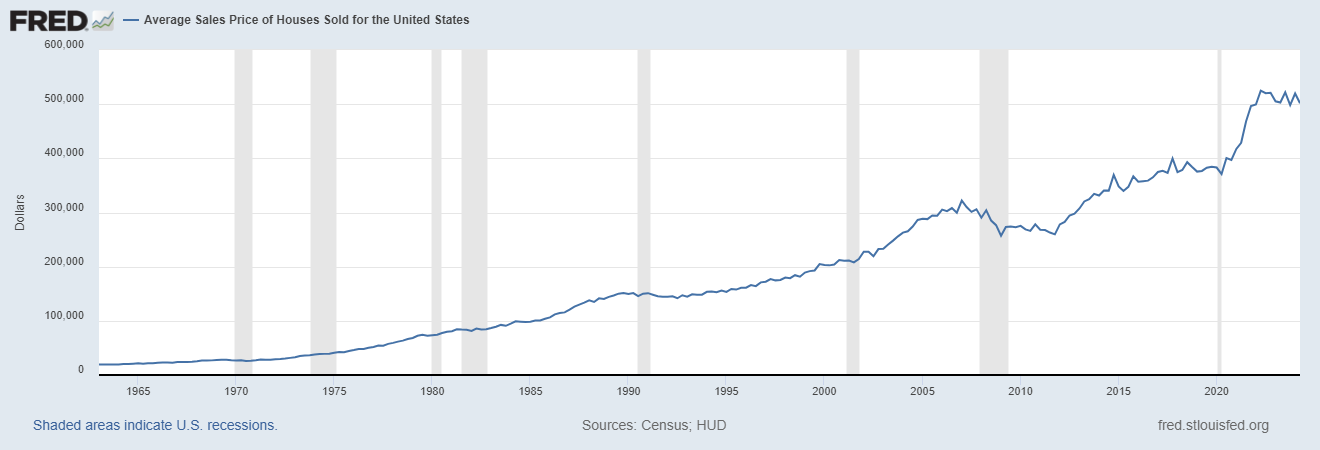
The housing market graph for 50 years is more than just a chart; it's a fascinating story about the American dream, economic booms and busts, and the ever-changing forces that shape where we live. From the humble beginnings of around $20,000 in the 1960s to the head-spinning figures exceeding half a million today, the journey of U.S. home prices has been anything but boring.

Think of it like this: your grandparents probably tell you stories about how cheap things were “back in their day.” Well, they weren't kidding, especially when it comes to houses! But before we dive into the hows and whys of this incredible journey, let's break down the data and see just how much things have changed.

Chart: U.S. Home Price Growth Over 50 Years: A Rollercoaster Ride

Housing Market Graph 50 Years
Souce: FRED

The Numbers Don't Lie: A Look at the Housing Market Graph (50 Years)

Thanks to the diligent data collection of the U.S. Census Bureau and the U.S. Department of Housing and Urban Development, we have a clear picture of how average house prices have evolved over the past five decades. This information, compiled by the Federal Reserve Bank of St. Louis, forms the backbone of our housing market graph (50 years) analysis:

  • 1960s: The Era of Affordability – The average house price hovered around $20,000. Imagine buying a house with what some people spend on a new car today!
  • 1970s: Inflation Hits Hard – Prices started to climb, reaching around $50,000 by the decade's end. This period saw high inflation, which affected the price of everything, including homes.
  • 1980s: Steady Growth – The average price reached $100,000, a significant milestone. This was a time of relative economic stability and a growing middle class.
  • 1990s: A Bit of a Lull – The housing market graph 50 years shows a slight plateau, with prices hovering around $150,000. The early '90s recession played a role in this.
  • 2000s: The Boom and Bust – The early 2000s saw a dramatic surge in prices, peaking at an average of over $300,000 before the housing bubble burst in 2008, leading to a sharp decline.
  • 2010s-Present: The Road to Recovery and Beyond – Prices have steadily recovered, exceeding pre-2008 peaks and recently reaching over $500,000.

What Drives the Housing Market: Unpacking the “Why” Behind the Graph

Looking at the housing market graph for 50 years, it's clear that home prices haven't just gone up in a straight line. There have been periods of rapid growth, stagnation, and even decline. So, what are the key factors that have shaped these trends?

1. Interest Rates: The Price of Money

Interest rates are like the volume knob for the housing market. When rates are low, borrowing money is cheaper, leading to increased demand for homes and, you guessed it, higher prices. Conversely, high-interest rates make mortgages more expensive, cooling down the market and potentially causing prices to drop or stabilize.

2. Economic Growth: Jobs, Wages, and Confidence

When the economy is booming, people feel more secure in their jobs and have more disposable income. This often translates to increased home buying, further fueling demand and pushing prices up. On the flip side, economic downturns can lead to job losses and financial uncertainty, making people hesitant to buy homes and potentially causing a decline in prices.

3. Supply and Demand: The Never-Ending Tug-of-War

The fundamental principle of economics—supply and demand—plays a crucial role in the housing market. When there are more buyers than sellers (high demand, low supply), prices tend to rise. Conversely, when there are more sellers than buyers (low demand, high supply), prices may fall or stagnate.

4. Demographics: The People Factor

Population growth, migration patterns, and even the age distribution of a population can impact the housing market. For example, a surge in young adults entering the housing market can lead to increased demand, while an aging population might result in more homes being put up for sale.

5. Government Policies: A Helping Hand or a Heavy Hand?

Government policies, such as tax incentives for homebuyers or regulations on lending practices, can have a significant impact on the housing market. These policies can be implemented to encourage homeownership, stabilize prices, or address other economic concerns.

Lessons from the Past, Insights for the Future

The housing market graph (50 years) provides valuable lessons about the cyclical nature of real estate.

  • What goes up doesn't always go up forever. The housing bubble of the 2000s is a stark reminder that unsustainable growth can lead to painful corrections.
  • Multiple factors are always at play. Understanding the interplay of interest rates, economic conditions, and other factors is crucial for making informed decisions about buying or selling a home.
  • The market is always evolving. New trends, technologies, and societal shifts will continue to shape the housing market in unpredictable ways.

The Future of Housing: What Lies Ahead?

Predicting the future of the housing market is no easy task. However, by analyzing current trends and considering potential economic and societal shifts, we can make some educated guesses:

  • Affordability Concerns: As prices continue to rise faster than wages in many areas, affordability will likely remain a major concern. This could lead to increased demand for smaller homes, more people renting for longer periods, and a greater focus on affordable housing solutions.
  • The Rise of Technology: Technology is transforming how we buy, sell, and even experience homes. From virtual tours to online real estate platforms, technology is likely to play an even more prominent role in the future of the housing market.
  • Changing Demographics: The aging of the Baby Boomer generation, coupled with shifting migration patterns, could impact housing demand in different regions.

In Conclusion

The housing market graph (50 years) is a testament to the dynamic nature of real estate. Understanding the factors that have shaped the market over the past five decades can provide valuable insights for both homebuyers and sellers as they navigate the ever-evolving world of real estate. While predicting the future of housing is an impossible task, one thing is certain: the journey will continue to be full of twists, turns, and perhaps even a few surprises along the way.

Related Articles:

  • San Diego Housing Market Graph 50 Years: Analysis and Trends
  • Average Housing Prices by Year in the United States
  • Average Home Value Increase Per Year, 5 Years, 10 Years
  • How Much Did Housing Prices Drop in 2008?
  • Housing Market Crash 2008 Explained: Causes and Effects
  • Housing Market Predictions for Next 5 Years: 2025 to 2029
  • Housing Market Predictions for Next Year: Prices to Rise by 4.4%
  • Housing Market Predictions for the Next 4 Years: 2024 to 2028

Filed Under: Housing Market Tagged With: Housing Market, Housing Market Graph

Housing Market Shifts With Pandemic Boomtowns Leading in Price Drops

August 27, 2025 by Marco Santarelli

Housing Market Shift 2025: Pandemic Boomtowns Lead in Price Drops

Tired of hearing about sky-high housing prices? Well, there's good news! Pandemic boomtowns are leading the way in housing price cuts in 2025. According to Zillow, a whopping 26.6% of for-sale listings saw a price reduction this June, signaling a shift in the real estate market and potentially giving buyers a much-needed advantage.

Housing Market Shifts With Pandemic Boomtowns Leading in Price Drops

Why Are We Seeing Price Cuts Now?

Remember the frenzy of the pandemic? Everyone seemed to be moving. Remote work became the norm, and people flocked to cities offering more space, sunshine, and a lower cost of living. These “boomtowns” experienced rapid growth, driving up housing prices to dizzying heights.

However, as things normalize, the tide is turning. Several factors are contributing to this change:

  • Slowing Population Growth: The initial surge of people moving to these boomtowns is slowing down. The demand isn't as intense as it once was.
  • Affordability Ceilings: Let's face it, even with more space and sunshine, there's a limit to what people can afford. Rising mortgage rates and overall inflation are forcing many potential buyers to stay on the sidelines.
  • Increasing Inventory: The number of homes for sale is finally starting to rise. Suddenly, sellers are faced with competition, and they need to make their properties more attractive to buyers.

Where Are Prices Being Cut the Most?

According to recent data from Zillow, here's where you're most likely to find sellers slashing their prices:

  • Denver (38.3%)
  • Raleigh (36.4%)
  • Dallas (35.5%)
  • Nashville (35.5%)
  • Phoenix (35.5%)

Notice a pattern? These are all cities that experienced explosive growth during the pandemic. Now, they're adjusting to a more balanced market.

Are All Cities Seeing Declining Prices?

Not at all. Some markets are still relatively insulated from these price cuts. Cities with limited inventory and strong local economies are holding up better. These include:

  • Milwaukee (13.9%)
  • New York (15.6%)
  • Hartford (16.0%)
  • Buffalo (18.3%)
  • San Jose (22.1%)

In these areas, competition remains fierce because the supply of homes can't keep up with demand.

Which Cities Saw the Biggest Jump in Price Cuts?

Keep an eye on these metros, as they may be cooling down quickly:

  • Kansas City (+5 percentage points)
  • Buffalo (+3.9 percentage points)
  • Indianapolis (+3.8 percentage points)
  • Columbus (+3.3 percentage points)
  • Minneapolis (+3.2 percentage points)

What Does This Mean for Buyers?

If you're a home buyer, this is potentially great. After years of battling other buyers, you might finally have some leverage. Here's what to expect:

  • Fewer Bidding Wars: Say goodbye to the days of offering way over the asking price.
  • More Options: With more homes on the market, you'll have more to choose from.
  • More Time to Decide: You won't feel as rushed to make an offer. You can actually think through this decision.
  • Seller Concessions: Sellers might be willing to offer incentives like paying for some of your closing costs or even buying down your mortgage rate. Remember, these concessions might be back on the table due to an increase of inventory.

What Does This Mean for Sellers?

If you're a seller, it's time to get realistic. The days of easy sales are over. Now, you need to:

  • Price Competitively: Do your research and set a price that reflects current market conditions.
  • Market Your Home Well: High Quality photography is a must — Highlight the best features of your property and make it stand out.
  • Be Prepared to Negotiate: Don't be afraid to compromise to close the deal. Consult with your agent. As a homebuyer, a real estate agent is a must and the small commission fee is worth the headache.

My Thoughts as a Real Estate Enthusiast

I remember back in 2020 and 2021, you couldn't list a house without having multiple offers within hours. People were waiving inspections and paying cash just to get a foot in the door. It was exciting but also felt unsustainable.

Now, we're seeing a more rational market. While I don't expect prices to crash, I do think this rebalancing is healthy. It gives more people a chance to achieve the dream of homeownership.

The data from Zillow is a clear indicator that the housing market is shifting throughout the nation. The rate hikes by the Federal Reverse are also playing a vital role in a declining housing market. I believe that for people looking to enter the housing market, now may be the perfect time while mortgage rates are still at reasonable numbers. Although difficult to do, many will decide whether to purchase a home now or to wait until an anticipated “Crash” into the market.

All the data shows that the market is currently in favor of those looking to purchase something and it is likely that this trend will continue further. While some cities are still doing well, it is important to acknowledge that the times are changing. If you're planning to buy or sell, do your research and work with a knowledgeable real estate professional who can guide you through this new environment. In my opinion, patience and strategic planning will be key to success in the housing market of 2025.

Looking Ahead: While it's hard to predict the future, I expect to see more price cuts in the coming months. Affordability will continue to be a major challenge for many buyers, so sellers will need to adjust their expectations.

Invest in Real Estate in the Top U.S. Markets

Discover high-quality, ready-to-rent properties designed to deliver consistent returns.

Contact Norada today to expand your real estate portfolio with confidence.

Contact our investment counselors (No Obligation):

(800) 611-3060

Get Started Now 

Also Read:

  • Housing Market Predictions 2025 by Norada Real Estate
  • Housing Market Predictions 2025 by Warren Buffett's Berkshire Hathaway
  • Will the Housing Market Crash in 2025: What Experts Predict?
  • Housing Market Predictions 2026: Will it Crash or Boom?
  • Housing Market Predictions for the Next 4 Years: 2025 to 2029
  • 12 Housing Markets Set for Double-Digit Price Decline by Early 2026
  • Real Estate Forecast: Will Home Prices Bottom Out in 2025?
  • Real Estate Forecast Next 5 Years: Top 5 Predictions for Future
  • 5 Hottest Real Estate Markets for Buyers & Investors in 2025
  • Will Real Estate Rebound in 2025: Top Predictions by Experts
  • Will the Housing Market Crash Due to Looming Recession in 2025?
  • 4 States Facing the Major Housing Market Crash or Correction
  • New Tariffs Could Trigger Housing Market Slowdown in 2025
  • Real Estate Forecast Next 10 Years: Will Prices Skyrocket?

Filed Under: Housing Market, Real Estate Market Tagged With: Housing Market, Housing Market Trends, Housing Prices

Mortgage Rates Plummet August 27, 2025: Big Drop in Fixed Rates, Refinance Rates, Current ARMs

August 27, 2025 by Marco Santarelli

Mortgage Rates Plummet August 27, 2025: Big Drop in Fixed Rates, Refinance Rates, Current ARMs

If you've been watching mortgage rates like a hawk, waiting for the right moment to buy or refinance, you're in luck! As of August 27, 2025, we're seeing a significant drop in mortgage rates across the board. National 30-year fixed mortgage rates are down to 6.59%, marking a notable shift compared to recent weeks. This decline affects not only fixed rates but also refinance rates and Adjustable-Rate Mortgages (ARMs), making it potentially a great time to reconsider your options.

I know, I know – the mortgage market can feel like a rollercoaster. For most of 2025, rates have been stubbornly stuck between 6.6% and 6.8%. But these recent changes could signal a real shift, and that’s something worth diving into.

Mortgage Rates Plummet August 27, 2025: Big Drop in Fixed Rates, Refinance Rates, Current ARMs

What's Causing This Dip in Mortgage Rates?

The fall in mortgage rates isn't happening in a vacuum. It is a result of a couple of key interconnected factors.

  • Weak Job Growth: Recent hiring data released early in August revealed surprisingly weak job growth numbers. This suggests the economy might be cooling off.
  • Inflation Concerns, But Not as Bad as Feared: While inflation remains a concern, July's data showed inflation was still sticky, but below economist’s expectations.
  • Federal Reserve Anticipation: Most importantly, these two items have led traders to strongly believe the Federal Reserve will cut interest rates by 25 basis points next month, with estimates from the CME FedWatch tool reporting an 89% chance of a rate cut in September. A 91% chance of the Fed dropping interest rates by 25 basis points next month was speculated. That's huge! This anticipation alone is putting downward pressure on mortgage rates NOW.

A Closer Look at Today's Mortgage Rates (August 27, 2025)

Let's break down exactly what's happening with different types of mortgage rates. Here's a comparison of current rates versus last week, based on Zillow's report:

Conforming Loans

PROGRAM RATE 1W CHANGE APR 1W CHANGE
30-Year Fixed Rate 6.59% down 0.08% 7.08% down 0.03%
20-Year Fixed Rate 6.43% 0.00% 6.94% up 0.03%
15-Year Fixed Rate 5.65% down 0.12% 5.98% down 0.08%
10-Year Fixed Rate 5.79% 0.00% 6.09% 0.00%
7-year ARM 6.63% down 0.57% 7.59% down 0.16%
5-year ARM 6.74% down 0.39% 7.53% down 0.20%
3-year ARM — 0.00% — 0.00%

Government Loans

PROGRAM RATE 1W CHANGE APR 1W CHANGE
30-Year Fixed Rate FHA 6.75% up 0.73% 7.78% up 0.75%
30-Year Fixed Rate VA 5.91% down 0.30% 5.99% down 0.43%
15-Year Fixed Rate FHA 5.25% down 0.30% 6.21% down 0.30%
15-Year Fixed Rate VA 5.54% down 0.30% 5.68% down 0.52%

Refinance Rates See a Plunge Too!

Refinancing your mortgage can be a great way to save money each month, and the dip in rates definitely makes it worth considering. National 30-year fixed refinance rates are down to 6.75%, a noticeable decrease.

What About the Future? Mortgage Rate Forecasts for Late 2025 and Beyond

No one has a crystal ball, but leading experts are constantly analyzing the market to make informed predictions. Here's what some of the big players are saying:

  • National Association of REALTORS®: Expects mortgage rates to average 6.4% in the second half of 2025 and potentially dip to 6.1% in 2026.
  • Realtor.com: Predicts a gradual easing of rates to around 6.4% by the end of the year.
  • Fannie Mae: Anticipates mortgage rates will end 2025 at 6.5 percent and 2026 at 6.1 percent. They also expect a rise in mortgage originations to $1.85 trillion in 2025 and $2.26 trillion in 2026.
  • Mortgage Bankers Association: Foresees rates remaining mostly unchanged near 6.8% through September 2025, and then settling in the mid-6% range (6.4%-6.6%) for the rest of the year.

My Take: Don't Try to Time the Market Perfectly

While this news is encouraging, remember that trying to perfectly time the market is almost impossible. A lot of people expected mortgage rates to fall over the last year, but the opposite happened. Buy a house or refinance when it makes the most sense for your individual financial situation. Don't get caught up in trying to chase the absolute lowest rate. Focus on affordability and long-term financial stability.

The Federal Reserve's Role: The Real Power Behind the Curtain

The Federal Reserve (also called simply, the Fed) remains the main driver of mortgage rates through its monetary policies. It is worth knowing how they function:

  • Pandemic Recovery to Rate Hike Cycle (2021-2023): The Fed’s bond purchases kept mortgage rates historically low until late 2021. Then to combat inflation, the Fed aggressively increased the federal funds rate, pushing mortgages to 20-year highs.
  • The Pivot to Cuts (Late 2024): After holding rates steady for 14 months, the Fed cut rates three times in late 2024 (September to December), reducing the federal funds rate by 1 percentage point to 4.25%-4.5%.
  • 2025: A Year of Waiting and Anticipation: Through July 30, 2025, the Fed held rates steady for five consecutive meetings. Growing economic headwinds suggest a high probability of a September cut. This is based on cooling inflation, weakening labor market, and predicted slowdowns.

Of all the forecasts, the most crucial one is Fed Chair Jerome Powell's speech at the Jackson Hole Economic Symposium on August 22. While he continues to emphasize data dependency, his tone will be scrutinized for confirmation of the market's overwhelming expectation. The bottom line is: all eyes will be on Fed Chair Jerome Powell's upcoming speech at the Jackson Hole Economic Symposium on August 22 for any final hints on the Fed's September decision.

So, What Does This All Mean For You?

  • Current Homebuyers: This dip provides some relief, but don't expect rates to plummet overnight. Focus on finding a home you love and a mortgage you can comfortably afford.
  • Potential Refinancers: If your current mortgage rate is significantly higher than these new rates, now is the time to seriously explore refinancing. Do the math and see if it makes sense for your long-term financial goals.
  • The September Fed Watch: Closely monitor the September meeting that could signal a new wave of refinancing opportunities. Unexpected persistence in inflation or surprising economic strength between now and September could still alter the committee's calculus.

In Closing

The recent drop in mortgage rates is definitely welcome news for anyone in the market to buy or refinance. If the market continues to stay in this range, it signals we could be looking at lower rates by the end of the year.

Capitalize on Rates Before They Rise Even Higher

With fluctuating mortgage rates in 2025, savvy investors are exploring flexible financing options to maximize returns.

Norada offers a curated selection of ready-to-rent properties in top markets, helping you capitalize on current mortgage trends and build long-term wealth.

HOT NEW LISTINGS JUST ADDED!

Connect with an investment counselor today (No Obligation):

(800) 611-3060

Get Started Now

Also Read:

  • Will Mortgage Rates Go Down in 2025: Morgan Stanley's Forecast
  • Expect High Mortgage Rates Until 2026: Fannie Mae's 2-Year Forecast
  • Mortgage Rate Predictions 2025 from 4 Leading Housing Experts
  • Mortgage Rates Forecast for the Next 3 Years: 2025 to 2027
  • Will Mortgage Rates Ever Be 3% Again in the Future?
  • Mortgage Rates Predictions for Next 2 Years
  • Mortgage Rate Predictions for Next 5 Years
  • Mortgage Rate Predictions: Why 2% and 3% Rates are Out of Reach
  • How Lower Mortgage Rates Can Save You Thousands?
  • How to Get a Low Mortgage Interest Rate?
  • Will Mortgage Rates Ever Be 4% Again?
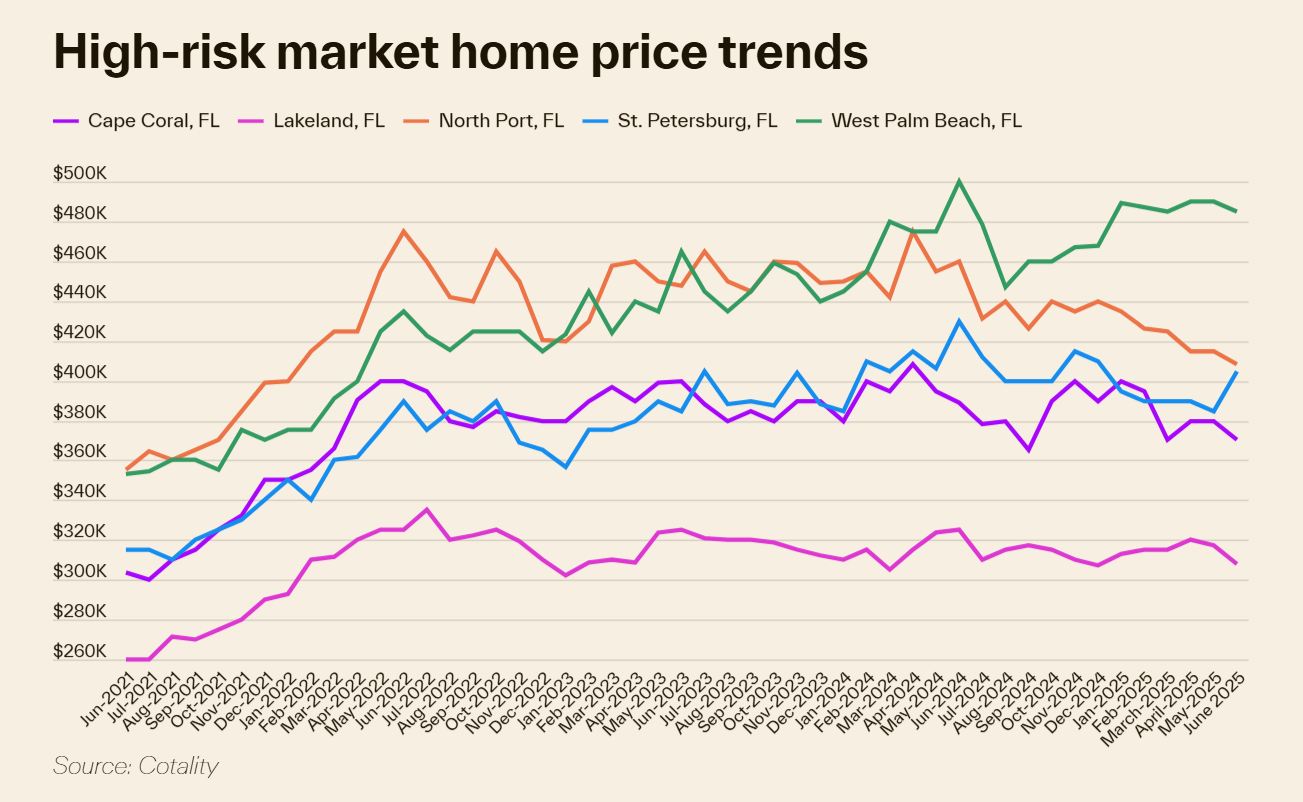
Filed Under: Financing, Mortgage Tagged With: Adjustable Rate Mortgage, Interest Rate, mortgage, Mortgage Rate Trends, mortgage rates

  • « Previous Page
  • 1
  • …
  • 130
  • 131
  • 132
  • 133
  • 134
  • …
  • 380
  • Next Page »

Real Estate

  • Birmingham
  • Cape Coral
  • Charlotte
  • Chicago

Quick Links

  • Markets
  • Membership
  • Notes
  • Contact Us

Blog Posts

  • Today’s Mortgage Rates, August 2: Fixed and Adjustable Rates Are Now the Same
    August 2, 2026Marco Santarelli
  • Mortgage Rates Today, August 2, 2026: 30-Year Refinance Rate Drops by 16 Basis Points
    August 2, 2026Marco Santarelli
  • Today’s Mortgage Rates, August 1: 30-Year Rises to 6.65% While 15-Year Dips to 6.01%
    August 1, 2026Marco Santarelli

Contact

Norada Real Estate Investments 30251 Golden Lantern, Suite E-261 Laguna Niguel, CA 92677

(949) 218-6668
(800) 611-3060
BBB
  • Terms of Use
  • |
  • Privacy Policy
  • |
  • Testimonials
  • |
  • Suggestions?
  • |
  • Home

Copyright 2018 Norada Real Estate Investments

Loading...