Absorption rates and months of inventory in real estate. What are they, and why are they significant? This information is useful since it represents the liquidity of a market. As a real estate investor, you can help maximize your profits by knowing the liquidity of a given real estate market. By knowing the liquidity of a market, you will better understand that market and therefore be able to take advantage of the various buying strategies afforded by it.
One of the measurements frequently used to gauge the liquidity of a given market is the absorption rate. This is basically the rate at which a specific segment of a real estate market sells in a given time frame. These segments are usually categorized by price range but may also be categorized by property type. The absorption rate can assist sellers to determine the optimal price for a property. The absorption rate is useful information for buyers as well because it indicates the extent to which a seller may be willing to lower their asking price or make other concessions.
Absorption Rate Formula
The easiest way to understand absorption is to put it in more tangible terms and measure it in “Months of Inventory”. In other words, we take the number of active listings and divide it by the total number of sold transactions within the same month to give us the months of inventory.
To calculate the months of inventory for any given market:
- Find the total number of active listings on the market last month.
- Find the total number of sold transactions for last month.
- Divide the number of active listings by the number of sales to determine the number of months of inventory remaining.
 As a general rule, 5 to 6 months of inventory is considered to be a normal or balanced market. Over 6 months of inventory and we have a buyer’s market. If it is less than 5 months and we have a seller’s market. The smaller the available inventory, the tighter the market is. Keep in mind that these are simply guidelines and will differ from market to market.
For example, let’s say there were 8,000 active listings last month and 1,000 closed transactions. That leaves us 8 months of inventory remaining on the market and also tells us that we are in a buyer’s market.
If you are in the market looking to buy, calculating the months of inventory can give you an indication of how negotiable sellers might be. A large number, say 12 months or more, would mean that sellers have a high level of competition and will probably be more flexible on their sales price and terms.
On the other hand, if you are a seller trying to sell your property, the months of inventory will give you an indication of the level of competition you will face. Selling in a buyer’s market will require you to put some serious thought into your pricing strategy and any incentives you may want to offer.

 While buying single family rental properties has become the darling investment strategy of Wall Street, it may not always make sense for individual real estate investors — particularly in some markets already picked over by the large institutional investors. But there are still markets where the numbers work for the conservative, individual investor looking to purchase foreclosures and other homes as
  California Foreclosure Statistics
 People were on the move in 2012 and apparently the most popular place for them to move to was Pittsburgh, PA., according to the 2012 Top US Growth Cities Report recently released by U-Haul International. The Steel City topped the list of 30 metro areas selected with a 9.04% population growth, based on data collected by U-Haul from over 1.6 million one-way truck rentals during a recent 12 month period.
 In Shelby County, there were 1,030 total foreclosures in the first quarter this year, according to real estate information company
 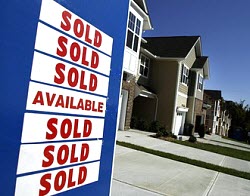 A Phoenix home with 95 bids is just one example of a housing market entering a new and unprecedented phase. Experts at Arizona State University School of Business say Phoenix is headed for a major housing shortage.
 Hundreds of thousands of homes in the US are now labeled as “zombie” foreclosures. That's when the owner of a foreclosed home leaves only to find out years later that he or she still legally owns the home and is on the hook for property taxes and other fees. Such cases occur in more than a third of foreclosures, industry figures show.
