The current Tennessee housing market exhibits characteristics of both buyer's and seller's markets, with price appreciation favoring sellers while limited inventory presents challenges for buyers.
While the influx of newly listed homes signals efforts to address buyer demand, challenges persist in meeting the ever-growing needs of prospective homeowners. The surge in median home prices coupled with a slight decrease in the number of homes sold underscores the imbalance between supply and demand. However, the market remains resilient, with opportunities for both buyers and sellers.
Current House Prices & Trends in Tennessee in 2024
The Tennessee housing market continues to showcase resilience and growth, with home prices experiencing a steady upward trajectory. According to Redfin, in March 2024, the median home price in Tennessee soared by 6.5% compared to the previous year, reaching a median price of $379,400.
Despite this surge, the number of homes sold saw a slight decline, down 11.0% year over year, with 7,219 homes sold in March of this year, compared to 8,114 homes sold in March of the preceding year. Moreover, the median days on the market increased by 5 days compared to the previous year, settling at 62 days.
How is the Tennessee Housing Market Doing Currently?
The current state of the Tennessee housing market reflects a positive trend in terms of price appreciation, albeit with a slight dip in the number of homes sold. This surge in home prices signifies sustained demand amidst a landscape of limited inventory.
In March 2024, there were 33,199 homes listed for sale in Tennessee, marking a 9.0% increase from the previous year. Additionally, the number of newly listed homes rose by 3.8% year over year, with 10,010 homes hitting the market. Despite this influx, the average months of supply remained stable at 3 months, indicating a balanced market.
How Competitive is the Tennessee Market?
The Tennessee housing market boasts diverse and competitive dynamics across various cities. Among the top 10 metros with the fastest-growing sales prices, locales such as Bristol, Cookeville, and Jackson stand out, experiencing remarkable price appreciation ranging from 15.8% to 47.1%. Furthermore, cities like Three Way, White Pine, and Medina emerge as highly competitive markets, characterized by strong buyer demand and limited inventory.
The future outlook of the Tennessee housing market is optimistic, albeit with cautionary considerations. While price appreciation and limited inventory pose challenges, efforts to enhance affordability and accessibility are underway. Collaborative initiatives between stakeholders aim to foster a balanced and sustainable housing market, ensuring long-term growth and stability.
Tennessee Housing Market Forecast for 2024 and 2025
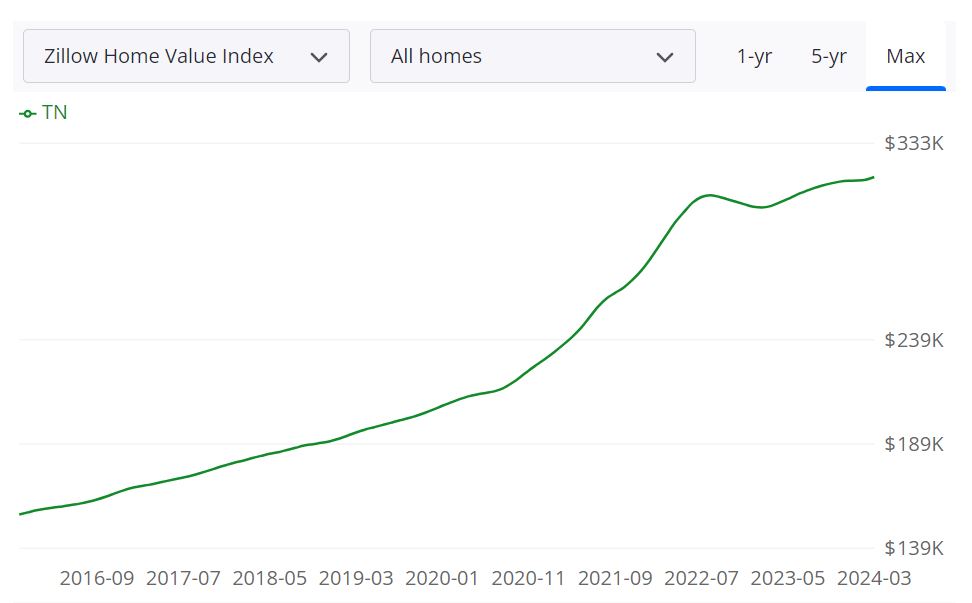
According to Zillow's data, as of March 31, 2024, the average Tennessee home value stands at $317,482, reflecting a 4.6% increase over the past year. Homes in Tennessee typically go pending in approximately 24 days, indicating a swift turnaround in the market.
Key Housing Metrics Explained
- For Sale Inventory: The inventory of homes available for sale in Tennessee as of March 31, 2024, is 23,103. This metric provides insight into the overall supply of housing stock in the market.
- New Listings: In March 2024, 7,102 new listings were added to the Tennessee housing market, signaling ongoing activity and potential opportunities for buyers and sellers alike.
- Median Sale to List Ratio: The median sale to list ratio, recorded as of February 29, 2024, stands at 0.982. This ratio indicates how close homes are selling to their list prices, with a higher ratio suggesting stronger demand and competitive pricing.
- Median Sale Price: As of February 29, 2024, the median sale price of homes in Tennessee is $292,083. This figure represents the middle value of all home sale prices, providing insight into the affordability and market trends.
- Median List Price: The median list price of homes in Tennessee, recorded on March 31, 2024, is $384,967. This metric reflects the midpoint of all homes listed for sale, serving as a benchmark for sellers and buyers.
- Percent of Sales Over List Price: In February 2024, 16.0% of home sales in Tennessee were closed above the list price. This percentage highlights the competitiveness of the market and the willingness of buyers to pay premiums for desirable properties.
- Percent of Sales Under List Price: Conversely, 62.8% of home sales in Tennessee in February 2024 were closed under the list price. This metric underscores the negotiation power of buyers and the diversity of pricing strategies in the market.
Are Home Prices Dropping in Tennessee?
Based on the data and forecasts provided, there is no indication of home prices dropping in Tennessee. Instead, the trend suggests steady appreciation in home values across various regions in the state. Factors such as population growth, economic stability, and low inventory levels contribute to the resilience of home prices.
Will This Housing Market Crash?
As of now, there is no evidence to suggest an imminent housing market crash in Tennessee. While real estate markets are subject to fluctuations and economic uncertainties, the Tennessee housing market appears stable and resilient overall. Factors such as job growth, low mortgage rates, and demand for housing contribute to the market's strength and sustainability.
With mortgage rates currently lower than they were last year, now may indeed be a favorable time to buy a house in Tennessee. Lower interest rates can translate to lower monthly mortgage payments and increased affordability for buyers. Additionally, despite the competitive market conditions, buyers may find opportunities to negotiate favorable terms and secure their dream home with the assistance of knowledgeable real estate professionals.

Top Areas in Tennessee Expected to See Significant Increases in Home Prices
Several regions in Tennessee are projected to experience notable increases in home prices over the coming months, presenting lucrative opportunities for both buyers and sellers.
1. Crossville, TN
- In Crossville, Tennessee, the median home prices are forecasted to rise steadily, with an expected increase of 0.9% by April 30, 2024, followed by more substantial growth to 2.3% by June 30, 2024, and a significant surge to 6.5% by March 31, 2025. This upward trajectory suggests a growing demand for housing in the area, likely driven by factors such as job opportunities, quality of life, and affordability.
2. Knoxville, TN
- Knoxville, Tennessee, is another region poised for significant appreciation in home prices. Projections indicate a gradual increase of 0.7% by April 30, 2024, followed by a more substantial rise to 1.9% by June 30, 2024, and a remarkable surge to 6.1% by March 31, 2025. This growth trajectory underscores Knoxville's attractiveness as a thriving urban center with diverse amenities and robust economic prospects.
3. Greeneville, TN
- Greeneville, Tennessee, is expected to witness notable appreciation in home prices, with forecasts indicating an increase of 1.4% by April 30, 2024, rising further to 2.7% by June 30, 2024, and reaching 5.3% by March 31, 2025. This upward trend reflects Greeneville's appeal as a charming town with scenic landscapes and a strong sense of community, attracting both residents and investors alike.
4. Sevierville, TN
- Sevierville, Tennessee, is anticipated to experience moderate growth in home prices, with forecasts indicating an increase of 0% by April 30, 2024, followed by a modest rise to 0.6% by June 30, 2024, and a more significant uptick to 4.7% by March 31, 2025. Despite starting from a baseline of zero, this projected appreciation underscores Sevierville's appeal as a tourist destination and gateway to the Great Smoky Mountains, driving demand for residential properties.
5. Tullahoma, TN
- In Tullahoma, Tennessee, home prices are expected to see steady growth, with forecasts indicating an increase of 0.7% by April 30, 2024, rising further to 1.7% by June 30, 2024, and reaching 4.3% by March 31, 2025. This upward trajectory reflects Tullahoma's strategic location with access to major highways and proximity to employment centers, making it an attractive destination for homebuyers seeking affordability and convenience.
6. Jackson, TN
- Jackson, Tennessee, is forecasted to see significant appreciation in home prices, with an expected increase of 1.1% by April 30, 2024, rising to 2.4% by June 30, 2024, and reaching 4.2% by March 31, 2025. This growth trajectory underscores Jackson's growing economy and diverse housing options, attracting buyers and investors looking for long-term value in the real estate market.
7. Cleveland, TN
- Cleveland, Tennessee, is expected to see a steady increase in home prices, with projections indicating a rise of 0.7% by April 30, 2024, followed by further growth to 1.8% by June 30, 2024, and reaching 4.2% by March 31, 2025. This upward trend reflects Cleveland's growing economy and strategic location within the state, attracting buyers seeking stability and long-term investment potential.
8. Johnson City, TN
- Johnson City, Tennessee, is anticipated to experience moderate growth in home prices, with forecasts indicating an increase of 0.6% by April 30, 2024, rising to 1.5% by June 30, 2024, and reaching 4.1% by March 31, 2025. This growth trajectory underscores Johnson City's appeal as a vibrant community with educational and healthcare institutions, driving demand for housing in the region.
9. McMinnville, TN
- McMinnville, Tennessee, is forecasted to see modest appreciation in home prices, with projections indicating an increase of 0.4% by April 30, 2024, rising to 1% by June 30, 2024, and reaching 4.1% by March 31, 2025. Despite starting from a lower baseline, this growth reflects McMinnville's charm and accessibility, making it an attractive destination for homebuyers seeking affordability and community.
10. Shelbyville, TN
- Shelbyville, Tennessee, is expected to see moderate appreciation in home prices, with forecasts indicating an increase of 0.6% by April 30, 2024, rising to 1.5% by June 30, 2024, and reaching 3.9% by March 31, 2025. This growth trajectory reflects Shelbyville's growing economy and cultural diversity, attracting buyers looking for value and opportunities in the real estate market.
11. Union City, TN
- Union City, Tennessee, is anticipated to experience significant appreciation in home prices, with forecasts indicating an increase of 1.6% by April 30, 2024, rising to 3.3% by June 30, 2024, and reaching 3.9% by March 31, 2025. This upward trend reflects Union City's economic growth and strategic location, making it an attractive destination for homebuyers and investors seeking potential and opportunity.
12. Clarksville, TN
- Clarksville, Tennessee, is forecasted to see moderate appreciation in home prices, with projections indicating an increase of 0.6% by April 30, 2024, rising to 1.4% by June 30, 2024, and reaching 3.7% by March 31, 2025. This growth trajectory reflects Clarksville's growing economy and military presence, attracting buyers seeking stability and long-term value in the real estate market.
Other Factors That Can Impact the Housing Market in Tennessee
When the housing market is booming, it is partly caused by job growth and decreases in unemployment. The housing market is inextricably linked to the economy. The health of the economy and job growth affects real estate buyers' purchasing power. Tennessee has seen the job market increase by 1.8% over the last year.
Future job growth over the next ten years is predicted to be 41.6%, which is higher than the US average of 33.5%. Tennessee was ranked as the 11th best economy in the country in an analysis from WalletHub. The rankings included the 50 states and the District of Columbia, which ranked just ahead of Tennessee at 10th.
The state ranked fourth in terms of economic activity, fifth in terms of economic health, and 38th in terms of innovation potential. It topped the chart in terms of change in GDP from 2020 to 2021, a key factor in its economic activity ranking. Tennessee experienced 8.6% real GDP growth, trailing only New Hampshire (8.5%) and California (7.8%).
More people require housing as the population grows. This means that, in the long run, population growth drives increased demand for housing and, as a result, a strong real estate market. Population growth has a positive impact on the housing market. Middle Tennessee is an area that is constantly growing and according to the United States Census Bureau, Spring Hill in the region was among the top 10 cities for population growth.
Spring Hill was named the tenth fastest-growing city in the nation between 2020 and 2021. According to The Boyd Center for Business and Economic Research, Tennessee could grow by nearly a million people over the next 20 years and reach a total population of 7.87 million by 2040.
The number of people in their prime working years, ages 25 to 54, is projected to increase at a slower pace than the state’s population as a whole. Population growth in the state will slow over the next two decades. Between 2010 and 2020, Tennessee's population increased by 8.9 percent. It is expected to fall to 7.7 percent between 2020 and 2030. Between 2030 and 2040, it could slow even more to 6.2 percent.
The Tennessee Quarterly Business and Economic Indicators report, released by state leaders, illustrates the health of the state's economy. According to the report, 21,353 new businesses filed for the first time in the first quarter of 2022. This was an increase of more than 8% over the same quarter last year.
According to the report, 9,454 of those new businesses were registered in the state's four largest counties: Shelby, Davidson, Knox, and Hamilton. Knox County saw the greatest increase in new filings compared to last year, with 1,366 initial filings, a 14.2% increase. The report also says nominal personal income was $382.8 billion in the state during the fourth quarter of 2021, an increase of 7.4% compared to the previous quarter.
Sources:
- https://www.neighborhoodscout.com/tn/real-estate
- https://www.zillow.com/nashville-tn/home-values/
- https://www.newsweek.com/house-prices-falling-these-five-overvalued-cities-1739363
- https://fred.stlouisfed.org/series/TNSTHPI#
- https://www.bestplaces.net/economy/state/tennessee/
- https://tnsdc.utk.edu/2022/03/09/tennessee-could-add-nearly-1-million-new-residents-by-2040/
- https://www.wbir.com/article/money/economy/tennessee-economic-report-q1-2022/51-58fb9599-f0db-47ad-9316-94b102a1df54


