Cape Coral, Florida, experienced a severe housing market crash as part of the 2008 Subprime Mortgage Crisis and subsequent Great Recession. Renowned for its extensive canal system and waterfront properties, the city's boom turned to bust, leaving a lasting scar on the community.
Ever driven down a street lined with for-sale signs, each one whispering a story of financial hardship? I have. And while the real estate market always has its ups and downs, certain places have experienced truly dramatic cycles. Cape Coral fits this description.
Let's dive into the story of how Cape Coral went from a real estate paradise to its collapse, and what lessons we can learn from its experience. I'll also evaluate the housing market as of 2025.
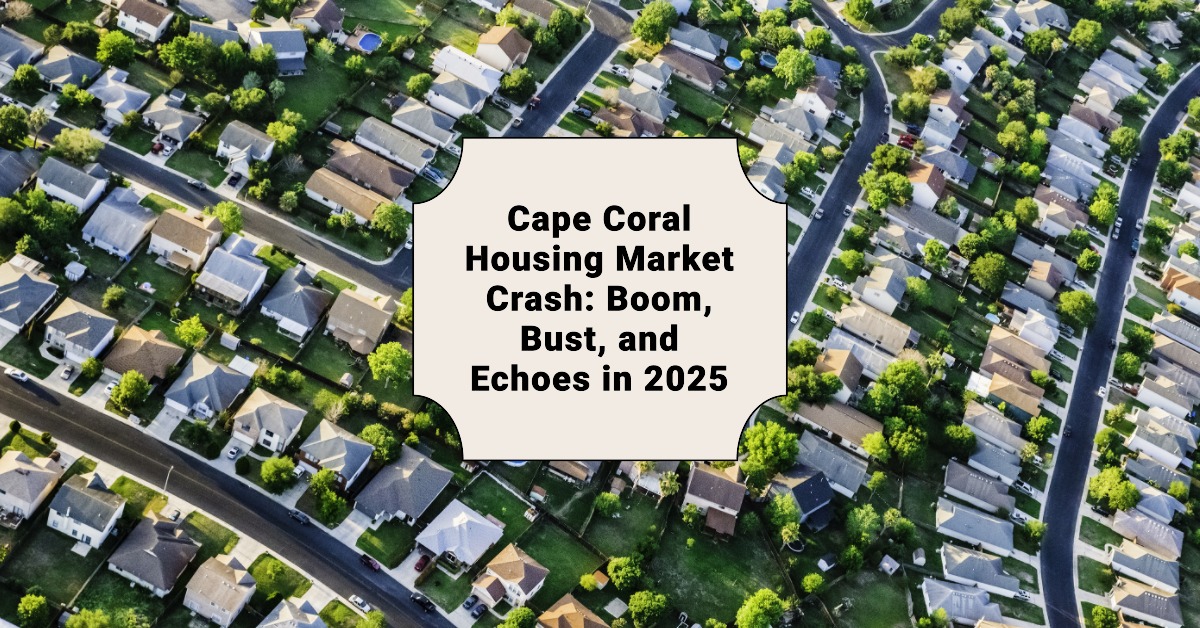
Cape Coral Housing Market Crash: Boom, Bust, and Echoes in 2025
The Boom Before the Bust (2000-2007)
Imagine a place where the sun shines almost every day, the canals sparkle, and the promise of an affordable waterfront home is on the horizon. That was Cape Coral in the early 2000s. Like many parts of Florida, Cape Coral experienced a huge surge in popularity. It was like everyone wanted a piece of the Florida dream.
- Affordable homes: Compared to other coastal areas the price was so low that people could believe it. Cape Coral was a good option if people wanted to settle down.
- Warm climate: It's Florida; sunshine is basically guaranteed, making it perfect for retirees and snowbirds escaping colder climates.
- Relaxed lifestyle: Imagine spending your days boating, fishing, or simply enjoying the beautiful scenery. That was the appealing promise of Cape Coral.
This combination brought in a wave of buyers. Florida saw a whopping 96% increase in home prices between 2000 and 2007, a Duke University study points out. And I'd wager Cape Coral, with its rapid growth, experienced even higher increases.
New construction was everywhere. Builders couldn't keep up with the demand. Everyone seemed to believe prices could only go up. It was a frenzy, no doubt. This chart illustrates a little bit of the boom years in Florida:
| Metric | Details |
|---|---|
| Home Price Increase (Florida) | 96% from 2000 to 2007 (HPI from 100 to 196) |
| Investor Loans Peak | 20% of all mortgage loans in 2005 |
| Homeownership Peak | 72% in 2006, fell to 65% by 2014 |
Investor loans, like a sugar rush for the market, peaked at 20% of all mortgages in Florida in 2005. This was fuelled by the false belief that home values would always increase. It created a dangerous recipe for disaster.
The Crash (2008): “Ground Zero”
The music stopped in 2008. The subprime mortgage crisis hit, and Cape Coral, sadly, became known as “ground zero” for the housing market collapse. It was as if someone pulled the plug on the party, and the hangover was brutal.
The root cause? Risky lending practices. Banks were handing out subprime mortgages to people with poor credit. Adjustable rates that reset to much higher payments trapped them. The crisis was as a snowball rolling down hill.
In Lee County, where Cape Coral is located, over 40,000 foreclosures were filed in 2008 alone, according to The News-Press. These figures reflect the devastation the crisis had on people's lives.
Out-of-state credit unions adding fuel to the fire. Norlarco Credit Union, for example, handed out overly risky loans. A review found that a ridiculous 97% of the construction loans were overvalued about 35%. When Norlarco collapsed in 2008, it cost the National Credit Union Share Insurance Fund over $10 million.
These numbers were pretty crazy. Here is a chart that describes the state of the market at that time.
| Impact Area | Details | Numbers |
|---|---|---|
| Foreclosures (Lee) | Over 40,000 filed in 2008 | 40,000+ |
| Mortgage Over-Value | 97% of construction mortgages overvalued by 35% | 97%, 35% |
| Credit Union Losses | Norlarco Credit Union, liquidation led to losses over $10M | $10M+ |
Features like balloon notes and interest-only loans further exacerbated the issue because they were based on the false idea that the market would continue to strengthen forever.
I remember thinking at the time, “This can't last.” But nobody wanted to listen. The allure of easy money and quick profits was far too strong.
The Aftermath (2008-2013): Years of Distress
The years following the crash were bleak. From 2008 to 2013, Cape Coral’s housing market was on life support. Real estate sales mainly involved cash buyers who were jumping on the chance to scoop up distressed properties at dirt-cheap prices. Cape Coral and Fort Myers often topped lists of cash-only closings, confirming the volume of distressed sales.
Properties decayed. Many sat abandoned. Some were invaded by squatters or stripped for scrap metal. Lee County's Neighborhood Stability Program did try its best to buy, fix up, and resell some of the properties. But the damage was extensive, and the city struggled to shake off its image as a foreclosure hotspot.
The broader economy also took a hit. Businesses closed. Unemployment rose. The delinquency rate in Florida jumped from 1.1% in 2006 to 20% in the first quarter of 2010.
| Metric | Details | Numbers |
|---|---|---|
| Delinquency rate (Florida) | Rose from 1.1% in 2006 to 20% in Q1 2010 | 1.1% (2006) |
| Real Estate Sales | Mostly opportunistic cash buyers, distressed properties at low prices | N/A |
| Foreclosure Inventory | High, with properties sitting available on the market for long periods of time | N/A |
I recall driving through neighborhoods where every other house seemed to be vacant. It was incredibly quiet and depressing, and a visible sign of a city struggling.
The Recovery (2013-Present): A Gradual Climb
Around 2013, things started to look up. First-time home buyers slowly re-entered the market. Home sales began inching upward. By 2017, the median house price in Lee County reached $243,500, showing a 7.1% rise from the previous year.
Foreclosure rates also declined. In 2016, a RealtyTrac report showed that Cape Coral's rates were down about 93% down from their peak.
| Metric | Details | Numbers |
|---|---|---|
| Median Home Price (2017) | $243,500 in Lee County, up 7.1% from the previous year | $243,500, 7.1% |
| Foreclosure Levels (2016) | 93% below peak in Cape Coral and other metro areas | 93% |
| Home Sales (2015) | Nearly 2600 in the first 6 months, 9% increase over the previous year | 2600, 9% |
Although the market had recovered, recovering your credit and financial stability needed time. The recovery was slow.
Cape Coral's Housing Market in 2025: Déjà Vu?
Now, let's fast forward to today. Are we seeing history repeat itself? I'm starting to sense some concerning parallels.
Here's a snapshot of the current situation:
- Dramatically Falling Home Prices: Redfin says that Cape Coral home rates were down 7.7% in May of 2025 compared to last year. The median home price is around $361,000.
- Stagnant Sales: Buyers are being increasingly hesitant. Redfin claims that 608 homes were sold in May this year, down about 5.7% from the 645 last year.
- Shift to a Buyer's Market: Buyers have a lot more leverage now in negotiations with sellers.
- Surge in Time on Market: The time has dramatically increased. Homes remain available for 76 days compared to 59 last year.
- Bottom Ranked: Fox 4 Now reported Cape Coral was last among 123 midsize cities in the U.S. in their July 2025 hotness ratings chart.
To summarize, here's a table breaking down the important numbers:
| Key Metric | Value (May 2025) | Change from Previous Year | Source |
|---|---|---|---|
| Median Home Price | $361,000 | Down 7.7% | Redfin |
| Homes Sold | 608 | Down 5.7% | Redfin |
| Days on Market | 76 days | Up from 59 days | Redfin |
Decoding the Signs
- Falling Prices: This is the beginning of a shift in supply and demand.
- Elevated Mortgage Rates: Rates are around 6.94% for a 30-year fixed mortgage, so many buyers are priced out of the market.
- Economic Cloudiness: Inflation worries, global uncertanties and recession fears, make people cautious in investing.
- Excess Inventory: Hurricane Ian has resulted in new constructions hitting the market after it.
- The Perils of Nature: Cape Coral’s vulnerability to insurance costs goes up due to sea levels that impact property values.
2008 vs. 2025: Parallels and Divergences
The similarities between the current picture and the 2008 disaster are a bit scary. The 2008 crisis was driven by fraudulency on mortgages, speculative buying, and lax regulations, whereas now, supply glut, mortgage rates, and uncertainty make it different.
Expert Insights and Predictions
“Housing market headwinds,” Dr. Selma Hepp says. She says Cape Coral has negative growth vs the USA. One can see 2.0% vs Cape Coral's -6.5%.
Realtors I have spoken to say that sellers be realistic about the prices.
Conclusion: Lessons Learned and the Path Forward
The 2008 crash left a mark on Cape Coral, Florida. The city symbolizes the subprime mortgage crisis with all the rising foreclosure rates.
Cape Coral’s experience serves as a reminder to prevent lending practices in the future. Hopefully, the city is evolving its real estate. But this is a good reminder of how important it is to be careful with money.
Invest in Real Estate in the “Hottest Florida Markets”
Discover high-quality, ready-to-rent properties designed to deliver consistent returns.
Contact Norada today to expand your real estate portfolio with confidence.
Contact our investment counselors (No Obligation):
(800) 611-3060
Read More:
- Why is Cape Coral Housing Market in Florida Doomed to Crash in 2025?
- Will the Cape Coral Housing Market Repeat the Crash of 2008?
- Is Cape Coral the Next Florida Housing Market to Crash?
- 5 Popular Florida Housing Markets Are at High Risk of Price Crash
- 2 Florida Housing Markets Flagged for a Major Price Decline Risk
- 24 Florida Housing Markets Could See Home Prices Drop by Early 2026
- Is the Florida Housing Market Headed for Another Crash Like 2008?
- Key Trends Shaping the Florida Housing Market in 2025
- This Florida Housing Market Bucks National Trend With Declining Prices
- Florida Housing Market Crash 2.0? Analyst Warns of 2008 Echoes
- Tax Relief Proposed as Florida Housing Market Faces Deepening Crisis


