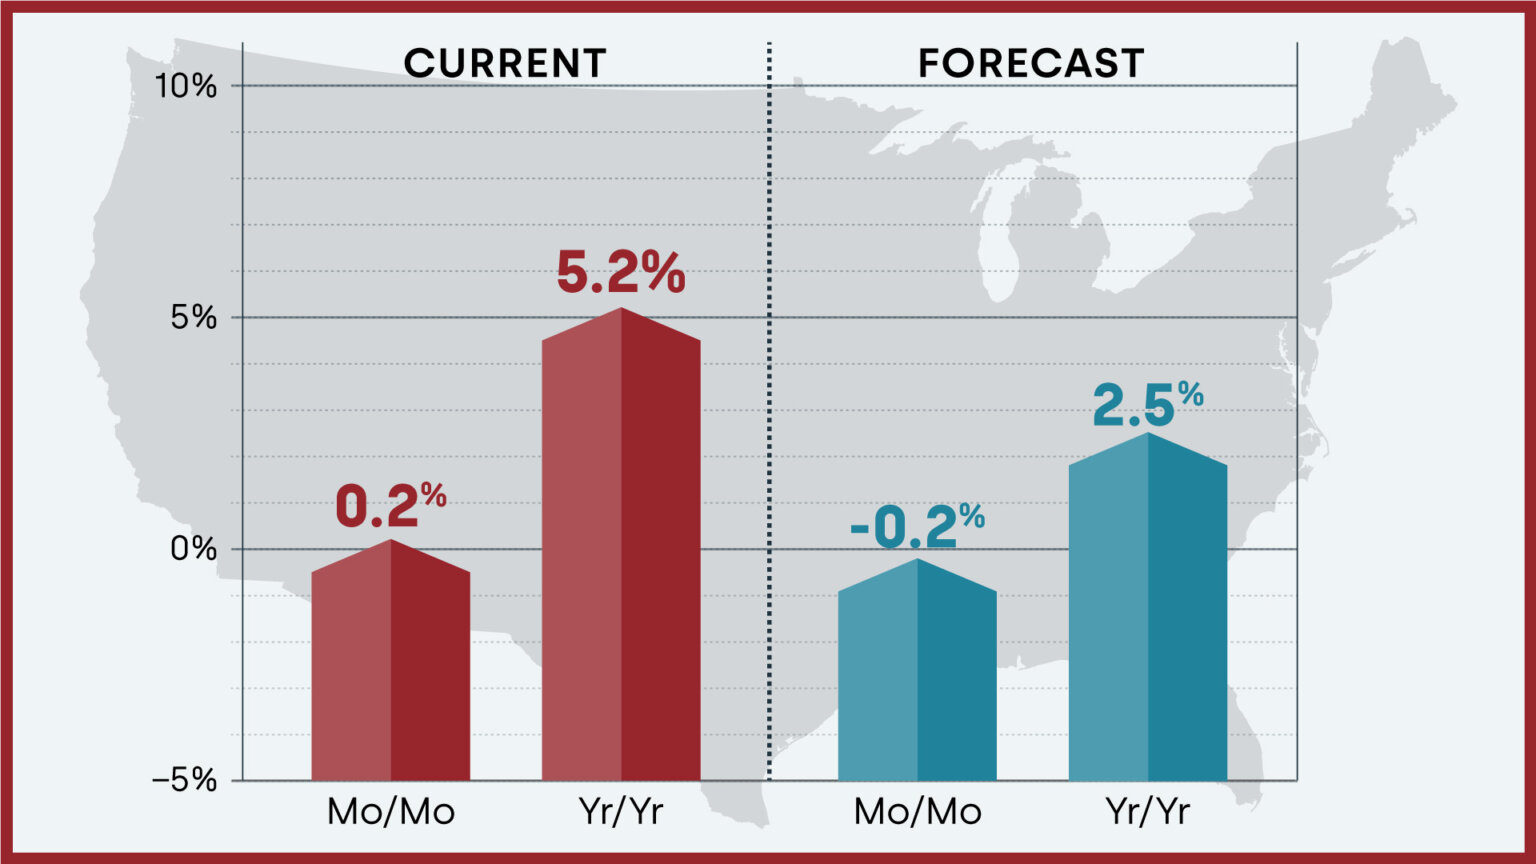
Home prices nationwide, inclusive of distressed sales, witnessed a 5.2% year-over-year increase in November 2023 compared to the same period in 2022, according to the latest report by CoreLogic. Moreover, on a month-over-month basis, there was a marginal 0.2% uptick in home prices in November 2023 when juxtaposed with October 2023.
The CoreLogic HPI Forecast presents a nuanced projection, indicating a slight decrease of -0.2% in home prices from November 2023 to December 2023. However, looking at the broader picture, there is a positive forecast for the entire year, with an anticipated year-over-year increase of 2.5% from November 2023 to November 2024.
Interestingly, for homeowners in certain cities like Redding, California, and Fairbanks, Alaska, this growth is expected to be more than double, providing a silver lining despite the challenges posed by soaring mortgage rates.
Driving Forces Behind the Housing Market
Despite the hurdles created by rising mortgage rates, housing prices have remained stubbornly high. CoreLogic Chief Economist Dr. Selma Hepp notes that this resilience is remarkable in the face of the nation's affordability crunch. The chief economist attributes this strength to pent-up demand, which continues to drive home prices higher.
Markets experiencing prolonged inventory shortages, exacerbated by a lack of new homes for sale, recorded notable price gains throughout 2023. The demand, fueled by the scarcity of available properties, has kept the housing market competitive, particularly impacting first-time buyers.
Northeastern States Lead Annual Home Price Growth
Examining regional trends, Northeastern states have consistently led in annual single-family home price growth. In November, Rhode Island, Connecticut, and New Jersey recorded double-digit growth percentages of 11.6%, 10.6%, and 10.5%, respectively. Additionally, 24 other states outpaced the national rate in year-over-year home price gains.
The Northeast, South, and Midwest, where relative affordability continues to drive demand, posted the most significant home price increases. Many of the fastest-appreciating real estate markets, which lagged in price growth during the pandemic, have recently benefited from job gains, with legislative acts such as The Inflation Reduction Act and the CHIPs Act stimulating housing demand.
The Top 20 Cities Poised for Remarkable Growth in 2024
Looking ahead, here are the top 20 cities where home prices are expected to experience the most significant growth in 2024:
- Redding, CA: 7.30%
- Santa Maria-Santa Barbara, CA: 6.81%
- Bremerton-Silverdale, WA: 6.51%
- Coeur d’Alene, ID: 6.49%
- Fairbanks, AK: 6.38%
- Santa Rosa, CA: 6.37%
- Corvallis, OR: 6.36%
- Merced, CA: 6.32%
- Bend-Redmond, OR: 6.29%
- Mount Vernon-Anacortes, WA: 6.20%
- Grand Junction, CO: 6.09%
- Longview, WA: 6.07%
- Pocatello, ID: 6.00%
- Casper, WY: 5.99%
- Walla Walla, WA: 5.88%
- Lewiston, ID-WA: 5.87%
- Santa Cruz-Watsonville, CA: 5.81%
- Prescott, AZ: 5.70%
- Lakeland-Winter Haven, FL: 5.67%
- Kahului-Wailuku-Lahaina, HI: 5.63%
While these cities are poised for growth, it's essential to acknowledge the other side of the spectrum. Florida dominates the list of markets that appear primed for a price decline, taking up the top positions in the predicted decreases.
Markets to Watch: Top Markets at Risk of Home Price Decline
While the overall outlook for the real estate market in 2024 is optimistic, it's crucial to be aware of markets that may face challenges. According to CoreLogic data, certain metro areas are identified with the highest likelihood of home price reductions. These markets, characterized by potential declines, include:
- Palm Bay-Melbourne-Titusville, FL: Identified as a market with a risk of home price decline.
- West Palm Beach-Boca Raton-Delray Beach, FL: Noted for potential home price reductions.
- Tampa-St. Petersburg-Clearwater, FL: Flagged as a market with a higher likelihood of home price decline.
- Deltona-Daytona Beach-Ormond Beach, FL: Recognized as a market where home prices may face reductions.
- Atlanta-Sandy Springs-Roswell, GA: Indicated as a market with an increased risk of home price decline.
Understanding the dynamics of these markets is essential for prospective buyers, sellers, and investors. Factors such as local economic conditions, job markets, and inventory levels can contribute to the vulnerability of home prices in these areas.
Florida, in particular, seems to be at the forefront of markets facing potential home price declines. The state features prominently in both lists—the top 20 cities poised for growth and the markets at risk of home price decline. This dichotomy underscores the diverse nature of the real estate landscape within the state.
It's worth noting that despite the general trend of price growth in various cities, certain factors unique to each market can influence outcomes. Local policies, economic shifts, and external events play pivotal roles in shaping the trajectory of home prices.
While the overall forecast indicates growth in many cities, the cautionary note about potential declines emphasizes the need for vigilance. Whether one is a prospective homebuyer, seller, or investor, staying informed about market trends and localized dynamics is crucial. By keeping an eye on cities poised for growth and markets at risk of home price decline, stakeholders can make informed decisions in this ever-evolving real estate landscape.
About CoreLogic
CoreLogic is a leading global property information, analytics, and data-enabled solutions provider. The company’s combined data from public, contributory, and proprietary sources includes over 4.5 billion records spanning over 50 years, providing detailed coverage of property, mortgages and other encumbrances, consumer credit, tenancy, location, hazard risk, and related performance information.
CoreLogic HPI Forecasts™ is based on a two-stage, error-correction econometric model that combines the equilibrium home price—as a function of real disposable income per capita—with short-run fluctuations caused by market momentum, mean-reversion, and exogenous economic shocks like changes in the unemployment rate.
Sources:
- https://www.corelogic.com/category/intelligence/reports/home-price-insights/


