Norada Real Estate Investments

  • Home
  • Markets
  • Properties
  • Membership
  • Podcast
  • Learn
  • About
  • Contact

House Price Graph Last 20 Years USA

July 12, 2025 by Marco Santarelli

House Price Graph Last 20 Years USA

Ever wondered how much house prices have changed in the US over the last two decades? The house price graph for the last 20 years in the USA tells a fascinating story, full of ups and downs. It's a story of booms and busts, of changing interest rates, and of the dreams of millions of Americans. Let's dive in!

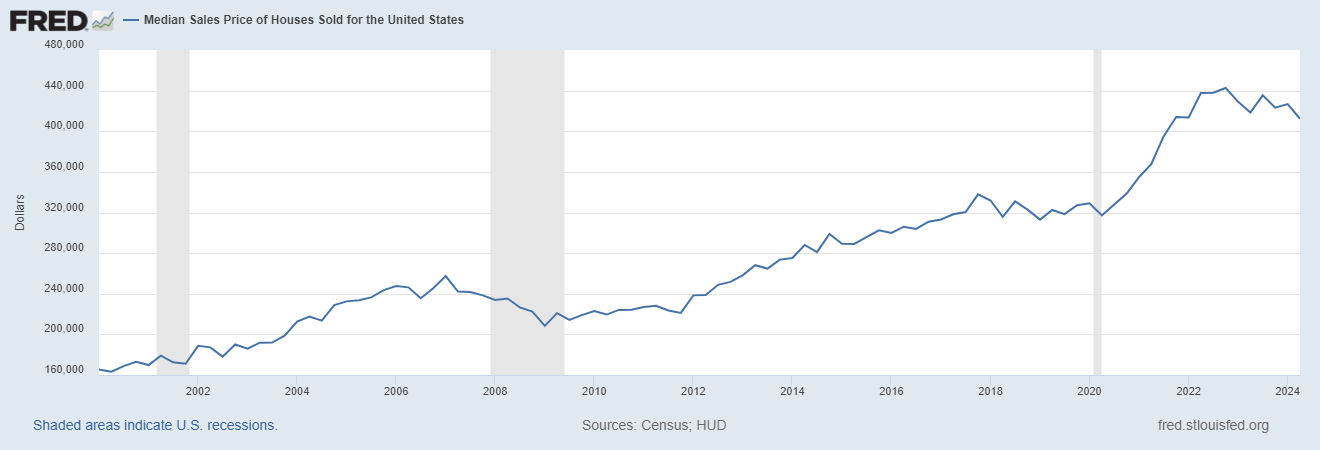
This data, reflecting the median sales price of houses sold, can be explored through resources like FRED (Federal Reserve Economic Data). Specifically, the U.S. Census Bureau and U.S. Department of Housing and Urban Development provide this valuable data, tracked as the Median Sales Price of Houses Sold for the United States.

House Price Graph Last 20 Years USA: A Rollercoaster Ride
House Price Graph Last 20 Years USA
Source: FRED

The Early 2000s: A Steady Climb

  • House Prices on the Rise (2000-2006): At the start of the millennium, the U.S. housing market experienced a period of significant growth. The house price graph for the last 20 years (including the years leading up to 2006) showed a steady upward trend. Back in 2000, the median price of a house hovered around $165,300. Over the next few years, prices kept climbing, reaching $247,700 by early 2006, an increase of roughly 50% in just six years. This rapid appreciation was fueled by a combination of factors, including low interest rates, relaxed lending standards, and a general belief that housing prices would continue to rise indefinitely. This optimistic outlook encouraged increased demand and speculation in the housing market. Things looked good, and many people felt confident about investing in real estate, often taking out mortgages they could barely afford in the expectation that rising home values would quickly build equity. This exuberance, however, would soon prove to be unsustainable.

The Housing Bubble Bursts (2007-2009)

  • The Crash: Then, the music stopped. The housing bubble, fueled by risky subprime loans, adjustable-rate mortgages, and rampant speculation, burst with a deafening silence. The house price graph took a dramatic plunge, resembling a ski slope after an avalanche. By early 2009, the median price had plummeted to $208,400, erasing years of steady growth and leaving countless homeowners underwater. This wasn't just a dip in the market; it was a freefall. Families who had treated their homes as piggy banks, relying on ever-increasing values to refinance and access equity, suddenly found themselves trapped. Foreclosures skyrocketed, neighborhoods were dotted with abandoned properties, and the ripple effect spread through the economy. I remember talking to my neighbor, Mr. Johnson, back then. He was worried sick about his mortgage, facing the very real possibility of losing the home he'd worked his entire life for. His story wasn't unique. Everyone was feeling the pinch. Businesses closed, unemployment soared, and the nation teetered on the brink of a full-blown depression. The fear was palpable. You could feel it in the air, a heavy blanket of uncertainty draped over everything.

Recovery and Growth (2010-2019)

  • Slow and Steady: The years following the crash were a period of slow but steady recovery. The USA house price graph started to climb again, although at a more moderate pace. This more sustainable growth was partly due to tighter lending regulations enacted after the crisis, making it more difficult for borrowers to obtain mortgages with risky terms. Things weren't booming like before, but they were getting better. By 2019, the median house price had climbed back up to over $327,100. It felt like we were finally turning a corner. This renewed sense of stability encouraged more buyers to enter the market, further fueling the recovery, albeit cautiously. Construction also began to pick up, slowly addressing the housing shortage that had developed during the downturn. However, lingering concerns about affordability remained, particularly in major metropolitan areas where prices were rising fastest.

The Pandemic and Beyond (2020-2024)

  • Unexpected Surge: Then came the COVID-19 pandemic, and something unexpected happened. Low interest rates implemented to stimulate the flagging economy and a dramatic shift towards working from home fueled a huge, and arguably artificial, demand for houses. People suddenly needed more space for home offices, desired larger properties further from urban centers, and were incentivized by historically low borrowing costs. This confluence of factors created a fiercely competitive market, pushing prices to over $442,600 by late 2022. This rapid appreciation led to concerns about affordability and raised questions about the long-term sustainability of the market, especially given the potential for a housing bubble. Many were left wondering if this surge was a temporary anomaly driven by the unique circumstances of the pandemic or a fundamental shift in the housing market landscape.
  • Recent Cooling: However, as interest rates started to rise again in 2023, the market began to cool off. As of Q4 2024, the median house price is around $426,800. This cooling trend is largely attributed to the Federal Reserve's efforts to combat inflation, making borrowing more expensive for potential homebuyers. The increased cost of mortgages has reduced affordability, pushing some buyers out of the market and putting downward pressure on prices. What will happen next? It's hard to say for sure. Several factors could influence the market's trajectory, including the pace of future interest rate hikes, the overall health of the economy, and the continuing inventory shortage. If interest rates stabilize or even decrease, we could see renewed buyer interest and potentially a rebound in prices. Conversely, a further economic slowdown or continued aggressive rate hikes could exacerbate the cooling trend and lead to more significant price declines. The housing market remains dynamic and sensitive to economic shifts, making it difficult to predict the future with certainty.

Table: Median House Prices (Quarterly Data)

Year Q1 Q2 Q3 Q4
2020 $329,000 $317,100 $327,900 $338,600
2021 $355,000 $367,800 $395,200 $414,000
2022 $413,500 $437,700 $438,000 $442,600
2023 $429,000 $418,500 $435,400 $423,200
2024 $426,800 $412,300 $415,300 $414,500

What Drives these Changes?

Several factors influence US house prices over the last 20 years:

  • Interest Rates: Lower interest rates make it easier for people to borrow money to buy houses, which pushes prices up. Higher rates do the opposite.
  • The Economy: When the economy is doing well, people have more money to spend, and house prices tend to rise.
  • Supply and Demand: If there are more buyers than sellers, prices go up. If there are more sellers than buyers, prices go down.

What's Next?

Predicting the future of the US house price graph is tough. No one has a crystal ball. However, by understanding the trends of the past and keeping an eye on the factors that influence the market, we can make more informed decisions about buying or selling a home.

My Take: I've been watching the housing market for years, and it's always interesting to see how things change. Right now, it seems like the market is taking a breather after the pandemic frenzy. It's important to remember that real estate is a long-term investment. Don't let short-term fluctuations scare you.

Related Articles:

  • Housing Market Graph 50 Years: Showing Price Growth
  • San Diego Housing Market Graph 50 Years: Analysis and Trends
  • Average Housing Prices by Year in the United States
  • Average Home Value Increase Per Year, 5 Years, 10 Years
  • How Much Did Housing Prices Drop in 2008?
  • Housing Market Crash 2008 Explained: Causes and Effects
  • Housing Market Predictions for Next 5 Years: 2025 to 2029
  • Housing Market Predictions for Next Year: Prices to Rise by 4.4%
  • Housing Market Predictions for the Next 4 Years: 2024 to 2028
Filed Under: Housing Market Tagged With: Housing Market, Housing Market Graph

California Housing Market Graph 50 Years

July 12, 2025 by Marco Santarelli

California Housing Market Graph 50 Years

Have you ever wondered about the rollercoaster ride of the California housing market graph 50 years? It's a story of booms and busts, dreams fulfilled and dashed, all reflected in the fluctuating prices of homes across the Golden State. This deep dive explores the California housing market over the past half-century, examining trends, analyzing data, and offering my perspective as someone who’s followed this market closely for years.

California Housing Market Graph: A 50-Year Rollercoaster Ride

California Housing Market Graph 50 Years
Source: FRED

The Early Years: 1975-1989 – A Foundation is Laid

Looking back at the California housing market graph of 50 years, the period from 1975 to 1989 reveals a comparatively slower, steadier climb. The index, based on data from the U.S. Federal Housing Finance Agency's All-Transactions House Price Index for California (CASTHPI), started at 41.69 in Q1 1975 and gradually rose. This reflects a period of post-war economic growth, though not without its challenges. Interest rates fluctuated, impacting affordability, but the overall trajectory was upward.

While data is valuable, you also have to consider the context. Think about the social and economic conditions of the time. Many California towns experienced population growth as people moved west. It was also a time when many people were buying their first home in a growing suburban market, which fueled demand.

Here's a glimpse at the early data:

Date CASTHPI Value
1975-01-01 41.69
1975-10-01 45.79
1980-01-01 100.00
1985-01-01 124.50
1989-10-01 224.67

As you can see, the growth was fairly gradual, showing a steady increase in home prices over this timeframe. The 1980s, in particular, showed an accelerated rate of increase as the economy boomed.

The 1990s: A Period of Relative Stability and Corrections

The 1990s presented a different picture in the California housing market. After the rapid growth of the late 1980s, the market experienced a period of correction. The initial years saw a slight dip, followed by a period of relative stability with slower, more moderate price increases. This could be attributed to several economic factors at play nationwide and changes in the housing market dynamic.

  • Economic Recession (Early 90s): An economic downturn impacted housing affordability.
  • Technological Advancements: The rise of the internet and tech sector didn't immediately translate into a significant housing boom in the early 90s.

Let's look at the figures:

Date CASTHPI Value
1990-01-01 227.43
1995-01-01 199.68
1999-10-01 250.09

The later part of the decade saw a rebound, foreshadowing the intense growth that would soon follow.

The Dot-Com Boom and Beyond (2000-2007): A Period of Explosive Growth

The early 2000s witnessed a dramatic surge in the California housing market, propelled by the dot-com boom and subsequent low-interest rates. This era is etched in the memories of many Californians, with stories of bidding wars and seemingly impossible price escalations. The California housing market graph 50 years shows this clearly.

Several factors converged to create this perfect storm:

  • The Dot-com Boom: An influx of high-paying tech jobs boosted demand.
  • Low Interest Rates: Made mortgages more accessible and affordable.
  • Speculative Investing: People saw real estate as a surefire investment, driving prices even higher.

Data from this period is strikingly different from the earlier years:

Date CASTHPI Value
2000-01-01 260.96
2005-01-01 538.76
2007-01-01 634.04

The rapid escalation, however, ultimately proved unsustainable.

The Great Recession and Its Aftermath (2008-2011): A Market Correction

The housing bubble burst spectacularly in 2008, plunging the world, including California, into the Great Recession. The California housing market data shows a sharp downturn, as prices plummeted. Foreclosures soared, and the market experienced a painful correction, as this is reflected in the data.

The impact was profound:

  • Job Losses: The tech sector wasn't immune.
  • Foreclosures: Hundreds of thousands of homes went into foreclosure.
  • Tightened Credit: Mortgages became extremely difficult to obtain.

Here's how the data reflects this difficult period:

Date CASTHPI Value
2007-10-01 575.60
2008-10-01 444.67
2011-01-01 391.53

Recovery was slow, a stark contrast to the rapid price increases of the preceding years.

Recovery and Renewed Growth (2012-2024): A Steady Climb

From the ashes of the Great Recession, the California housing market began a slow but steady recovery. The California housing market statistics show a gradual, albeit uneven, climb. This recovery wasn't a simple rebound; it was characterized by careful rebuilding, with new regulations introduced to prevent future crises.

While interest rates remained low for much of this period, the pace of recovery was influenced by several factors:

  • Economic Growth: California’s economy slowly recovered, generating jobs and improving buyer confidence.
  • New Regulations: Measures were put in place to strengthen lending practices.
  • Pent-up Demand: The shortage of housing units in some areas created substantial demand.

Observe the upward trend in the following data:

Date CASTHPI Value
2012-01-01 381.37
2017-01-01 578.98
2024-04-01 959.06

The more recent years have shown particularly strong growth, driven partly by supply limitations and strong demand.

Analyzing the California Housing Market Graph 50 Years: Key Observations

Looking at the California housing market trends, several key observations emerge:

  • Long-term Growth: Despite significant fluctuations, the overall trend is upward. Home prices in California have generally increased over the past 50 years.
  • Cyclicality: The market experiences periods of boom and bust, highlighting the inherent volatility.
  • External Influences: Economic conditions, interest rates, and government policies significantly impact the market.
  • Regional Variations: While this data represents the entire state, significant price variations occur across different regions of California.

Summary:

Understanding the California housing market graph for 50 years is crucial for anyone considering buying, selling, or investing in California real estate. It's not just about numbers; it’s about understanding the historical context, economic forces, and potential risks. The market is dynamic, influenced by many factors, and will likely continue to experience periods of growth and contraction in the years to come. Be informed, be prepared, and seek professional guidance before making any significant decisions. Remember, a solid understanding of the past is often the best way to prepare for the future.

Related Articles:

  • House Price Graph Last 20 Years USA
  • Housing Market Graph 50 Years: Showing Price Growth
  • San Diego Housing Market Graph 50 Years: Analysis and Trends
  • Average Housing Prices by Year in the United States
  • Average Home Value Increase Per Year, 5 Years, 10 Years
  • How Much Did Housing Prices Drop in 2008?
  • Housing Market Crash 2008 Explained: Causes and Effects

Filed Under: Housing Market Tagged With: California Housing Market Graph 50 Years, Housing Market, Housing Market Graph

Will the Cape Coral Housing Market Repeat the Crash of 2008?

July 10, 2025 by Marco Santarelli

Will the Cape Coral Housing Market Repeat the Crash of 2008?

Is Cape Coral heading for another housing market disaster? The short answer is: quite possibly. While it's not a certainty, several warning signs – dropping prices, a glut of homes for sale, and economic uncertainty – suggest that Cape Coral is teetering on the edge. Having been at the heart of the 2008 subprime mortgage crisis, could history be repeating itself? Let's dive deep into what's happening in this Florida city.

Will the Cape Coral Housing Market Repeat the Crash of 2008?

I remember watching the news in 2008, seeing the stories of families losing their homes. Places like Cape Coral were mentioned repeatedly, becoming synonymous with the housing market collapse. Now, seeing similar trends emerge, I am concerned about the potential impact on homeowners and the wider community.

A Ghost from the Past: The 2008 Subprime Mortgage Crisis

Cape Coral wasn't just affected by the 2008 crisis; it was arguably at the epicenter. How did this happen? A perfect storm of factors brewed:

  • Speculative buying frenzy: People were buying homes, not necessarily to live in, but as investments, hoping to flip them for a quick profit.
  • Risky lending practices: Banks were handing out subprime mortgages – loans to people with poor credit histories – with little regard for their ability to repay. Many of these loans had adjustable interest rates or balloon payments, which meant payments could suddenly skyrocket.
  • Ignorance and Greed: People and Businesses were getting rich doing the wrong things.

When the housing bubble burst, the bottom fell out. Speculators walked away from their mortgages, leading to a wave of foreclosures. Cape Coral suffered immensely, and it took years for the market to recover. A 2016 report highlighted that foreclosure levels in Cape Coral were 93% below their peak by that year. So, it recovered eventually.

Cape Coral's Housing Market in 2025: Are We Reliving History?

Fast forward to 2025, and the situation in Cape Coral is, frankly, worrying. Let's look at some key indicators:

  • Falling Home Prices: According to Redfin, in May 2025, Cape Coral home prices were down 7.7% compared to last year, selling for a median price of $361,000. This price drop is a clear sign of a cooling market.
  • Sluggish Home Sales: Buyers are pulling back. Redfin reported that there were 608 homes sold in May this year, down by 5.7% from 645 last year. This indicates decreasing buyer confidence and demand.
  • A Buyer's Market: The power has shifted from sellers to buyers, making it easier for buyers to negotiate better deals.
  • Rising Days on Market: Redfin claims that on average, homes in Cape Coral sell after 76 days on the market compared to 59 days last year.

To put it bluntly, Cape Coral was ranked last among 123 midsize U.S. cities in a 2025 report on the hottest real estate markets, according to Fox 4 Now. That should make anyone in the area sit up and pay attention.

Here's a concise look at the market based on the latest data:

Key Market Indicators Details
Median Home Price (May 2025) $361,000, down 7.7% from previous year (Redfin)
Home Sales (May 2025) 608 homes sold, down 5.7% from May 2024 (Redfin)
Days on Market (May 2025) 76 days on average, compared to 59 days from May 2024 (Redfin)

Why Is Cape Coral Facing This Predicament?

What is behind Cape Coral's current housing woes? Several factors are at play:

  • Declining Home Prices: As mentioned earlier, the steady drop in home prices is a major concern, indicating a market correction. This trend is fueled by reduced demand and an oversupply of homes.
  • High Mortgage Interest Rates: Nobody likes higher interest rate. Currently hovering around 6.94% for a 30-year fixed mortgage, interest rates make buying a home more expensive, pricing many potential buyers out of the market. Experts believe these high rates will persist, adding continued pressure.
  • Economic Uncertainties: When the economy is shaky, people tend to hold back on big purchases like homes. Concerns about job security, inflation, and global issues all contribute to reduced demand.
  • Oversupply of Homes: The combination of post-hurricane listings and new construction has flooded the market with homes, creating fierce competition among sellers.
  • Natural Hazards: Cape Coral is vulnerable to storms, floods, and other natural disasters. These risks lead to higher insurance costs and can negatively impact property values. Knowing that nearly every home in Cape Coral is at risk presents real issues for people trying to sell their House there .
  • Supply Chain Disruptions: Global supply chain issues continue to make building materials more expensive and harder to get. This can delay construction projects and increase costs for developers.
  • Post-Hurricane Ian Impact: The aftermath of Hurricane Ian, which caused massive damage, has contributed to the problem. Many damaged homes have been put on the market, adding to the oversupply.

These factors, combined with Cape Coral’s history, create a fragile situation.

A Comparison: 2008 vs. 2025

While there are similarities between the current situation and the 2008 crisis, there are also crucial differences. In 2008, predatory lending and unsustainable mortgages were the primary drivers. Today, high mortgage rates, economic uncertainty, and an oversupply of homes are the main culprits. While foreclosures are a concern now, the scale is still smaller than what we saw in 2008.

What the Experts Are Saying

Real estate experts are sounding the alarm.

“Housing market headwinds continue to challenge homebuying demand,” warns Dr. Selma Hepp, Chief Economist at Cotality. She identified that Cape Coral’s -6.5% year-over-year price decline in April 2025 stands out against the national growth of 2.0%.

Experts and realtors advise sellers to be realistic about prices and buyers to do their homework.

However, it's not all doom and gloom. A report from Realtor.com predicts a combined 22.8% growth in home sales and prices in the Cape Coral-Fort Myers area for 2025, hinting at a possible turnaround later in the year.

What's Next for Cape Coral's Housing Market?

The future of Cape Coral's housing market is uncertain. While there are signs that the market may be nearing its bottom, high mortgage rates, rising insurance costs, and environmental risks continue to loom.

If you're a potential buyer: This could be an opportunity to find a good deal, but be aware of flood risks and insurance costs.

If you're a seller: Be prepared to adjust your pricing expectations and consider consulting with a local real estate agent.

In Conclusion, Proceed with Caution

Cape Coral's housing market is walking a tightrope in 2025. The risk of a crash is real, and its history as a crisis epicenter only amplifies the concerns. Whether you're a buyer, seller, or investor, proceed with caution, seek expert advice, and stay informed about the latest market trends. While a modest recovery is possible, the path ahead is full of challenges.

Invest in Real Estate in the “Hottest Florida Markets”

Discover high-quality, ready-to-rent properties designed to deliver consistent returns.

Contact Norada today to expand your real estate portfolio with confidence.

Contact our investment counselors (No Obligation):

(800) 611-3060

Get Started Now 

Read More:

  • Is Cape Coral the Next Florida Housing Market to Crash?
  • 5 Popular Florida Housing Markets Are at High Risk of Price Crash
  • 2 Florida Housing Markets Flagged for a Major Price Decline Risk
  • 24 Florida Housing Markets Could See Home Prices Drop by Early 2026
  • Is the Florida Housing Market Headed for Another Crash Like 2008?
  • Key Trends Shaping the Florida Housing Market in 2025
  • This Florida Housing Market Bucks National Trend With Declining Prices
  • Florida Housing Market Crash 2.0? Analyst Warns of 2008 Echoes
  • Tax Relief Proposed as Florida Housing Market Faces Deepening Crisis
  • Is the Florida Housing Market on the Verge of Collapse or a Crash?
  • 3 Florida Cities at High Risk of a Housing Market Crash or Decline
  • Florida Housing Market: Record Supply Expected to Favor Buyers in 2025
  • Florida Housing Market Forecast for Next 2 Years: 2025-2026
  • Florida Housing Market: Predictions for Next 5 Years (2025-2030)
  • Hottest Florida Housing Markets in 2025: Miami and Orlando
  • Florida Real Estate: 9 Housing Markets Predicted to Rise in 2025
  • 3 Florida Housing Markets Are Again on the Brink of a Crash
  • Florida Housing Market Predictions 2025: Insights Across All Cities
  • When Will the Housing Market Crash in Florida?
  • South Florida Housing Market: Will it Crash?

Filed Under: Housing Market, Real Estate Market Tagged With: Cape Coral, Florida, Housing Market, housing market crash, Housing Market Trends

How Long Does It Take to Save Money for a Home in Each State?

July 7, 2025 by Marco Santarelli

How Long Does It Take to Save Money for a Home in Each State?

Dreaming of owning a home? You're not alone! It's a goal for so many of us. But let's face it, saving up a down payment feels like climbing Mount Everest, especially with today's prices and interest rates. So, how long does it REALLY take to save for a home in each state? The answer, according to a recent study, varies wildly from just over a year to nearly three decades! This article gives an in-depth state-wise timeline for how long it takes to save for a home in each state, giving you a practical snapshot of what to expect.

How Long Does It Take to Save for a Home in Each State?

The Ever-Elusive American Dream: Homeownership Today

Buying a home isn't just about the down payment anymore. It's about battling sky-high closing costs, building a safety net for unexpected repairs, and keeping pace with property taxes, insurance, and those HOA fees that always seem to creep up. It's a marathon, not a sprint.

I remember when my parents bought their first house. It felt like a huge accomplishment, a real step towards building a future. Today, I see friends of mine struggling. They earn decent salaries, but the dream of owning a home feels more like a distant fantasy than a tangible goal. This article uses recent data to give you a realistic view of the saving timeline across the US.

The Study Says: Prepare for a Long Haul (in Some States!)

Leave The Key Homebuyers recently crunched the numbers, using data from the Bureau of Economic Analysis and the U.S. Census Bureau. Their findings paint a sobering picture of just how difficult it is to achieve homeownership, especially in certain states.

They looked at median home prices, average incomes, and the general cost of living to determine how long it would take the average earner in each state to save enough for a down payment.

The Big Reveal: Saving Time by State – Find Yours!

Alright, let's get to the heart of the matter. Here's a breakdown of how long it takes to save for a home in each state, according to the study. Note that this data reflects savings for a 10% down payment. (Saving less is possible, but these numbers give a good sense of comparison)

RankStateMedian House Value (2023)Avg Monthly IncomeCost of DepositTime needed to work to afford deposit
1Hawaii$846,400$4,857$84,64028y 10m
2California$725,800$5,762$72,58010y 6m
3Utah$517,700$4,670$51,7708y 5m
4Arizona$411,200$4,691$41,1208y 4m
5Georgia$323,000$4,407$32,3007y 6m
6Oregon$484,800$4,886$48,4807y 6m
7Florida$381,000$5,081$38,1007y 1m
8Nevada$441,100$4,880$44,1106y 7m
9Idaho$428,600$4,414$42,8606y 2m
10Delaware$359,700$4,899$35,9706y 2m
11Colorado$550,300$5,848$55,0305y 9m
12Rhode Island$411,800$4,985$41,1805y 6m
13Washington$576,000$5,935$57,6005y 5m
14Massachusetts$570,800$6,342$57,0805y 3m
15Montana$392,300$4,758$39,2305y 1m
16North Carolina$308,600$4,583$30,8604y 12m
17South Carolina$272,900$4,273$27,2904y 10m
18Maryland$413,600$5,390$41,3604y 10m
19New York$420,200$5,703$42,0204y 10m
20New Jersey$461,000$5,931$46,1004y 10m
21Maine$310,700$4,843$31,0704y 8m
22New Hampshire$415,400$5,818$41,5404y 7m
23Vermont$332,000$4,955$33,2004y 6m
24New Mexico$256,300$4,164$25,6304y 4m
25Virginia$382,900$5,376$38,2904y 3m
26Alaska$347,500$5,495$34,7504y 0m
27Tennessee$307,300$4,745$30,7303y 11m
28Kentucky$211,800$4,145$21,1803y 10m
29Texas$296,900$5,012$29,6903y 9m
30Alabama$216,600$4,079$21,6603y 6m
31Michigan$236,100$4,551$23,6103y 6m
32West Virginia$163,700$4,006$16,3703y 5m
33Louisiana$215,600$4,469$21,5603y 4m
34Minnesota$328,600$5,271$32,8603y 4m
35Indiana$225,900$4,560$22,5903y 3m
36Mississippi$169,800$3,817$16,9803y 3m
37Wisconsin$272,500$4,819$27,2503y 3m
38Missouri$233,600$4,661$23,3603y 2m
39Pennsylvania$259,900$5,068$25,9903y 2m
40Ohio$220,200$4,576$22,0202y 11m
41Connecticut$367,800$6,343$36,7802y 10m
42Illinois$263,300$5,252$26,3302y 10m
43Arkansas$195,700$4,357$19,5702y 5m
44Kansas$219,800$4,925$21,9802y 5m
45Oklahoma$208,600$4,622$20,8602y 4m
46Iowa$213,300$4,713$21,3302y 4m
47Nebraska$245,200$5,351$24,5202y 1m
48North Dakota$246,700$5,437$24,6702y 1m
49South Dakota$268,200$5,551$26,8201y 12m
50Wyoming$298,700$6,058$29,8701y 11m

Key Takeaways: The Good, the Bad, and the Expensive

  • Hawaii: The Land of “Forever Saving.” Clocking in at 28 years and 10 months, Hawaii is, unfortunately, the place where the dream of homeownership may feel like a very, very distant one. This isn't surprising given its sky-high property values, driven by limited supply, desirable climate, and strong tourist economy.
  • California: Coastal Dreams, Pricey Realities. Over a decade (10 years and 6 months) to amass a down payment. Just imagine all the avocado toast you'd have to skip! Demand is high due to thriving tech economies but also because of limited geographic space.
  • The Mountain West: Utah and Arizona. Not far behind, with 8 years and 5 months and 8 years and 4 months, respectively. These states have seen massive growth, driving up prices.
  • The “Sweet Spot”: Several states offer a more realistic saving timeline of between 3 to 5 years. This includes many states in the Southeast, Midwest, and even some Northeastern states.
  • Wyoming & the Dakotas: Bucking national trends, several of these states have saving timelines of just over two years. It's the best-case scenario for aspirational prospective homebuyers.

“Hawaii and California are idyllic in many ways, offering buyers access to the sun and sea. However, these states struggle to provide affordable housing,” says Hannah Jones, senior economic research analyst at Realtor.com®.

Why the Disparity? A Little Economic Food for Thought

Why are some states so much more difficult than others when it comes to saving for a house? It comes down to a complex dance of a few different factors:

  • Housing Supply vs. Demand: It's economics 101. If demand is high and there aren't enough houses available, prices go up. States with desirable locations, thriving job markets, and limited building space (like coastal areas) tend to have this problem.
  • Income Levels: Even if housing costs are reasonable, low average incomes make it harder to save.
  • Cost of Living: States with high overall cost of living, including things like groceries and transportation, leave less money available for saving towards a down payment.
  • Zoning and Land Use Regulations: Restrictive zoning laws can limit the type and amount of new housing that can be built, contributing to a housing shortage and higher prices.

Personal Thoughts and Expert Opinion

Looking at these numbers, it's easy to get discouraged. However, I think it's important to remember that this is just one snapshot in time. Housing markets fluctuate, interest rates change, and policies can shift.

Furthermore, there are always ways to make the dream of homeownership more attainable:

  • Consider Alternative Locations: Maybe your dream city is unaffordable right now. Be open to exploring nearby towns or even different parts of the country. Relocating might sound scary but the reality is that work is increasingly remote-friendly and can permit this lifestyle.
  • Explore First-Time Homebuyer Programs: Both state and federal governments offer programs designed to help first-time homebuyers with things like down payment assistance and lower interest rates.
  • Boost Your Income: Look for ways to increase your earnings, whether it's through a side hustle, a new job, or further education/training.
  • Get Serious About Budgeting: Track your spending and identify areas where you can cut back. Even small savings can add up over time.
  • Talk to a Financial Advisor: A financial advisor can help you create a personalized savings plan and explore different strategies for reaching your goals.

Millennials and Gen Z: Navigating a Tricky Market I know from experience it can feel disheartening to enter into the housing market as a younger person. However, I think that rates will eventually dip, and housing may be more affordable overall. Saving as aggressively as possible is an approach of mine.

Bottom Line: Knowing how long it takes to save for a home in your state is the first step. While the numbers may be daunting, they also empower you to make informed decisions, adjust your strategies, and stay motivated.

The American dream of owning a home may be evolving, but it's still within reach for many. It just takes planning, perseverance, and maybe a little bit of luck.

Invest in Top Real Estate Markets in the U.S.

Looking to tap into the top real estate markets of 2025? Norada connects you with the best investment properties in the most promising cities across the U.S.

Secure high-demand, cash-flowing rental properties in the hottest growth markets before competition heats up even more!

HOT NEW LISTINGS JUST ADDED!

Speak with our expert investment counselors today (No Obligation):

(800) 611-3060

Get Started Now 

Read More:

  • Top 10 Places With Worst Housing Crisis Outlook in 2025
  • Top 10 Housing Markets Seeing Incredible Double-Digit Growth in 2025
  • Top 10 Housing Markets Attracting Foreign Homebuyers in 2025
  • Top 15 Real Estate Markets to Buy Investment Properties in 2025
  • 20 Best Places to Buy a House in the US
  • Best Places to Invest in Single-Family Rental Properties
  • 5 Best Places to Buy and Sell a House in Spring 2025
  • 10 Best States to Buy a House in 2025
  • Top 10 Least Expensive Places to Buy a House in 2025
  • Top 10 Housing Markets Where Gen Zs Are Buying Homes
  • Top 20 Hottest Housing Markets Predicted for 2025
  • 10 Hottest Housing Markets Predicted for 2025: Sun Belt Boom
  • 5 Hottest Real Estate Markets for Buyers & Investors in 2025

Filed Under: Housing Market Tagged With: Housing Crisis, Housing Market

Is the U.S. Heading Toward a Real Estate Crash and Debt Bubble?

July 7, 2025 by Marco Santarelli

Is the U.S. Heading Toward a Real Estate Crash and Debt Bubble?

It seems like every other conversation I have, whether with friends, family, or even casual acquaintances, eventually drifts towards the big, looming question: Is the U.S. heading to a real estate crash? Given the rollercoaster of the past few years and the echoes of 2008 still lingering in our collective memory, it's a valid concern. Let me put your mind at ease, at least somewhat: while there are definitely pressures and strains in the system, the data and expert consensus as of mid-2025 suggest we are not on the brink of a 2008-style real estate crash or an imminent debt bubble collapse. However, that doesn't mean it's all smooth sailing, and understanding the nuances is key.

Unpacking the “Crash” Fears: What's Really Happening with Home Prices?

That chilling word, “crash,” brings back some pretty vivid memories for many of us. We remember the foreclosures, the plummeting values, and the sheer panic of the Great Recession. So, when 70% of Americans voice worry about a housing crash, as reported by Keeping Current Matters, I completely get it. But is history repeating itself? Let's dig into what the 2025 housing market actually looks like.

The 2025 Home Price Picture: Growth, But Not Everywhere

If you're looking for a nationwide, dramatic drop in home prices, you're likely to be disappointed (or relieved, depending on your perspective!). The S&P CoreLogic Case-Shiller Home Price Index showed a 3.9% annual gain in February 2025. That’s a bit slower than the 4.1% from January, but it’s still growth. Looking ahead, the National Association of Realtors (NAR) is even predicting a 3% rise in median home prices for 2025, with an expectation of 4% in 2026.

Now, it's not all uniform. Zillow, for instance, has a slightly different take, forecasting a modest national decline of 1.9% in home values. This tells me that the market is complex and definitely not a one-size-fits-all situation. Regional differences are playing a huge role:

Region Price Trend Key Factors My Two Cents
Northeast Stronger price gains Income growth, severe shortage of homes (Forbes) This region has older housing stock and less new construction, making any available home highly contested.
Southeast & West Weaker gains, possible discounts Increased inventory, softening demand (Forbes) These areas saw huge run-ups post-pandemic. A bit of a cool-down isn't surprising; some markets might have gotten a little ahead of themselves.

What I see here is a market that's normalizing rather than collapsing. Some areas might see slight dips, especially those that got overheated, while others will continue to see steady, if unspectacular, growth.

The Elephant in the Room: Why Isn't Supply Catching Up?

The number one reason most experts, myself included, don't foresee a crash is simple: there just aren't enough homes to go around. Mark Fleming, Chief Economist at First American, put it perfectly: “There’s just generally not enough supply. There are more people than housing inventory. It’s Econ 101.” And Lawrence Yun from NAR echoes this, stating, “…if there’s a shortage, prices simply cannot crash.”

Data from Realtor.com confirms this. While single-family homes for sale are up 20% year-over-year, inventory is still near record lows historically. This isn't a new problem; we've been underbuilding for over a decade.

Then there's what I call the “golden handcuffs” phenomenon, or the “lock-in issue” as JPMorgan calls it. Think about it: over 80% of current homeowners with mortgages are sitting on rates significantly below today's levels (which are hovering around 6.7%). Would you want to sell your home and trade your 3% mortgage for a nearly 7% one if you didn't absolutely have to? Probably not. This keeps a huge chunk of potential inventory off the market. I believe this lock-in effect is one of the most powerful, yet sometimes underestimated, forces shaping today's market. It's not just an economic statistic; it's a deeply personal financial decision for millions.

Mortgage Rates: The Squeeze on Buyers

Let's talk about those mortgage rates. They're the gatekeepers of affordability. Experts are generally predicting rates to stabilize somewhere between 6.5% and 6.7% through 2025. Don't hold your breath for a significant drop below 6%.

What does this mean for buyers? Well, for a $361,000 home with a 20% down payment at a 6.65% rate, the monthly principal and interest payment is around $1,853. Forbes notes this is only $9 more than in 2024, but let's be real – housing was already expensive in 2024 for many. Affordability is a genuine challenge, especially for first-time homebuyers. I'm seeing more and more young people and families priced out, turning to the rental market instead, which, in turn, puts upward pressure on rents. It's a tough cycle.

The New York Times reported that 2024 was the slowest housing market in decades. While 2025 might not be a barn burner either, the underlying conditions – low supply and persistent, albeit somewhat suppressed, demand – just don't scream “crash.” Selma Hepp, Chief Economist at CoreLogic (misattributed as Cotality in the source, but CoreLogic is her firm), reinforces this: “Unless there is a significant surge in the rate of unemployment… the housing market is expected to continue to rebound from 2023 lows.”

So, Are We Drowning in Debt? A Look at the U.S. Debt Mountain

The other side of this coin is debt. If real estate isn't crashing, is a “debt bubble” about to pop and take everything down with it? It's a fair question, especially when you hear the headline numbers.

Just How Big is Our Collective Tab?

U.S. household debt did indeed hit a record $18.2 trillion in the first quarter of 2025. That's a big, scary number. Let's break it down:

  • Mortgage Debt: $12.8 trillion (up $190 billion from Q4 2024) – This is the lion's share, about 70%.
  • Student Loans: $1.631 trillion (up $16 billion)
  • Auto Loans: $1.642 trillion (actually down $13 billion)
  • Credit Card Debt: $1.182 trillion (also down $29 billion)
  • Home Equity Lines of Credit (HELOCs): $402 billion (up $6 billion)

Seeing those mortgage numbers climb alongside rising home prices makes sense. But here's a crucial piece of context: the debt-to-GDP ratio was 73% in early 2023. While I'd love to see that lower, it's actually less than in some previous years. This tells me that, relative to the size of our economy, the debt load, while high, isn't necessarily at an immediate breaking point on a macro level.

Can We Actually Afford This Debt? The Delinquency Story

The total amount of debt is one thing; our ability to pay it back is another. The debt service burden – that's the fancy term for debt payments relative to our disposable income – is currently around 11.3%. Historically speaking, this is lower than it was for much of the 2000s, which suggests households, on average, are managing.

However, there are definitely some warning signs I'm keeping a close eye on. Delinquency rates for credit card and auto loans are rising, reaching levels that do bring back uncomfortable memories of the lead-up to 2008. This is where I see the most immediate stress. It tells me that some households are struggling with inflation and higher interest rates on these types of variable or shorter-term debts.

Now, for the big one: mortgage delinquencies. They did tick up to 4.04% in Q1 2025. That's an increase, yes, but it's still below the historical average of 5.25% (from 1979–2023). Foreclosure starts also rose slightly to 0.20%, but here's the kicker: homeowners are sitting on a mountain of equity – an estimated $34.7 trillion in Q4 2024. This equity acts as a massive cushion. Unlike 2008, when many were underwater, today's homeowners, even if they face hardship, often have the option to sell and walk away with cash, rather than defaulting. This is a fundamental difference.

Is a “Debt Bubble” About to Pop? My Analysis

So, are we in a debt bubble ready to burst? My take is no, not in the catastrophic, systemic way we saw before. Here's why:

  1. Stricter Lending Standards: The “liar loans” and no-doc mortgages of the pre-2008 era are largely gone. Today's mortgage borrowers are generally more qualified.
  2. Massive Home Equity: As mentioned, that $34.7 trillion in equity is a game-changer. It prevents a cascade of foreclosures.
  3. Debt Composition: While overall debt is high, the riskiest parts of it (like subprime mortgages from the past) are a much smaller component of the overall picture.

However, this doesn't mean there are no risks. A significant spike in unemployment (the Federal Reserve projects 4.4% in 2025, which is an increase but not calamitous) could absolutely strain household finances further. If people lose their jobs, those credit card and auto loan delinquencies could worsen, and mortgage stress could follow. The key here is the severity of any economic downturn.

What I'm more concerned about isn't a “bubble pop” that craters the financial system, but rather a prolonged period where an increasing number of families feel financially squeezed by the combination of high housing costs and persistent debt service, especially on non-mortgage items.

The X-Factors: Politics, Policies, and Other Wildcards

Economics doesn't happen in a vacuum. Politics and policy decisions can throw curveballs, and it's worth considering some of these.

Potential Policy Shifts and Their Ripple Effects

With elections always on the horizon, we have to consider how different administrations might approach things. For example, a potential Trump administration has floated ideas like:

  • Streamlining zoning approvals: This could, in theory, help with housing supply, which would be a positive.
  • Reducing immigration: This could have a mixed impact. While it might reduce some demand, it could also shrink the construction labor force (around 30% of which is immigrant labor, according to JPMorgan). This could exacerbate shortages and drive up costs.
  • Tariffs: Forbes estimates that tariffs could increase construction costs by as much as $10,900 per home. In a market already struggling with affordability, that's not helpful.

Eswar Prasad, an economist at Cornell University, rightly points out that such policy shifts can create economic uncertainty. When businesses and consumers are uncertain, they tend to pull back on spending and investment, which can slow the economy.

The Global Economic Climate: Are We an Island?

While we've focused on the U.S., it's important to remember we're part of a global economy. International events, global inflation trends, supply chain disruptions (as we saw during the pandemic), or geopolitical instability can all send ripples our way. For instance, if global energy prices spike, that affects everything from transportation costs to the price of goods, further squeezing household budgets here. I don't see an immediate global threat that derails the U.S. specifically right now, but it's a factor that always needs monitoring.

Navigating the Uncertainty: My Advice for You

Okay, so what does all this mean for you, personally? Whether you're looking to buy, already own, or invest, here's how I see it.

For Hopeful Homebuyers

My strongest piece of advice is don't wait for a crash that's highly unlikely to materialize in the way some might imagine. The fundamentals of low supply and steady (even if somewhat muted) demand just don't support a dramatic price collapse.

  • Focus on long-term affordability: Don't just look at the monthly mortgage payment. Consider property taxes, insurance, potential HOA fees, and maintenance. Can you comfortably afford the total cost of ownership, even if interest rates tick up a bit more or your income plateaus for a while?
  • Get pre-approved before you shop: Seriously, this is crucial. Know your budget. It saves heartache and helps you make realistic offers.
  • Be patient and persistent: The market is competitive, especially for good homes in desirable areas. It might take time to find the right place at a price you can manage. Don't get discouraged.
  • Consider your timeline: If you plan to stay in the home for 5-7 years or more, you're more likely to ride out any short-term market fluctuations and build equity.

For Current Homeowners

If you're already a homeowner, particularly one with a low-rate mortgage, you're generally in a good position.

  • Appreciate your equity: You've likely seen significant gains in home value. That's a powerful financial asset.
  • Think carefully before moving: If you have a sub-4% mortgage, giving that up for a 6.5%+ rate is a big financial leap. Only move if there's a compelling life reason (job, family, etc.). The “golden handcuffs” are real.
  • Be cautious with HELOCs: Tapping into your home equity can be a useful tool, but do it wisely. Have a clear plan for the funds and ensure you can comfortably manage the repayments, especially if rates on HELOCs rise.

For Investors

The days of easy, double-digit annual returns in real estate are likely on pause for a bit.

  • Expect modest returns: With slower price growth and higher interest rates, cap rates are compressed.
  • Look for specific opportunities: Instead of broad market bets, you might need to dig deeper for undervalued properties, niche markets, or value-add opportunities.
  • Cash flow is king: In this higher-rate environment, properties that generate positive cash flow from day one are more attractive and resilient than speculative appreciation plays. I always tell my investor clients that hoping for appreciation is gambling; planning for cash flow is business.

My Final Thoughts: Caution, Not Catastrophe

So, back to that big question: Is the U.S. heading to a real estate crash and debt bubble? My analysis, based on the current data and expert insights for 2025, is no, not in the dramatic, 2008-esque way that many fear.

The housing market is supported by a fundamental undersupply of homes and the “lock-in” effect of low existing mortgage rates, which should prevent a sharp, widespread crash in prices. We're more likely to see continued modest growth in many areas, with some potential softening or slight declines in previously overheated markets – a correction, not a collapse.

On the debt side, while total household debt is at a record high, the crucial mortgage sector is generally stable due to stricter lending and significant homeowner equity. The rising delinquencies in credit card and auto loans are certainly a concern and point to stress in parts of the consumer economy, but they don't currently appear to pose a systemic threat to the financial system in the same way mortgage-backed securities did in 2008.

This doesn't mean we can all relax and ignore the warning signs. Affordability will remain a major challenge. Certain households will face significant financial strain. Economic uncertainties, whether from domestic policy or global events, could shift the outlook. Vigilance and smart financial planning are more important than ever.

What I see is a period requiring more caution, more careful decision-making, and a realistic understanding of the economic pressures at play. It’s a time for resilience, not panic. The U.S. economy has weathered storms before, and while the current conditions are complex, they don't spell imminent doom for the housing market or a full-blown debt catastrophe.

“Invest in Turnkey Real Estate: Simple & Profitable”

With growing fears of a real estate crash and a looming debt bubble, it’s more important than ever to choose low-risk, high-cash-flow markets with long-term fundamentals.

Norada helps investors navigate turbulent times by identifying strong markets backed by job growth, population gains, and affordability.

HOT NEW LISTINGS JUST ADDED!

Talk to a Norada investment counselor today (No Obligation):

(800) 611-3060

Get Started Now

Recommended Read:

  • 5 Riskiest Housing Markets to Avoid in 2025 That May Crash
  • Housing Market Predictions for the Next 4 Years: 2025-2029
  • Top 22 Housing Markets Where Prices Are Predicted to Rise the Most by 2026
  • Housing Market Predictions 2026: Will it Crash or Boom?
  • 12 Housing Markets Set for Double-Digit Price Decline by Early 2026
  • 4 States Facing the Major Housing Market Crash or Correction
  • Housing Prices Are Set to Rise by 4.1% by the End of 2025
  • Housing Market Predictions for the Next 4 Years: 2025 to 2029
  • Real Estate Forecast: Will Home Prices Bottom Out in 2025?
  • Housing Markets With the Biggest Decline in Home Prices Since 2024
  • Why Real Estate Can Thrive During Tariffs Led Economic Uncertainty
  • 5 Hottest Real Estate Markets for Buyers & Investors in 2025
  • Will Real Estate Rebound in 2025: Top Predictions by Experts
  • Will the Housing Market Crash Due to Looming Recession in 2025?

Filed Under: Housing Market, Real Estate Market Tagged With: Debt Bubble, Housing Market, real estate, Real Estate Crash

10 Housing Markets Predicted to Boom Amid Economic Uncertainty in 2025

July 7, 2025 by Marco Santarelli

10 Housing Markets Predicted to Boom Amid Economic Uncertainty

Are you trying to figure out where to invest in real estate, even with all the ups and downs in the economy? You're not alone. Many of us are looking for stable and profitable places to put our money. Based on the latest data, despite a projected overall decline in home values nationally, several smaller housing markets are expected to buck the trend and actually boom.

This article reveals 10 housing markets set to boom amid economic uncertainty, projecting growth of at least 3% in home prices between May 2025 and May 2026. Let's dive into these promising locations and understand why they're poised for growth.

Honestly, trying to predict the real estate market feels a bit like trying to herd cats. There are so many factors at play. Zillow's latest forecast paints a moderately pessimistic picture for the overall housing market in 2025. They anticipate a 1.4% decrease in home values, mainly due to an increase in the number of houses available for sale. With higher mortgage rates and worries about job security, some potential buyers are hesitant, which increases the pressure on prices.

However, it's not all doom and gloom. Zillow predicts that existing home sales will slightly increase to 4.14 million in 2025, which is a small lift from their earlier analysis. More houses for sale might bring prices down a bit, but it also gives buyers more choices and a stronger negotiating position.

Rents are also expected to rise, though more modestly. Single-family rents are projected to increase by 2.8%, while multifamily rents will grow by 1.6%. These lowered forecasts suggest the rapid construction over the last few years is normalizing the market and increasing vacancy rates.

Think Local: Why Niche Markets Offer Opportunities

While the national outlook might be subdued, real estate is fundamentally local. Broad generalizations often miss the unique dynamics of individual markets. That's where the hidden opportunities lie. Certain areas are insulated from the national trends due to specific factors like local economies with strong job growth, desirable lifestyle attributes, or limited housing supply.

Instead of just focusing on national news, savvy investors pay keen attention to the local communities where they either want to reside or feel represent the best return on investment. They consider indicators like job growth, population shifts, local government plans, and new amenities to decide on the markets where they can get a boom.

10 Housing Markets Predicted to Boom Amid Economic Uncertainty

Here's a closer look at the 10 markets that are expected to outperform the broader market, based on projections indicating at least 3% growth in home prices between May 2025 and May 2026:

RegionName RegionType StateName Predicted Growth (May 2025 – May 2026)
Statesboro, GA msa GA 3.5%
Atlantic City, NJ msa NJ 3.4%
Edwards, CO msa CO 3.4%
Brevard, NC msa NC 3.4%
Price, UT msa UT 3.4%
Thomaston, GA msa GA 3.3%
Steamboat Springs, CO msa CO 3.2%
Cornelia, GA msa GA 3.1%
Keene, NH msa NH 3.0%
Maysville, KY msa KY 3.0%

Let's examine these locations and see if we understand why they are projected to be profitable, so you can determine investment opportunities.

A Deeper Dive into the Markets

Let's investigate why these markets may get ready to boom:

  1. Statesboro, GA:
    • Why it might boom: Statesboro is home to Georgia Southern University, which brings a constant influx of students and faculty. The city also benefits from its location near Savannah, offering a balance of small-town charm and access to larger city amenities. A steady demand for housing, coupled with potentially lower construction costs compared to larger metro areas, might fuel growth. I have watched this one grow and have been impressed.
    • Things to consider: Dependency on the university could create volatility. Further, I have seen limited job opportunities outside of the academic and service sectors.
  2. Atlantic City, NJ:
    • Why it might boom: After years of decline, Atlantic City is attempting to reinvent itself. New development projects, casino renovations, and efforts to diversify the economy beyond gambling could attract new residents and investment. The lower cost of living compared to other parts of New Jersey and proximity to the coast could be attractive. I also think that this area still offers a solid investment opportunity.
    • Things to consider: Atlantic City's economic recovery is still fragile, and there is an ongoing risk of setbacks.
  3. Edwards, CO:
    • Why it might boom: Nestled in the Vail Valley, Edwards offers access to world-class skiing and outdoor recreation. Its appeal to affluent buyers seeking vacation homes or a high quality of life could drive prices up. I know that many people are moving there because there are so many outdoor activities.
    • Things to consider: High cost of living and limited inventory could make it difficult for some buyers to enter the market. The economy is heavily dependent on tourism.
  4. Brevard, NC:
    • Why it might boom: Located in the Blue Ridge Mountains, Brevard is attracting retirees and those seeking a more peaceful lifestyle. The area's natural beauty, outdoor recreational opportunities, and growing arts scene are key draws. I am familiar with the area, and I think the growth will surprise people.
    • Things to consider: A limited number of job opportunities may hinder economic growth. The area's rural location may not appeal to everyone.
  5. Price, UT:
    • Why it might boom: Price is a small town with a growing population. It's the only town in a big area so anyone looking for services goes to Price. Cheap housing and good employment make this region boom.
    • Things to consider: A limited number of job opportunities may hinder economic growth. The area's rural location may not appeal to everyone.
  6. Thomaston, GA:
    • Why it might boom: Thomaston may see growth due to its increasing population, the fact that the city is the county seat and the growing need for housing.
    • Things to consider: A limited number of job opportunities may hinder economic growth. The economy is heavily dependent on location.
  7. Steamboat Springs, CO:
    • Why it might boom: With a small population, Steamboat Springs offers an intimate location to live.
    • Things to consider: A limited number of job opportunities may hinder economic growth. The economy also depends on location.
  8. Cornelia, GA:
    • Why it might boom: Cornelia may see growth due to its increasing population, the fact that the city neighbors a few others and the growing need for housing.
    • Things to consider: A limited number of job opportunities may hinder economic growth. The economy is heavily dependent on local businesses.
  9. Keene, NH:
    • Why it might boom: Keene may see growth due to being a college town, the fact that is relatively close to Boston and the growing need for housing.
    • Things to consider: A limited number of job opportunities may hinder economic growth. The economy is heavily dependent on college activities.
  10. Maysville, KY:
    • Why it might boom: Maysville is a small-town community which attracts the locals. The people who reside there are true residents and enjoy the area.
      • Things to consider: A limited number of job opportunities may hinder economic growth. The economy is heavily dependent on agriculture.

Important Considerations Before Investing

Before you pack your bags and start making offers, remember that these are just projections, so do your own research. Here are a few crucial things to keep in mind:

  • Due Diligence: Don't rely solely on forecasts. Thoroughly research each market. Look at local economic indicators, job growth, population trends, planned developments, and the overall quality of life.
  • Local Expertise: Connect with local real estate agents, property managers, and other professionals who have firsthand knowledge of the market. They can provide valuable insights and help you navigate the intricacies of buying or selling property in that area. I find that local experts will give you the most up to date and accurate information.
  • Risk Tolerance: Assess your own risk tolerance and investment goals. Investing in smaller or emerging markets can offer higher potential returns, but it also comes with increased risk.
  • Long-Term Perspective: Real estate is generally a long-term investment. Be prepared to hold onto your property for several years to realize its full potential.

Diversification and Flexibility Are Key

Never put all your eggs in one basket. Diversifying your real estate portfolio across different markets and property types is a smart way to mitigate risk. Also, remain flexible and adaptable to changing market conditions. The real estate market can shift quickly, so it's important to stay informed and be prepared to adjust your strategy as needed.

Final Thoughts: Opportunity Knocks, But Do Your Homework

While the national housing market navigates uncertainty, these 10 housing markets offer potential opportunities for investors seeking growth. However, success depends on careful research, local knowledge, and a well-thought-out investment strategy. So, before you jump in, do your homework, consult with local experts, and make informed decisions that align with your financial goals.

Invest in Real Estate in the Booming Markets of the U.S.

Discover high-quality, ready-to-rent properties designed to deliver consistent returns.

Contact us today to expand your real estate portfolio with confidence.

Contact our investment counselors (No Obligation):

(800) 611-3060

Get Started Now 

Recommended Read:

  • Top 10 Housing Markets Seeing Incredible Double-Digit Growth in 2025
  • Top 10 Housing Markets Attracting Foreign Homebuyers in 2025
  • Top 15 Real Estate Markets to Buy Investment Properties in 2025
  • 20 Best Places to Buy a House in the US
  • Best Places to Invest in Single-Family Rental Properties
  • 5 Best Places to Buy and Sell a House in Spring 2025
  • 10 Best States to Buy a House in 2025
  • Top 10 Least Expensive Places to Buy a House in 2025
  • Top 10 Housing Markets Where Gen Zs Are Buying Homes
  • Top 20 Hottest Housing Markets Predicted for 2025
  • 10 Hottest Housing Markets Predicted for 2025: Sun Belt Boom
  • 5 Hottest Real Estate Markets for Buyers & Investors in 2025

Filed Under: Housing Market, Real Estate Market Tagged With: Housing Market, housing market predictions, Real Estate Market

Is One Big Beautiful Bill a Game-Changer for the Housing Market and Mortgages?

July 7, 2025 by Marco Santarelli

Is One Big Beautiful Bill a Game-Changer for the Housing Market and Mortgages?

Will Trump's “Big Beautiful Bill” truly reshape the housing market? The answer is complex. Signed into law on July 4, 2025, this legislation brings a mix of tax cuts and new policies that could have significant impacts on homebuyers, renters, investors, and the mortgage industry. While some provisions aim to boost affordable housing and provide tax relief, others raise concerns about affordability and supply. Let's dig deeper into what this bill actually does and who benefits (and who doesn't).

Is One Big Beautiful Bill a Game-Changer for the Housing Market and Mortgages?

What exactly IS the “Big Beautiful Bill?”

This bill is a broad budget and tax package that touches upon various aspects of American life. But for our purposes, we need to focus on its implications for housing and mortgages. Here are some key takeaways:

  • Low-Income Housing Tax Credit (LIHTC) Expansion: This is probably the most impactful aspect of the bill for affordable housing. It increases the 9% LIHTC allocation and reduces the bond financing requirement for 4% LIHTCs. This could mean significantly more affordable rental homes in the coming years.
  • State and Local Tax (SALT) Deduction Increase: Homeowners in states with high property taxes may catch a break here. The SALT deduction cap is bumped up, potentially saving families money.
  • Permanent Mortgage Insurance Deduction: A bit of good news for those with smaller down payments. This makes deductions for private mortgage insurance (PMI) permanent.
  • Permanent Mortgage Interest Deduction Cap: Setting a secure upper limit for mortgage interest deductions at \$750,000 offers certainty for the housing market.
  • Termination of Energy Efficiency Credits: This part isn't so great. Eliminating credits for energy-efficient home improvements could ironically drive up the cost of constructing new houses.
  • Block on Rent-Setting Algorithm Regulation: In my opinion, this is a real problem. Preventing states from regulating AI-based rent-setting systems could lead to unchecked rent increases.

These are the core components. Before we proceed, I've compiled all this key information in table format.

Provision Impact
LIHTC Expansion Increased affordable rental housing supply
SALT Deduction Increase Potential tax savings for homeowners in high-tax states
Permanent Mortgage Insurance Deduction Reduced cost of low-downpayment loans
Permanent Mortgage Interest Deduction Cap Stability for borrowers and lenders
Termination of Energy Efficiency Credits Increased construction costs
Block on Rent-Setting Algorithm Regulation Potential for higher rents

Now, let's dive into how these provisions affect different groups of people.

Who wins (and who loses) in this equation?

It's not a simple question. The “Big Beautiful Bill” has different implications for different segments of the population, and that's what we're going to discuss here in detail.

High-End Buyers and Investors: A Reason to Smile?

In my opinion, this is where the bill provides the clearest benefits. Wealthier homebuyers and real estate investors, especially in high-tax, high-cost states, have reason to be optimistic.

  • SALT Deduction Increase: The increase in the SALT deduction cap is a big deal for homeowners in places like New York, California, and New Jersey. They can now deduct more of their state and local taxes, potentially saving thousands of dollars per year.
  • QBI Deduction and Bonus Depreciation: These are tax breaks specifically for real estate investors. They allow them to deduct a larger portion of their business income and depreciate renovation costs more quickly, encouraging investment in rental properties and commercial real estate.
  • Retention of Section 1031 Exchanges: Allows tax-deferred property swaps for investors.

For example, if you live in a state where your property taxes alone exceed $10,000 (and many do!), this increase in the SALT deduction will directly translate to tax savings. Plus, those incentives for real estate investment are designed to stimulate activity in the market.

Lower-Income Renters and First-Time Buyers: A More Uncertain Future?

This is where things get complicated. While the bill does have some positives for this group, the net effect might not be as beneficial as hoped.

  • LIHTC Expansion: This is undeniably a good thing. More affordable rental housing is desperately needed in this country, and the LIHTC expansion could help ease cost burdens for low-income tenants. However, keep in mind that it will take time for these new units to be built and become available.
  • Social Program Cuts: Here's the rub. The bill also includes significant cuts to social programs like Medicaid and SNAP, potentially straining low-income households and making it more difficult to afford rent or save for a down payment.
  • No New Down Payment Assistance: The absence of new federal down payment assistance programs means that first-time homebuyers will still need to rely on state and local programs, which can be difficult to access or insufficient.

In my view, the LIHTC expansion is a step forward, but it's not enough to offset the potential negative effects of the social program cuts. The reality is that many low-income renters and first-time buyers may not feel any immediate relief from this bill.

Housing Supply: Will It Actually Increase?

The U.S. has been facing a serious housing shortage for years now, and any policy that aims to address this issue is worth examining closely. The “Big Beautiful Bill” tries to tackle this problem in a couple of ways:

  • LIHTC Expansion: This encourages the construction of more affordable rental units.
  • Opportunity Zone Incentives: Which are intended to stimulate investments in underserved communities. However, it depends on the execution.
  • Termination of Energy Efficiency Credits: On the downside, eliminating these credits could raise construction costs, making it more expensive to build new homes.

Unfortunately, tariffs on imported construction materials may further slow building.

The Mortgage Industry: A Modest Boost?

The mortgage industry stands to benefit from a few key provisions in the bill:

  • Permanent Mortgage Insurance Deduction: This reduces the effective cost of low-down-payment loans, which benefits both borrowers and lenders.
  • Permanent Mortgage Interest Deduction Cap: This provides planning certainty for borrowers and lenders, particularly in high-cost markets. As I said, the certainty this provision allows is greatly useful.

While these measures might encourage more first-time buyers to enter the market, the lack of new federal down payment assistance limits the bill's overall impact. Some feel that a more targeted approach would be more effective.

Rent-Setting Algorithms – A Potential Affordability Crisis?

This is a critical area to watch closely. If this provision stands, it could exacerbate the affordability crisis for renters, particularly in high-cost markets.

Regulating rent-setting algorithms is a potential issue that worries me a lot. This prevents states from regulating AI models used for determining rental prices, a move that 40 state attorneys general oppose. Their concern is that this could lead to higher rents and reduced affordability, especially in already expensive areas.

Regional Variations: A Patchwork of Impacts

It's important to remember that the impact of this bill will vary significantly depending on where you live.

  • High-Tax States: Residents of states like New York, New Jersey, Massachusetts, Illinois, and California will likely see the most immediate benefits from the increased SALT deduction cap, making homeownership more attractive for some.
  • Lower-Tax States: Areas with lower tax burdens and looser housing supply, such as parts of Texas or the Midwest, may experience less direct benefit from the bill.
  • LIHTC Impact: The supply-side effects of the LIHTC expansion will take time to materialize, meaning that high-cost cities like San Francisco or New York are unlikely to see immediate relief from affordability pressures.

In other words, this bill isn't a one-size-fits-all solution. Some regions will benefit more than others, and the long-term effects are still uncertain.

The Broader Economic Context: An Uphill Battle?

It's crucial to consider the “Big Beautiful Bill” within the context of the broader economic challenges facing the U.S. housing market.

  • Housing Shortage: As I pointed out earlier, we're still facing a significant shortage of homes.
  • High Mortgage Rates: Mortgage rates remain elevated, making it more expensive to buy a home.
  • Elevated Prices: Home prices are still high in many markets, putting homeownership out of reach for many Americans.
  • Addition to National Debt: The bill's \$2.4 trillion addition to the national debt over the next decade could push interest rates higher, increasing borrowing costs for homebuilders and homebuyers.

Proposed budget cuts to housing and community development programs could further strain affordability.

In conclusion, while the “Big Beautiful Bill” offers some potential benefits for the U.S. housing market, it's not a magic bullet. High-end buyers and investors in high-tax states stand to gain the most, while lower-income renters and first-time buyers may see limited immediate support.

The LIHTC expansion could lead to long-term growth in affordable housing, but broader economic pressures and regional variations will continue to shape the market. Personally, I believe we need a more comprehensive approach to address the housing affordability crisis, one that combines targeted tax relief, increased housing supply, and robust social safety nets.

Leverage the “BBBA” for Smarter Real Estate Moves

If the “Big Beautiful Bill Act” reshapes housing policy and mortgage access, savvy investors have a unique opportunity.

Norada helps you navigate the changing landscape with turnkey rental properties that benefit from strong financing options and market stability.

HOT NEW LISTINGS JUST ADDED!

Talk to a Norada investment counselor today (No Obligation):

(800) 611-3060

Get Started Now

Read More:

  • Trump’s Section 8 Housing Cuts: Will Millions Face Homelessness?
  • Top Reasons Behind the End of the Trump-Musk Alliance in 2025
  • What is Trump's Plan for Privatizing Fannie Mae and Freddie Mac?
  • Elon Musk's $10,000 Homes: A Game Changer for the Housing Market?
  • Elon Musk Calls for Major Reforms at the U.S. Federal Reserve
  • Can Elon Musk Revolutionize Affordable Housing for Americans?
  • Emergency Price Relief on Housing: What Does Trump's Order Mean?
  • Trump's Inaugural Speech: Bold Plans on Border, Economy, and More
  • What Happens to Kamala Harris' Proposal of $25,000 Homebuyer Assistance Now?
  • Housing Market Predictions for 2025 if “Trump” Wins Election
  • 10 Housing Market Predictions Under Trump for the Next 4 Years
  • Will Donald Trump's Victory Reshape the Housing Market in 2025?
  • Trump vs Harris: Housing Market Predictions Post-Election
  • 10 Housing Market Predictions Under Trump for the Next 4 Years
  • Will Donald Trump's Victory Reshape the Housing Market in 2025?

Filed Under: Housing Market, Mortgage Tagged With: Housing Market, mortgage, One Big Beautiful Bill

5 Riskiest Housing Markets to Avoid in 2025 That May Crash

July 5, 2025 by Marco Santarelli

5 Riskiest Housing Markets to Avoid in 2025 That May Crash

Let's talk about the housing market in 2025. It's a topic that gets a lot of people thinking, and maybe a little worried. While national numbers often paint a broad picture, the real story in real estate is always local. Based on recent expert analysis and market data, there are certainly areas showing significant vulnerability. If you're looking to buy or invest, or even sell, understanding where the risks might be highest is crucial. So, let's cut right to it: based on the latest insights, here are the 5 Riskiest Housing Markets to avoid in 2025 that may crash, or at least see significant price declines.

5 Riskiest Housing Markets to Avoid in 2025 That May Crash

Let's be clear from the start: when I say “crash,” I'm talking about the potential for significant price drops, not necessarily a repeat of 2008 across the board. The market dynamics are different now. However, rapid price appreciation combined with shifting economic factors and local inventory changes can create conditions ripe for a sharp correction, which for someone who bought at the peak, feels very much like a crash.

The Shifting Sands of the 2025 Housing Market

Before we dive into the specific risky markets, it's helpful to understand the bigger picture right now. According to the March 2025 data I've been looking at, the housing market's attempt at a spring revival was pretty short-lived.

According to the latest insights by Cotality (Formerly CoreLogic), March saw a bump in pending sales – about 12% higher than the year before – which you might think is a sign of strength. And yes, lower mortgage rates did help nudge some buyers off the fence. But here's the catch: year-over-year price growth actually slowed down, ticking in at 2.5% in March, down slightly from 2.9% in February.

Now, 2.5% growth isn't negative, but it's a far cry from the double-digit gains we saw during the pandemic frenzy. The forecast suggests price growth might speed up a bit by March 2026, perhaps hitting 4.9%, but that's a forecast, and a lot can change.

What I find particularly interesting is how much the market is splitting depending on where you look. You have states like Rhode Island, Connecticut, and New Jersey still seeing strong price growth, upwards of 7% year-over-year. Why? Well, as Chief Economist Selma Hepp points out, a severe lack of homes for sale in these areas, often combined with prices that are still relatively more affordable (median around $230,000 in the Midwest/Northeast mentioned), is propping things up.

On the flip side, states like Utah and Idaho, which saw explosive growth earlier, are now experiencing price drops – 2.1% and 2.2% respectively in March. This tells me that the party of non-stop appreciation is definitely over in some places, especially those that became severely unaffordable after huge run-ups.

And then there's a state like Georgia. The data shows prices hitting new records in parts of the state, maybe because folks are still moving south. But the overall state saw a negative price appreciation of -0.3% in March. This highlights a critical point: you can't just look at state-level data; you must look at specific metro areas.

Why Are Some Markets Looking Shaky?

The data points to a few key culprits making certain markets vulnerable:

  1. Affordability Has Reached a Breaking Point: Markets like Florida and Texas saw cumulative price increases of 70% to 90% since the pandemic started. Think about that – home prices nearly doubled in just a few years! Meanwhile, incomes haven't kept pace. This creates a massive affordability problem. When homes are simply too expensive for the typical local buyer, demand starts to dry up unless there's constant migration of high-income earners.
  2. Inventory is Rising, Fast: In many of these areas that boomed, builders ramped up construction, and perhaps homeowners who locked in super-low rates are now being forced to sell or deciding to cash out. The data specifically mentions “rapidly rising inventories” in weakened markets like Florida and Texas. When there are suddenly more homes for sale than buyers willing or able to purchase them, prices have to adjust downwards. It's basic supply and demand.
  3. Higher Costs Hit Harder in Stretched Markets: Mortgage rates, property taxes, insurance (especially in areas prone to climate risks like Florida) – these non-mortgage costs eat into affordability. In markets where people are already stretched thin because of high prices, these extra costs can be the straw that breaks the camel's back, pushing even more potential buyers out of the market.
  4. Consumer Jitters: The Chief Economist mentioned consumer concerns about personal finances, job prospects, and wider economic worries. This kind of uncertainty makes people hesitant to make the biggest purchase of their lives, further slowing demand, especially in markets that rely on continued strong buyer confidence.

When you combine sky-high prices built on rapid appreciation, increasing inventory, and buyers pulling back due to costs and uncertainty, you have a recipe for potential price declines. This is precisely what seems to be happening in several areas, particularly in Florida and Texas, which the data highlights as weakened states, now joining places like Hawaii and Washington D.C. in showing negative price changes in March. In fact, eight out of eleven markets measured in Florida saw negative annual changes. That's significant!

The data by Cotality also provides a list of the “Coolest Markets” based on year-over-year price change. Look at some of the places on that list: Fort Myers, FL (-5.3%), Punta Gorda, FL (-4.1%), Sarasota, FL (-3.6%), Victoria, TX (-4.6%), Coeur D'Alene, ID (-3.4%), Pocatello, ID (-3.1%). Many of these saw massive price increases during the pandemic boom and are now correcting. This reinforces the idea that areas with huge, rapid gains are often the most vulnerable when conditions shift.

The Core Concern: The 5 Riskiest Markets

Based on the specific “Markets to watch” identified in the data as having a “very high risk of price decline” among the top 100 metro areas, here are the five markets that appear to be on shaky ground heading into 2025:

  • 1. Albuquerque, New Mexico
  • 2. Atlanta, Georgia
  • 3. Winter Haven, Florida
  • 4. Tampa, Florida
  • 5. Tucson, Arizona

Let's break down my perspective on why these specific markets are flagged, based on the provided data and charts:

1. Albuquerque, New Mexico

Looking at the high-risk market price trend chart, Albuquerque's line is one of the lower ones, but critically, it shows a noticeable dip recently, especially towards the end of 2024 and into early 2025. While it had a run-up in the post-pandemic boom, it didn't reach the extreme peaks seen in some other cities on this risky list. However, any market that shows a recent downturn after a period of appreciation is concerning.

My take: Albuquerque is a smaller market than places like Atlanta or Tampa. Smaller markets can sometimes be more susceptible to volatility if major employers shrink or leave, or if inventory jumps significantly without enough incoming demand. The recent price dip in the chart suggests supply might be starting to outweigh demand, or buyers are simply saying “no” at current price levels after the earlier growth.

2. Atlanta, Georgia

This one is interesting. The data states that Georgia overall saw negative price appreciation (-0.3%) in March, even though parts of the state hit record prices. Atlanta is the major metro area driving Georgia's housing market narrative. The chart for Atlanta shows a significant peak in mid-2022, followed by a noticeable dip, then a bounce back up in late 2023/early 2024, and now seems to be showing another plateau or slight downturn heading into March 2025.

My take: Atlanta attracted massive numbers of new residents during the pandemic thanks to its relative affordability (compared to coastal cities), job market, and quality of life. However, that popularity drove prices up dramatically. The negative state-level data combined with the volatile price trend line for Atlanta in the chart suggests that affordability is now a major challenge for many potential buyers. Plus, Atlanta is a major metro, which often sees more development and potentially faster inventory increases than smaller towns. This combination of stretched affordability and potential inventory growth puts it at risk.

3. Winter Haven, Florida

Florida markets feature heavily on this risky list, and for good reason, as the data repeatedly points out Florida as a “weakened” state with negative annual changes in many markets. Winter Haven is specifically called out as “one of the top five most at-risk markets in the country.” Looking at its price trend on the chart, Winter Haven saw a huge percentage increase from early 2021 to mid-2022, perhaps one of the most dramatic run-ups on that specific chart. Since its peak, prices have been volatile, showing significant drops followed by partial recoveries, but the trend seems flatter or even slightly down heading into 2025 compared to its peak.

My take: Winter Haven is part of Central Florida, an area that became incredibly popular due to relative affordability compared to South Florida or coastal areas, plus attractions and jobs. But that rapid popularity led to massive price spikes. When prices go up 70-90% in just a few years across the state, markets like Winter Haven, which saw some of the most explosive growth, become extremely vulnerable. They likely reached or exceeded what local incomes can support, and as inventory rises (which the data confirms is happening across Florida), prices have less support.

4. Tampa, Florida

Another Florida market on the list. Like Winter Haven, Tampa saw a very strong price increase from 2021 to 2022 according to the chart, peaking around mid-2022. It then saw a significant correction, a slight rebound, and now the line appears to be trending downwards again towards March 2025. Tampa is a much larger metro area than Winter Haven but faced similar pressures: huge influx of residents, rapid price growth, and now dealing with the state-wide issues of rising inventory and affordability challenges mentioned in the data.

My take: Tampa's economy is more diverse than some smaller Florida towns, but it still experienced an unsustainable surge in home values. It's a classic example of a market where demand outpaced supply dramatically for a time, driving prices sky-high. Now, as supply catches up and affordability bites, the market is struggling to sustain those peak prices. The chart clearly shows volatility and a recent downward trend reinforcing its high-risk status.

5. Tucson, Arizona

Tucson also saw substantial price growth through 2021 and 2022, peaking in early 2023 according to the chart. Since that peak, the trend has been choppy but generally downwards or flat, with a notable dip in late 2024 and early 2025. While the data specifically calls out Utah and Idaho for Western state price drops, Arizona markets like Tucson often follow similar patterns as they attracted remote workers and migrants seeking lower costs than California during the boom.

My take: Similar to other boomtowns, Tucson's rapid appreciation likely pushed it beyond the reach of many local buyers. As the national economy cools and remote work policies potentially shift, the influx of high-earners might slow, while increased inventory (either from new builds or people needing to sell) puts downward pressure on prices. The chart's recent downward movement makes its inclusion on this high-risk list understandable.

My Perspective on These Risks

As someone who watches market trends closely, I believe the key takeaway from this data and this list of risky markets isn't panic, but awareness. These are markets that went through a period of hyper-growth that simply wasn't sustainable relative to underlying economic fundamentals like local wages.

When I look at these five cities, I see common threads: they likely experienced massive price pumps over the last few years, attracting investors and out-of-state buyers, but potentially leaving local residents behind. Now, as interest rates make borrowing more expensive and inflation eats into savings, combined with rising options for buyers (more houses on the market), the scales are tipping.

Think about it: if a home's price doubled, but local salaries didn't, who is left to buy it when investors step back and migration slows? This is where you see prices start to slide. The data confirms this dynamic, particularly highlighting the “cumulative price increases since the pandemic” as a major factor in states like Florida and Texas becoming “weakened.”

This isn't just academic for me; it influences how I'd advise friends or family looking at these specific areas. I'd tell them to do extra homework. Look specifically at inventory trends in that metro area. How long are homes sitting on the market? Are sellers having to cut prices? Are there a lot of new construction developments finishing up? These ground-level details, combined with the high-risk flags from expert analysis, give a much clearer picture than national headlines.

Recommended Read:

Housing Market Predictions 2025 by Dave Ramsey: Will it Crash? 

Housing Market Forecast 2025: J.P. Morgan’s Predictions 

Beyond the Top 5: Warning Signs in Other Areas

While these five markets are flagged as the riskiest among the top 100 metros, the data suggests the vulnerability isn't limited to just them. The list of “coolest markets” provides further clues. Seeing multiple Florida cities on that list reinforces the widespread nature of the price softness in that state. Similarly, markets in states like Texas and Idaho appearing on that list align with the general trends the report identifies in those regions.

It's a reminder that even if a city isn't on the “top 5 riskiest” list, if it experienced a massive pandemic boom and is now seeing inventory rise or sales slow, it could still be facing a significant price correction in 2025.

What Does “Crash” Really Mean Here?

Again, let's manage expectations. A “crash” in this context is likely referring to a significant correction – perhaps 10%, 15%, or even 20%+ declines from the peak values reached during the frenzy. For someone who bought near the top with a small down payment, a 15-20% drop can wipe out their equity, which feels devastating. For investors who bought speculating on continued rapid growth, it can mean losses.

It's less likely (though not impossible in specific micro-markets) to see the kind of nationwide 30-50% drops some experienced in 2008, primarily because lending standards have been much tighter. However, prolonged stagnation or gradual decline can also be painful for sellers and impact the broader economy. The risk highlighted for these five markets is that the price declines could be sharper or more sustained than elsewhere.

Who Should Be Concerned?

  • Potential Buyers in These Markets: This data is a giant yellow flag. You have more leverage than sellers might admit. Do your research, don't overpay, and be prepared for the possibility that the home's value might drop after you buy it. That's less concerning if you plan to stay long-term, but critical if you might need to sell in the next 3-5 years.
  • Potential Sellers in These Markets: You might need to adjust your expectations significantly. The days of putting a sign in the yard and getting multiple offers over asking price are likely over. You'll need to price competitively based on current conditions, not peak 2022 values.
  • Investors in These Markets: If you bought rental properties or flips expecting quick appreciation, the next few years could be challenging. Negative price movement impacts equity and makes flipping harder. Rental markets are also complex and tied to local economies.

Wrapping It Up

The housing market in 2025 is shaping up to be highly localized. While some areas in the Northeast and Midwest are holding steady or even seeing modest growth thanks to limited inventory and relative affordability, markets that saw explosive, potentially unsustainable growth during the pandemic are now facing headwinds.

The data points to Albuquerque, Atlanta, Winter Haven, Tampa, and Tucson as particularly risky, showing trends and underlying factors that increase the likelihood of price declines or significant corrections.

Understanding these risks isn't about predicting the future with 100% certainty, but about making informed decisions. If you're considering a move or investment in one of these areas, proceed with extra caution, do thorough local research, and perhaps consult with a real estate professional who truly understands the current dynamics in that specific metro, not just the national headlines. The goal is to avoid stepping into a market that could see your investment shrink in the near term.

“Turnkey Real Estate Investing With Norada”

As housing market trends evolve, smart investors are positioning themselves now. Norada offers access to prime, ready-to-rent properties that are built for long-term success.

Invest in areas poised for growth and secure your financial future with properties tailored for rental income and appreciation!

HOT NEW LISTINGS JUST ADDED!

Speak with our expert investment counselors today (No Obligation):

(800) 611-3060

Get Started Now

Recommended Read:

  • Housing Market Predictions for the Next 4 Years: 2025-2029
  • Top 22 Housing Markets Where Prices Are Predicted to Rise the Most by 2026
  • Housing Market Predictions 2026: Will it Crash or Boom?
  • 12 Housing Markets Set for Double-Digit Price Decline by Early 2026
  • 4 States Facing the Major Housing Market Crash or Correction
  • Housing Prices Are Set to Rise by 4.1% by the End of 2025
  • Housing Market Predictions for the Next 4 Years: 2025 to 2029
  • Real Estate Forecast: Will Home Prices Bottom Out in 2025?
  • Housing Markets With the Biggest Decline in Home Prices Since 2024
  • Why Real Estate Can Thrive During Tariffs Led Economic Uncertainty
  • 5 Hottest Real Estate Markets for Buyers & Investors in 2025
  • Will Real Estate Rebound in 2025: Top Predictions by Experts
  • Will the Housing Market Crash Due to Looming Recession in 2025?

Filed Under: Housing Market, Real Estate Market Tagged With: Home Price Forecast, Housing Market, housing market predictions, Housing Market Trends

5 Texas Housing Markets at High Risk of a Home Price Crash

July 1, 2025 by Marco Santarelli

5 Texas Housing Markets at High Risk of a Home Price Crash

After years of sizzling growth, things are definitely shifting in the Texas housing market. If you're wondering whether home prices might actually come down in the Lone Star State, you're not alone. And according to recent Zillow forecasts, the answer is a firm yes for some specific locations. In fact, the data points to 5 Texas Housing Markets Set For Double-Digit Price Decline by Early 2026, with Pecos, Big Spring, Alice, Raymondville, and Sweetwater expected to see drops of over 10% by March 2026. This isn't a statewide alarm bell, but it’s a significant heads-up for folks in these particular markets.

5 Texas Housing Markets at High Risk of Double-Digit Price Crash

Now, before we dive into those five areas, let's get a feel for the bigger picture in Texas. As of March 31, 2025, the average Texas home value sits around $307,629. This figure is actually down 1.4% over the past year, which tells us the market has already started to cool off from its previous fever pitch.

Homes are going to pending (meaning an offer has been accepted) in about 33 days on average. Interestingly, only 14.4% of sales are closing above the list price, while a hefty 65.1% are selling for under the asking price. This data strongly suggests that buyers are gaining a bit more leverage, and sellers are having to be more realistic. It's a market in transition, that's for sure.

So, with that statewide backdrop, let's zoom in on the projections.

5 Texas Areas Zillow Says Will See Prices Tumble in Double-Digits

Zillow, one of the big names in real estate data, regularly crunches numbers to predict where home values might be headed. Their latest forecast, using March 31, 2025, as a baseline, shines a spotlight on five specific Metropolitan Statistical Areas (MSAs) in Texas. These aren't the sprawling giants like Dallas or Houston, but smaller communities that might be more sensitive to economic ebbs and flows.

Here’s the breakdown of the projections for these areas:

RegionName RegionType StateName BaseDate Projected Change by 30-04-2025 Projected Change by 30-06-2025 Projected Change by 31-03-2026
Pecos, TX msa TX 31-03-2025 -0.4% -2.8% -12.7%
Big Spring, TX msa TX 31-03-2025 -0.5% -2.7% -11.4%
Alice, TX msa TX 31-03-2025 -1.3% -3.8% -11.3%
Raymondville, TX msa TX 31-03-2025 -1.2% -4.1% -11.2%
Sweetwater, TX msa TX 31-03-2025 -1.3% -3.5% -10.6%

As you can see, by early 2026 (specifically March 31, 2026), all five of these areas are forecast to experience price drops exceeding 10%. Pecos leads the pack with a potential 12.7% decline. This is significant, and if you live in, own property in, or are considering buying in these areas, this is information you'll want to consider carefully.

Why These Areas? A Closer Look at the Dynamics

It’s natural to ask: why these specific towns? From my experience watching housing trends, several factors often come into play, especially in smaller markets.

  • Pecos, TX (Projected Decline: -12.7%)
    • Location & Economy: Pecos is deep in West Texas, a region heavily influenced by the oil and gas industry. When oil prices are high, areas like Pecos can boom. Conversely, when the energy sector slows down or if there's a perception of future slowdowns, employment can dip, and housing demand can weaken significantly. This “boom-and-bust” cycle is something I've seen impact West Texas towns repeatedly. The significant projected decline here strongly suggests an anticipation of softening in the energy sector or a correction from a previous oil-fueled price surge.
    • My Take: A 12.7% drop is steep. It signals that the local economy, likely tied to oil and gas, might be facing headwinds. For anyone who bought at the peak of a recent boom, this could be a tough pill to swallow.
  • Big Spring, TX (Projected Decline: -11.4%)
    • Location & Economy: Like Pecos, Big Spring is in West Texas and has strong ties to the oil industry. It also serves as a regional hub for a broader agricultural area. The same vulnerabilities linked to energy price fluctuations apply here.
    • My Take: Similar to Pecos, the reliance on a dominant industry makes Big Spring susceptible. If local job growth tied to that industry falters, housing often follows. This forecast might also reflect a market that overshot during the pandemic-era buying frenzy and is now recalibrating.
  • Alice, TX (Projected Decline: -11.3%)
    • Location & Economy: Alice is located in South Texas, between Corpus Christi and Laredo. Its economy has historically been linked to the oil and gas industry, agriculture, and government jobs (including a significant border patrol presence in the wider region).
    • My Take: A double-digit decline here suggests a potential slowdown across a few of its economic drivers or perhaps an oversupply of housing relative to current demand. South Texas markets can sometimes be a bit more insulated than pure oil towns, but they aren't immune to broader economic shifts or changes in crucial local industries.
  • Raymondville, TX (Projected Decline: -11.2%)
    • Location & Economy: Raymondville is in the Rio Grande Valley in deep South Texas. Agriculture is a major economic pillar here, along with services and some light manufacturing. It's a smaller community, and its economic fortunes are often tied to the agricultural cycle and regional economic health.
    • My Take: For areas like Raymondville, which aren't major metropolitan centers, housing markets can be very sensitive to local employment. If agricultural outputs are down, or if there's less disposable income circulating, it can cool housing demand quickly. The projected decline here might also point to affordability challenges even at lower price points when coupled with higher interest rates.
  • Sweetwater, TX (Projected Decline: -10.6%)
    • Location & Economy: Sweetwater is in West Central Texas, known historically for gypsum plants and now increasingly for wind energy. It also has a history with cotton and cattle.
    • My Take: While the rise of wind energy is a positive long-term diversification, the housing market might be correcting from previous highs or feeling the pinch of broader economic slowing. Even with new industries, smaller towns can experience price volatility. It's possible that home construction or investor activity outpaced sustainable local demand in the recent past.

Understanding the “Why”: Factors Driving Potential Declines

Zillow uses complex algorithms, but from a boots-on-the-ground perspective, here are some common reasons why smaller MSAs like these might face steeper price corrections:

  • Economic Specialization: As we've seen, many of these towns have economies that lean heavily on one or two industries (especially oil and gas). This lack of diversification makes them more vulnerable. If that key industry sneezes, the local economy, and by extension the housing market, can catch a serious cold.
  • Population Fluctuations: Smaller towns can see more dramatic swings in population. If jobs related to a key industry dry up, workers may move away, reducing housing demand and putting downward pressure on prices.
  • Supply and Demand Imbalances: Sometimes, a rush of new construction (perhaps during a boom period) can lead to an oversupply of homes if demand doesn't keep pace. In smaller markets, it doesn't take a huge number of excess homes to tip the scales.
  • Interest Rate Sensitivity: While higher interest rates impact all markets, they can hit affordability harder in areas where incomes might not be rising as quickly. If borrowing costs go up too much, potential buyers simply can't qualify, leading to less demand and falling prices.
  • The “Normalization” Effect: The last few years were anything but normal for real estate. Prices shot up almost everywhere. It's possible that these smaller markets experienced an unsustainable surge, and what we're seeing now is a correction back to more historically typical price levels or growth rates. I often tell clients that markets can't go up forever; gravity eventually plays a role.

What This Forecast Means for You

Whether you're a buyer, seller, or homeowner in these areas, this forecast is worth paying attention to.

For Potential Homebuyers:

  • Opportunity Knocks? A declining market can mean lower prices and potentially more negotiating power. You might find homes that were out of reach a year ago are now more affordable.
  • Patience Could Pay Off: If Zillow's timeline is accurate, prices might continue to soften through early 2026. Waiting could mean a better deal, but…
  • Catching a Falling Knife: Timing the absolute bottom of a market is nearly impossible. Buying in a declining market also means your home's value could dip further after you purchase. It's crucial to think long-term and buy for the right reasons (you love the home, the location works for you), not just speculation.
  • Due Diligence is Key: Scrutinize the local job market, understand why prices are falling, and get a thorough home inspection.

For Home Sellers:

  • Adjust Expectations: If you're planning to sell in these areas, you may need to be realistic about your asking price. The days of multiple over-asking offers are likely gone for now.
  • Price Competitively: Work with a local real estate agent who truly understands current market conditions. Overpricing your home in a declining market can mean it sits for a long time and ultimately sells for less.
  • Presentation Matters More Than Ever: With more competition from other sellers and potentially fewer buyers, making your home shine (clean, decluttered, good curb appeal) is critical.
  • Be Prepared for Longer Listing Times: Homes may take longer to sell than they did during the boom.

For Current Homeowners (Not Selling):

  • Paper Value vs. Real Life: Remember, a decline in your home's estimated value is only a “paper loss” unless you need to sell or refinance immediately. If you love your home and your mortgage is manageable, these fluctuations are part of long-term homeownership.
  • Focus on a Stable Foundation: The key is whether your personal financial situation is secure and your housing payment is comfortable. Market zigs and zags are less stressful when your own house is in order.

For Real Estate Investors:

  • Proceed with Caution: Investing in a declining market is risky. While lower acquisition prices are tempting, you need to be confident that the market will eventually recover and that rental demand (if you're buying to rent) will remain stable or grow.
  • Deep Local Knowledge Required: Generic investment strategies rarely work in highly localized, shifting markets. You'd need an almost unfair advantage in terms of local insight to make a successful bet here, in my opinion.

A Word on Forecasts and the Bigger Texas Picture

It's super important to remember that Zillow's numbers are forecasts, not guarantees. They are based on current data and trends, but things can change. Economic conditions can shift, local developments can alter a town's trajectory, and unforeseen events can always occur.

Also, and this is critical: these five MSAs do not represent the entire Texas housing market. Texas is a massive, diverse state. The dynamics in Pecos are vastly different from those in Austin, Dallas-Fort Worth, Houston, or San Antonio. While these major metro areas are also experiencing a slowdown and price moderation compared to the frenzy of 2021-2022, they generally have more diversified economies and different demand drivers. A double-digit decline in a major metro would be a much bigger story with far wider implications.

What I see in this data is a reflection of hyper-local market corrections. These smaller areas, often more tethered to specific industries or experiencing sharper boom-bust cycles, are adjusting more dramatically than the larger, more resilient economic hubs.

Factors I'll Be Watching Moving Forward

To see if these projections hold true, or if the situation changes, I'll be keeping an eye on several key indicators for these specific areas and for Texas generally:

  • Oil and Gas Prices/Activity: For Pecos and Big Spring especially, this is paramount.
  • Local Job Reports: Are these areas gaining or losing jobs? What sectors are growing or shrinking?
  • Inventory Levels: Is the number of homes for sale rising rapidly? This usually signals downward pressure on prices.
  • Days on Market: How long are homes taking to sell? If this number creeps up, buyers have more power.
  • Mortgage Interest Rates: National rate trends will continue to influence affordability everywhere.
  • Migration Patterns: Are people moving into or out of these specific Texas towns?

Final Thoughts: Stay Informed, Stay Local

The news is a significant piece of information, especially for those directly connected to Pecos, Big Spring, Alice, Raymondville, and Sweetwater. It underscores that not all real estate markets behave the same, even within a single state.

My advice? If these areas are on your radar, treat this forecast as a valuable data point. Dig deeper, talk to local real estate professionals who have on-the-ground experience, and consider your own financial situation and goals. The Texas real estate scene is always evolving, and staying informed is your best strategy for navigating its twists and turns.

Work With Norada in Texas's Shifting Market

As Texas enters a housing correction phase, savvy investors are capitalizing on price adjustments and increased inventory across key markets.

Norada offers a curated selection of turnkey rental properties in resilient Texas cities, providing consistent income and long-term appreciation potential.

HOT NEW LISTINGS JUST ADDED!

Connect with a Norada investment counselor today (No Obligation):

(800) 611-3060

Get Started Now 

Read More:

  • Will the Texas Housing Market Crash as Prices Drop Across the State?
  • Average Down Payment on a House in Texas in 2025
  • Texas Housing Market Predictions for Next 2 Years: 2025-2026
  • 10 Texas Cities Where Home Prices Are Predicted to Drop in 2025
  • This Texas Housing Market is the Best in the U.S. [2024 Rankings]
  • Texas Housing Market: Prices, Trends, Predictions
  • Are Texas Home Sales Dropping ?
  • How Much Do Real Estate Agents Make in Texas?
  • 10 Cheapest Places to Live in Texas
  • Is Texas a Good Place to Live: Explore the Cost, Jobs and Lifestyle

Filed Under: Financing, Housing Market, Mortgage Tagged With: Housing Market, Housing Market Correction, Real Estate Market, Texas

2 Florida Housing Markets Flagged for a Major Price Decline Risk

July 1, 2025 by Marco Santarelli

2 Florida Housing Markets Flagged for a Major Price Decline Risk

Thinking of buying a slice of paradise in Florida? While the Sunshine State has been a magnet for new residents and investors, pushing home prices to dizzying heights, the music might be slowing down in some popular spots. If you've been watching the Florida property scene, you might be wondering if the party's over for some areas.

Well, May 2025 insights by Cotality suggest that at least 2 Florida Housing markets are bracing for a high risk of a price crash: Winter Haven and Tampa. These aren't just minor dips we're talking about, but significant warning signs that potential buyers and current homeowners need to understand.

Now, when I say “price crash,” I know it sounds dramatic. But the information we're looking at, including a report from Cotality with data insights looking at trends through March 2025, points to some serious vulnerabilities. So, let's dive into what's going on.

2 Florida Housing Markets Flagged for a Major Price Decline Risk

The Bigger Picture: What's Happening with US Home Prices?

Before we zoom into Florida, it's helpful to get a feel for the national housing scene. It’s been a bit of a rollercoaster, right? We saw a brief spark of hope in spring (around March of the previous year from the report's perspective, so March 2024) when lower mortgage rates led to a jump in pending sales – about 12% more than the year before. But that burst of energy didn't last long.

According to the figures (up to March 2025), year-over-year national home price growth has cooled a bit, down to 2.5%. That's a slowdown from 2.9% the month before. The national median home price is still a hefty $389,000, and you'd need an income of around $86,500 to comfortably afford it. So, affordability is still a big hurdle for many folks across the country.

Interestingly, while some areas are cooling, others are still hot. The Northeast, for example, is seeing strong price growth in places like Rhode Island, Connecticut, and New Jersey (all up 7% or more year-over-year). This, as Cotality's Chief Economist Selma Hepp points out, is partly due to a severe lack of homes for sale in those regions, which helps keep prices up, especially since homes there are often more affordable to begin with, around $230,000.

However, the national forecast does predict a 4.9% increase in home prices from March 2025 to March 2026. This tells me that while the overall market might still grow, some specific areas, particularly those that saw massive run-ups, could be in for a rude awakening. And Florida seems to be one of those places.

Why Florida? The Sunshine State's Shaky Ground

Florida has been the golden child of the housing market for a few years. People flocked there for the sun, the lifestyle, and, during the pandemic, for more space and fewer restrictions. This demand sent prices soaring. The Cotality report highlights that cumulative price increases in Florida (and Texas) since the pandemic have averaged a staggering 70% to 90%!

Think about that for a second. If a house was $300,000 before the pandemic, it could have shot up to $510,000 or even $570,000. That kind of rapid growth is often unsustainable. And now, we're seeing the consequences:

  • Affordability Crisis: With the median home price in Florida at $395,000 (making it the 12th most expensive state), many everyday Floridians and potential newcomers are simply priced out.
  • Rising Inventory: The report mentions “rapidly rising inventories” in Florida. When there are more homes for sale than buyers, prices tend to drop. This is a classic supply and demand situation.
  • Negative Price Changes: Florida as a whole actually saw a slight price decrease of -0.3% in March 2025. Even more telling, eight out of eleven major markets in Florida recorded negative annual price changes. This isn't just a blip; it's a trend.
  • Insurance Woes: While not detailed in this specific dataset, as someone who follows the Florida market closely, I can tell you that the escalating cost of homeowners insurance (and in some cases, the inability to get it at all) is a massive factor. This adds a huge, unpredictable cost to owning a home, making Florida less attractive for some.

It seems the very things that made Florida hot – its popularity and rapid growth – might be the seeds of its current correction.

Zooming In: Winter Haven, FL – A Closer Look at the Risk

The Cotality report specifically flags Winter Haven, FL as one of the top five most at-risk markets in the country for price declines. Located in Central Florida between Tampa and Orlando, Winter Haven was attractive for its relative affordability compared to the bigger cities. But it seems prices there got ahead of themselves.

Looking at the “High-risk market home price trends” graph provided in the report (which tracks prices up to March 2025), Winter Haven's price journey has been bumpy:

  • It saw a peak around $330,000 in mid-2022.
  • Then, prices fell back to around $300,000.
  • There was another, smaller peak near $320,000 in mid-2023.
  • Since then, the trend has been mostly downwards, with prices hovering around $310,000 by March 2025.

What this tells me is that after the initial boom, Winter Haven's market has struggled to maintain those peak prices and is showing signs of weakening. While a $310,000 median price might still seem reasonable to some, if it represents a significant overvaluation based on local incomes and fundamentals, further drops are likely. The risk here is that those who bought at the peak could find themselves owing more than their home is worth if prices continue to fall sharply.

Zooming In: Tampa, FL – Big City, Big Concerns?

Next up on the high-risk list is Tampa, FL. This one might surprise some folks, as Tampa has been a very popular destination, known for its job growth, vibrant culture, and beautiful Gulf Coast beaches. It's currently ranked as the #4 most at-risk market by Cotality.

Let's look at Tampa's price trend from the same graph:

  • Tampa's prices peaked higher than Winter Haven, hitting around $385,000 in mid-2022.
  • It then saw a noticeable dip to about $345,000 in early 2023.
  • Prices did recover, climbing back up to $380,000 by mid-2023.
  • After that, there was a general softening, with prices around $360,000 in early 2024.
  • The data leading up to March 2025 shows a slight uptick, with Tampa's median price around $371,000.

Now, that slight uptick at the very end of the graph for Tampa might make you wonder why it's on the “high-risk” list. This is where I believe we need to look beyond just the line on the graph. The Cotality report's risk assessment likely includes other critical factors like:

  • Pace of inventory increase: Is supply rapidly outpacing demand in Tampa?
  • Valuation metrics: How do current prices compare to historical norms or local incomes? It could be severely overvalued despite the recent small bump.
  • Affordability stress: Even at $371,000, if wages haven't kept pace, the market is on thin ice.

Tampa's story is a reminder that even a slight price increase in one month doesn't negate underlying risks, especially after such a massive run-up (remember that 70-90% statewide figure!). The concern is that the foundations supporting these prices might be weaker than they appear.

What's Driving the Risk in These Florida Markets?

So, we have Winter Haven and Tampa in the spotlight, but other Florida markets are also cooling. The “Top 10 Coolest Markets” list from the report includes:

  • Fort Myers, FL: Down -5.3%
  • Punta Gorda, FL: Down -4.1%
  • Sarasota, FL: Down -3.6%

These are not insignificant drops. It shows a broader trend of softening in parts of Florida. The key drivers, in my opinion, boil down to a few things:

  1. The Affordability Squeeze: This is the big one. When home prices rise much faster than wages, something has to give. Florida’s median home price of $395,000 is a tough pill to swallow for many.
  2. Mortgage Rates: While rates dipped briefly, they've remained relatively high. This directly impacts how much house someone can afford. The report notes that consumer concerns about finances are putting a damper on things.
  3. Skyrocketing Ownership Costs: It's not just the mortgage. As I mentioned, insurance costs in Florida have become a huge burden. Add property taxes and HOA fees, and the total cost of owning a home can be eye-watering.
  4. Inventory Rebound: For a long time, there just weren't enough homes for sale. That's changing. “Rapidly rising inventories,” as the report states, mean buyers have more choices and less pressure to bid prices up. Sellers might have to compete more on price.
  5. The “Good Times” Rolled Back: The unique conditions of the pandemic (remote work, stimulus money, a desire for more space) fueled a buying frenzy. As life returns to a new normal, that artificial boost is fading. The 70-90% price gains were an anomaly, not a new standard.

My Take: Is It a Crash or a Correction? And What Does It Mean?

As someone who's been watching housing markets for years, I tend to be cautious with the word “crash.” It implies a sudden, catastrophic drop like we saw in 2008. What I believe is more likely for markets like Winter Haven and Tampa is a significant price correction. This means prices could fall noticeably, perhaps by 10%, 15%, or even more in some localized pockets, to better align with local incomes and historical trends.

Here’s what I think this means:

  • For Buyers: If you're looking to buy in these areas, this could be good news in the medium term. Lower prices and more inventory could bring opportunities. However, don't try to catch a falling knife. Be patient, do your homework, and make sure the numbers truly work for your budget, factoring in all costs. A pre-approval for a mortgage is a must.
  • For Sellers: If you're thinking of selling in Winter Haven or Tampa, you need to be realistic. The days of naming your price and getting multiple offers in a weekend are likely over. Price your home competitively from the start, make sure it’s in top condition, and be prepared for it to sit on the market longer.
  • For Homeowners: If you bought recently at a peak price and don't plan to move, the best advice is usually to ride it out. Markets are cyclical. As long as you can afford your payments, a drop in paper value isn't ideal, but it's not a realized loss unless you sell.
  • For Investors: Speculators who bought hoping for quick appreciation might get burned. Long-term investors who focus on cash flow might still find opportunities, but due diligence is more critical than ever.

It's crucial to remember that real estate is hyper-local. Even within Tampa or Winter Haven, some neighborhoods might hold up better than others. That's why getting advice from a trusted, local real estate professional who understands the specific dynamics of your target area is invaluable.

Navigating a High-Risk Market: What Can You Do?

If you're in one of these potentially risky Florida markets, or considering entering one, here's my straightforward advice:

  • Buyers, Be Cautious:
    • Don't rush: The fear of missing out (FOMO) is a dangerous motivator. Take your time.
    • Research, research, research: Understand local price trends, inventory levels, and average days on market.
    • Get pre-approved: Know exactly what you can afford before you start looking.
    • Negotiate: With more inventory, sellers might be more willing to negotiate on price or offer concessions.
    • Think long-term: If you're not planning to stay in the home for at least 5-7 years, buying in a correcting market could be risky.
  • Sellers, Be Realistic:
    • Price it right: Overpricing your home in a cooling market is a recipe for frustration. Look at recent comparable sales (comps).
    • Presentation matters: Make your home shine. First impressions are critical when buyers have more choices.
    • Be patient and flexible: Sales might take longer, and you might not get your dream price.

The Sun May Still Shine, But with a Few More Clouds

Florida's allure isn't going away. People will still want to live and retire there. However, the housing market, particularly in places like Winter Haven and Tampa, appears to be entering a necessary correction phase after years of unsustainable growth. The risk of a significant price decline in these 2 Florida Housing markets is real, according to the latest analyses.

This isn't a reason to panic, but it is a reason to be informed, cautious, and strategic. Whether you're buying, selling, or just watching from the sidelines, understanding these dynamics is key to making smart decisions in a changing market.

Work with Norada, Your Trusted Source for

Real Estate Investment in “Top Florida Markets”

Discover high-quality, ready-to-rent properties designed to deliver consistent returns.

Contact us today to expand your real estate portfolio with confidence.

Contact our investment counselors (No Obligation):

(800) 611-3060

Get Started Now 

Read More:

  • 24 Florida Housing Markets Could See Home Prices Drop by Early 2026
  • Is the Florida Housing Market Headed for Another Crash Like 2008?
  • Key Trends Shaping the Florida Housing Market in 2025
  • This Florida Housing Market Bucks National Trend With Declining Prices
  • Florida Housing Market Crash 2.0? Analyst Warns of 2008 Echoes
  • Tax Relief Proposed as Florida Housing Market Faces Deepening Crisis
  • Is the Florida Housing Market on the Verge of Collapse or a Crash?
  • 3 Florida Cities at High Risk of a Housing Market Crash or Decline
  • Florida Housing Market: Record Supply Expected to Favor Buyers in 2025
  • Florida Housing Market Forecast for Next 2 Years: 2025-2026
  • Florida Housing Market: Predictions for Next 5 Years (2025-2030)
  • Hottest Florida Housing Markets in 2025: Miami and Orlando
  • Florida Real Estate: 9 Housing Markets Predicted to Rise in 2025
  • 3 Florida Housing Markets Are Again on the Brink of a Crash
  • Florida Housing Market Predictions 2025: Insights Across All Cities
  • When Will the Housing Market Crash in Florida?
  • South Florida Housing Market: Will it Crash?

Filed Under: Housing Market, Real Estate Market Tagged With: Florida, Housing Market, housing market crash, Housing Market Trends

  • « Previous Page
  • 1
  • …
  • 24
  • 25
  • 26
  • 27
  • 28
  • …
  • 94
  • Next Page »

Real Estate

  • Birmingham
  • Cape Coral
  • Charlotte
  • Chicago

Quick Links

  • Markets
  • Membership
  • Notes
  • Contact Us

Blog Posts

  • Should You Invest in the Indianapolis Housing Market in 2026?
    August 12, 2026Marco Santarelli
  • Best Places to Invest $100,000 in Real Estate in 2026 for Passive Income 
    August 12, 2026Marco Santarelli
  • Best Places to Invest in Real Estate With No State Income Tax (2026)
    August 12, 2026Marco Santarelli

Contact

Norada Real Estate Investments 30251 Golden Lantern, Suite E-261 Laguna Niguel, CA 92677

(949) 218-6668
(800) 611-3060
BBB
  • Terms of Use
  • |
  • Privacy Policy
  • |
  • Testimonials
  • |
  • Suggestions?
  • |
  • Home

Copyright 2018 Norada Real Estate Investments

Loading...