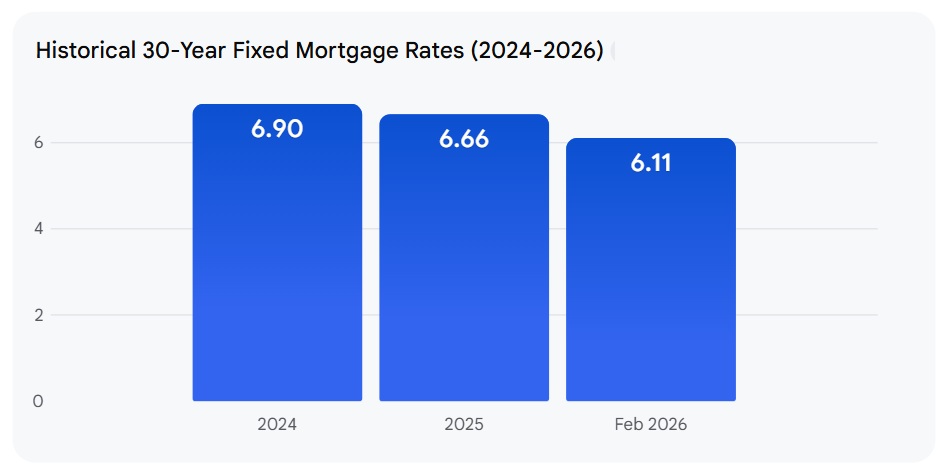
If you've been watching the housing market with a keen eye, you know how crucial mortgage rates are. Well, get ready for some good news! Today, February 15, 2026, mortgage rates are currently sitting at some of the most attractive levels we've seen in years, making it a fantastic time whether you're looking to buy your dream home or refinance your current mortgage. According to Zillow's lender marketplace, the average 30-year fixed mortgage rate is a sweet 5.85%. This is a significant dip compared to this time last year, when the same loan averaged a higher 6.87%.
Today’s Mortgage Rates, Feb 15: 30-Year Fixed At Multi-Year Lows Offers Huge Savings
This current environment is a breath of fresh air, and Zillow’s data highlights just how good things are. Here’s a breakdown based on their lender marketplace:
- 30-year fixed: A fantastic 5.85%
- 20-year fixed: Currently at 5.64%
- 15-year fixed: Just 5.36%
- 5/1 ARM (Adjustable-Rate Mortgage): Offering a competitive 5.81%
- 7/1 ARM: Slightly lower at 5.71%
- 30-year VA Loan: Extremely attractive at 5.36%
- 15-year VA Loan: Even lower at 5.15%
- 5/1 VA Loan: The absolute lowest for refinancers we're seeing, coming in at 4.99%
See? These rates are practically hovering around their three-year lows. This is the kind of environment that can make a big difference in your monthly payments and how much house you can afford. It’s not just about locking in a lower rate today; it’s about the long-term savings.
What's Driving These Favorable Rates? Unpacking the Trends
It’s always helpful to understand why things are happening, right? The steady decline in mortgage rates since around May of 2025 hasn't been random. Several factors have played a role.
One of the biggest influences is the broader economic picture. We recently saw the January jobs report, which was stronger than many expected. Unemployment dropped to 4.3%, which is great news for the economy. However, this positive economic signal has actually made experts rethink when the Federal Reserve might decide to lower interest rates further. Some analysts now believe the Fed might hold off on additional rate cuts at their upcoming March 2026 meeting. This doesn't necessarily mean rates will jump, but it suggests a period of stability.
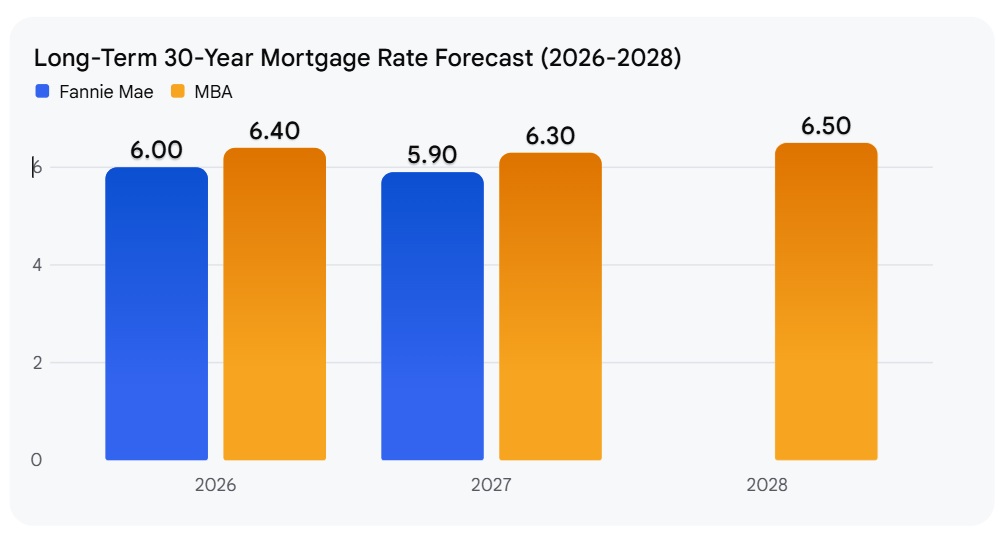
Looking ahead, major housing authorities like Fannie Mae and the Mortgage Bankers Association (MBA) are forecasting that mortgage rates will stay relatively steady throughout 2026. Their projections put the average rate somewhere between 6.0% and 6.1%. This forecast supports the idea that today’s rates are a real opportunity, not just a fleeting dip.
And let’s not forget the powerful connection between mortgage rates and the bond market, specifically the 10-year Treasury yield. When the 10-year Treasury yield falls, mortgage rates tend to follow suit. We've seen this yield recently dip to 4.065%, which is a key reason why we're seeing these borrower-friendly conditions today. It’s like a domino effect, and right now, the dominos are falling in our favor.
Your Action Plan: How to Benefit from Today's Rates
So, what does this all mean for you as a potential homeowner or someone looking to save on your current mortgage? It’s simple, really: it’s time to pay attention and act strategically.
For Homebuyers:
Lower interest rates mean your money goes further.
- Increased Affordability: With lower rates, you can either afford a bigger loan amount for the same monthly payment, or you can keep your monthly payment lower for the same loan amount. This can open up more housing options in your desired neighborhoods.
- More Buying Power: That extra breathing room in your budget can translate to affording that extra bedroom, a larger backyard, or a better school district.
For Refinancers:
If you have an existing mortgage with a rate significantly higher than today’s, refinancing could save you a substantial amount of money over the life of your loan.
- Significant Savings: Even a half-percent or one-percent difference can add up to tens of thousands of dollars over 15, 20, or 30 years.
- Reduce Your Term: You might even consider refinancing into a shorter loan term to pay off your home faster and save even more on interest.
A Special Shout-out to Our Veterans:
VA loans continue to be a standout product, especially for those who have served our country.
- Unbeatable Rates: The 5/1 VA ARM at 4.99% is incredibly low, offering exceptional value for refinancers.
- No Down Payment: Remember, VA loans often come with the advantage of no down payment, making homeownership even more accessible.
My Take: Seizing the Moment
Looking at these numbers, I’m really impressed. We’re not talking about tiny shifts; these are meaningful drops that can impact household budgets for years to come. As someone who’s seen market cycles come and go, I can say that a period like this is a clear invitation to get serious about your housing goals.
It’s easy to get caught up in the day-to-day news cycle, but the underlying data for February 15, 2026, paints a picture of opportunity. The combination of relatively stable economic indicators, forecasts for continued favorable rates, and the specific attraction of mortgage products means that if you’ve been on the fence, now is the time to explore your options.
Don’t let this moment pass you by. Whether you're a first-time buyer dreaming of that “For Sale” sign or someone looking to trim your monthly expenses by refinancing, understanding these rates and acting decisively can make a huge difference.
Final Takeaways for Today's Mortgage Rates
February 15, 2026, is shaping up to be a really important date for anyone involved in the housing market. With mortgage rates at levels not seen in years, this is a prime opportunity to lock in lower borrowing costs. Whether you’re buying a new home or refinancing your current one, taking advantage of these favorable conditions could lead to significant long-term financial benefits. While economic shifts and Federal Reserve decisions will always play a role, today's market clearly highlights the value of being prepared and acting strategically.
VS
Texas’s A‑rated rental with stability vs Ohio’s affordable property with higher cap rate. Which fits YOUR investment strategy?
We have much more inventory available than what you see on our website – Let us know about your requirement.
📈 Choose Your Winner & Contact Us Today!
Speak to Our Investment Counselor (No Obligation):
(800) 611-3060
Mortgage rates remain high in 2026, but rental properties continue to deliver strong cash flow and appreciation. Savvy investors know that turnkey real estate is the path to passive income and long‑term wealth.
Norada Real Estate helps you secure turnkey rental properties designed for immediate cash flow and appreciation—so you can invest smartly regardless of interest rate trends.
Also Read:
- Mortgage Rates Predictions Backed by 7 Leading Experts: 2025–2026
- Mortgage Rate Predictions for the Next 3 Years: 2026, 2027, 2028
- 30-Year Fixed Mortgage Rate Forecast for the Next 5 Years
- 15-Year Fixed Mortgage Rate Predictions for Next 5 Years: 2025-2029
- Will Mortgage Rates Ever Be 3% Again in the Future?
- Mortgage Rates Predictions for Next 2 Years
- Mortgage Rate Predictions for Next 5 Years
- Mortgage Rate Predictions: Why 2% and 3% Rates are Out of Reach
- How Lower Mortgage Rates Can Save You Thousands?
- How to Get a Low Mortgage Interest Rate?
- Will Mortgage Rates Ever Be 4% Again?