Rent prices have been a hot topic of discussion, especially as the cost of living continues to rise in many areas. In this post, we'll take a closer look at the current state of rent prices at a national level and examine the current trends and data to help understand whether the rental market will crash in 2024.
While there is a decline in rent prices, the market is not expected to crash. Factors such as a record year for new supply, the emergence of more multifamily buildings in 2024, and ongoing demand suggest a resilient housing market despite the current fluctuations.
Will Rent Go Down in 2024? Exploring Notable Trends
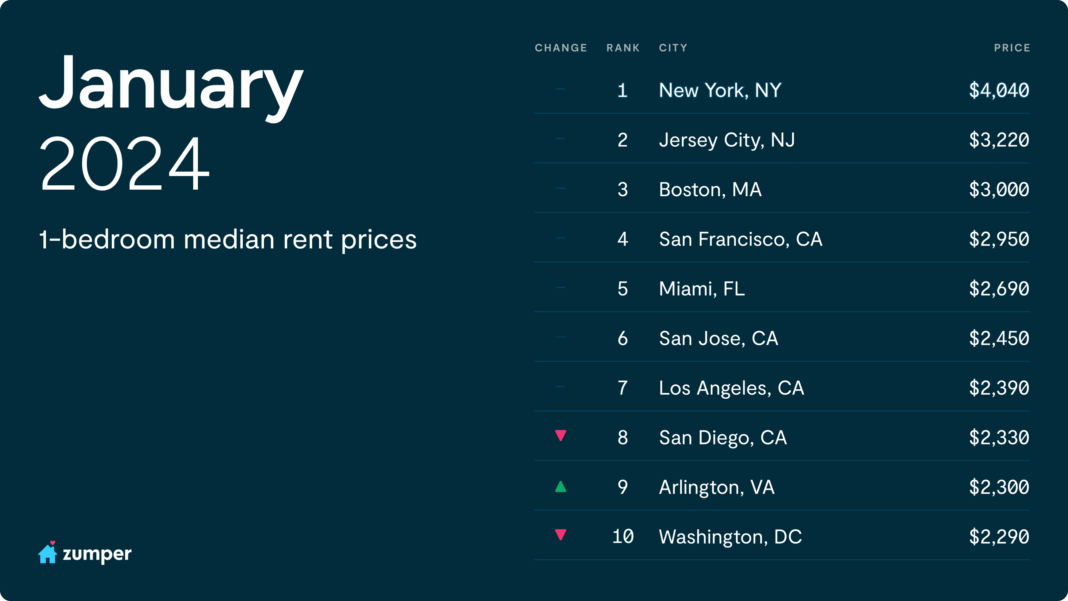
According to the Zumper National Rent Report, the median rent of $1,496 for one-bedroom homes and $1,847 for two-bedroom residences, remained unchanged from the previous month. Notably, these figures reveal a minimal increase of three-tenths of a percentage point year-over-year for one-bedroom rentals and a 1.4 percent rise for two-bedroom options.
Contrary to the trends witnessed in the past, rent prices are currently on a downward trajectory, with the national one-bedroom median standing a full percentage point lower than its peak in September 2023 at $1,511.
This shift is indicative of a dynamic change in supply and demand, as explained by Zumper CEO Anthemos Georgiades. The deceleration of pandemic-induced migrations coincides with the emergence of new multifamily buildings in various markets. Winter, being a traditionally slow season for moves, further dampens demand, providing renters with unprecedented leverage.
Georgiades suggests that now is an opportune moment for tenants to renegotiate existing leases or secure deals on new apartments. With over 10,000 properties on Zumper's platform currently offering concessions, such as a month of free rent or waived security deposits, this trend is expected to persist with the opening of more buildings in numerous markets.
As interest rates show signs of easing, the rental industry might experience softened demand due to a slight uptick in first-time homebuyers. However, it's essential to note that consumer sentiment towards home buying remains at an all-time low, as highlighted in the end-of-year report.

Rental Trends Across the Sun Belt and Midwest
While national trends depict a decline, regional variations are notable. The Sun Belt experiences a more rapid decrease in prices, whereas the Midwest witnesses slow-but-steady increases. The Midwest's resilience is attributed to modest changes in supply and demand, contrasting with the volatility seen in other markets.
Midwest's Slow-but-Steady Rally
Unlike the national scenario, many Midwestern cities, such as Cleveland, Milwaukee, Columbus, and Chicago, have witnessed consistent increases in rent prices. This resilience can be credited to stable changes in supply and demand, avoiding the erratic fluctuations observed in other regions.
Take Chicago, for instance, where a housing shortage and strict regulations have prevented an all-out construction boom. With only 15,298 units under construction, Chicago lags behind smaller cities like Denver, which boasts nearly 40,000 units under construction. The Windy City's one-bedroom rent has surged by an impressive 16.7 percent year-over-year and 3.4 percent month-over-month, reflecting the impact of limited construction and high demand.
Further analysis of Chicago's neighborhoods reveals significant differences in rent prices. In affluent areas like River North, the one-bedroom median is a staggering $2,840, while in more affordable neighborhoods like Avalon Park, it stands at $770. Proximity to the Loop influences pricing, with Near West Side and Near North Side commanding higher rents, while neighborhoods like South Lawndale and Humboldt Park offer more budget-friendly options.
Rent Price Trends Across the United States
In this section, we will analyze the latest trends from Rent.com's data, to gain insights into whether rent will go down in 2024. The recent data indicates a significant decline in rent prices, with November experiencing a notable drop of more than two percent compared to the same period last year. This marks the second consecutive month and the third time in the last four months that prices have decreased on a yearly basis.
While there is no indication of an imminent market crash, the rental housing market is undergoing a shift with declining prices on a yearly basis. Factors such as below-normal demand, increased inventory, and a return to seasonal price trends contribute to the current market dynamics. However, the overall market stability will depend on various economic and societal factors in the coming months.
Yearly Declines and Cyclical Patterns
In November, asking rents in the United States witnessed a noteworthy decline, dropping by more than two percent compared to the same period last year. This marked the second consecutive month and the third time in the last four months that prices experienced a yearly decrease. The November decline of -2.09 percent was considerably larger than the previous drops, with October showing declines just below one-third of one percent and August experiencing minimal drops at -0.06 percent.
Notably, November 2023 was the first time in over three and a half years that year-over-year prices dipped by more than a single percent. The last significant drop occurred in February 2020 when prices decreased by more than two percent. Following the onset of the pandemic in March 2020, prices again declined, this time by -1.09 percent. However, this cooling trend was short-lived as national prices rose on a yearly basis for 37 consecutive months, experiencing significant growth from $1,614 in March 2020 to $1,967 in May 2023, representing a more than 20 percent increase.
The current national median price stands at $1,967, with prices peaking in August 2022 at $2,054. On a monthly basis, prices have declined for the third consecutive month, but the pace of decline from October to November slowed to -0.57 percent compared to the -1.64 percent decline from September to October. Despite the slowdown, this ongoing monthly drop suggests that rent prices are reverting to cyclical patterns that were disrupted during the pandemic.
Recent Trends and Historical Perspective
September 2022 marked a significant shift in rent prices, ending a period of double-digit yearly gains that began in October 2021. Over this time, rents rose by over 11.5 percent, reaching $2,054 in August 2022. Although prices in September were still up by 8.83 percent, a decline commenced, led by decreased demand, and continued until reaching a low of $1,937 in February 2023.
After hitting a trough in February, prices steadily rose and peaked in August, experiencing a nearly 6 percent gain. However, declines since August have reduced this growth to just over 1.50 percent, decreasing prices from the peak by $85. Despite recent declines, rents remain elevated on a longer-term basis, having risen by more than 22 percent since November 2019, just before the pandemic, adding $355 to monthly rent bills.
National Rent Price Trends
The growth in national rent prices continues to be restrained by below-normal demand, increased inventory, and a return to seasonal price trends, which typically exert downward pressure on rents during the fall and winter. November's greater than two percent annual decline is the second consecutive month of yearly drops after the peak in August. Asking rents have now declined year-over-year in three of the last four months, totaling four times in 2023. Price growth over the year stands at 1.29 percent, rising from $1,942 in January to the current price of $1,967.
Monthly price changes registered negative for the third consecutive month. The -0.57 percent decline from October to November was smaller than both the two percent decline from August to September and the -1.64 percent decline from September to October. This adds to the evidence that the national market has returned to seasonal trends. Prior to recent declines, prices had been generally rising since February, gaining nearly six percent until prices peaked in August.
Regional Disparities
Regionally, prices continued to climb in the Midwest, with yearly growth increasing from 4.08 percent in October to 4.57 percent in November. However, asking rents in the Midwest remain significantly below other regions, standing at $1,434, nearly $1,000 cheaper than median rents in the Northeast and West, and almost $200 less than rents in the South.
All other regions saw year-over-year declines in November. This was a reversal for the Northeast, which grew by more than three percent on a yearly basis in October but is now down -0.02 percent year over year. Declines in the South were relatively minimal at -0.37 percent, almost doubling from a month ago when yearly declines were just under -0.20 percent. Asking rents in the West continue to decline, with the region experiencing another -1.76 percent drop in November after October's -1.52 percent decline.
State Rent Price Trends
At the state level, the rental housing market maintains a nearly 60/40 split between yearly price gains and declines. In November, 57.14 percent of state markets recorded year-over-year increases, while 40.48 percent showed yearly losses. On a monthly basis, the split was more even, with 52.38 percent of markets declining compared to 47.62 percent gaining over asking rents from the previous year.
Mississippi continued to lead in yearly increases, although growth fell just short of 14 percent in November after an 18.3 percent increase in October. Despite a -1.73 percent decline month over month, Mississippi remains relatively affordable with asking rents at $1,187. North Dakota, South Carolina, and several Midwest states dominated the list of largest gainers. The Midwest saw seven of the top 10 largest gainers, with states like Michigan, Kansas, and Wisconsin showing significant yearly increases.
On the other hand, the West, particularly the Mountain West, experienced yearly declines in November. Idaho saw the largest year-over-year decrease at -7.49 percent, reflecting the cooling of hot metros like Boise. Other Mountain West states, including Utah, Colorado, New Mexico, and Nevada, also recorded relatively large yearly losses. In the Pacific Northwest, Washington and Oregon saw declines at -7.28 percent and -6.54 percent, respectively. Florida, Oklahoma, and Texas were among the largest losers, with declines between three and five percent year over year.
Metro Rent Price Trends
At the metro level, positive changes were led by the Providence, RI metro, where asking rents increased by 22.32 percent on a yearly basis. The New York City metro, perennially the most expensive in the nation, also showed gains with a 5.19 percent yearly increase. In the Midwest, the Columbus, OH metro saw an 11.24 percent yearly increase, contributing to regional gains along with Kansas City, Indianapolis, and Cincinnati metros.
In the West, Phoenix, San Jose, and Los Angeles metros showed large gains, with San Jose now ranking as the third most expensive metro. On the flip side, the Portland, OR metro led declines with a more than 10 percent drop. Sacramento, CA, Salt Lake City, UT, and Las Vegas metros also recorded significant yearly declines.
The Miami, FL metro experienced the second-largest yearly decline at -9.72 percent, despite still being the seventh highest priced among metros. Across the South, Raleigh, NC, Austin, TX, Memphis, TN, Nashville, TN, and Houston, TX all saw declines ranging between four and nine percent on a yearly basis.
In summary, as rent price trends continue to evolve, the landscape at both state and metro levels presents a diverse picture. While some states and metros experience significant yearly increases, others face declines. Factors such as regional demand, migration patterns, and economic conditions contribute to this varied scenario. As we navigate these trends, it becomes crucial for renters, landlords, and policymakers to stay informed and adapt to the dynamic nature of the rental housing market.
Will Rent Go Down in 2024?
Amidst the fluctuating rent price trends observed in recent months, many renters and industry experts are wondering whether the rental market is headed for a crash in 2024. It is too early to say for sure whether rent prices will go down in 2024. However, there are some signs that suggest they may start to cool down.
One factor that could contribute to a decline in rent prices is rising interest rates. The Federal Reserve is raising interest rates in an effort to combat inflation. This is making it more expensive to borrow money, which could lead to a decline in demand for rental properties.
Another factor that could lead to lower rent prices is the increasing supply of rental units in the US. More and more people are choosing to rent instead of buy, which is increasing the supply of rental units on the market. This increased supply could help to put downward pressure on rent prices.
Finally, a weakening economy could also lead to a decline in rent prices. If the US economy weakens in 2024, it could lead to a decline in demand for rental housing. People who are losing their jobs or who are seeing their incomes decline may be more likely to move in with family or friends or to downsize to a smaller rental unit.
Of course, there are also some factors that could keep rent prices high in 2024. For example, if inflation continues to rise, it could lead to higher costs for landlords, which they may pass on to renters. Additionally, if the US economy remains strong, it could lead to continued demand for rental housing.
Overall, it is too early to say for sure whether rent prices will go down in 2024 in the US. However, there are some signs that suggest they may start to cool down. Renters should keep an eye on the housing market in the coming months to see how trends develop.
While it's challenging to predict the future of the rental market with absolute certainty, we can analyze the current trends and potential factors influencing its trajectory.
Several key factors contribute to the uncertainty surrounding the rental market:
1. Economic Conditions
The health of the overall economy plays a significant role in the stability of the rental market. Economic factors, such as employment rates, inflation, and wage growth, can impact renters' ability to afford housing. Economic downturns can lead to higher unemployment rates and financial stress among renters, potentially causing rent prices to decline or stagnate.
2. Housing Supply and Demand
The balance between housing supply and demand is a crucial determinant of rent prices. A shortage of rental properties relative to the number of renters can drive up prices, while an oversupply can lead to rent decreases. Regional variations in supply and demand can also affect localized rental markets differently.
3. Policy Changes
Government policies and regulations, such as rent control measures and eviction moratoriums, can have a significant impact on the rental market. Policy changes aimed at addressing housing affordability may influence rent price trends. It's essential to monitor legislative developments that could impact the market's stability.
4. Pandemic Effects
The COVID-19 pandemic introduced unique challenges to the rental market. While it initially led to rent decreases in some areas, the longer-term effects remain uncertain. Factors like remote work trends, housing preferences, and pandemic-related policies continue to shape the rental landscape.
Therefore, whether rent will go down in 2024 or not will depend on the rising interest rates, an increasing supply of rental units, and a potentially weakening economy. However, inflation and a strong economy could keep rent prices high.
How Do These Rent Price Trends Impact Renters?
The rent price trends outlined in the August 2023 Rent Report have several implications for renters:
1. Affordability Challenges
Rising rent prices can pose affordability challenges for many renters. As rents increase, a higher percentage of renters may find themselves spending a significant portion of their income on housing costs, potentially impacting their financial well-being.
2. Regional Variations
Rent price trends can vary significantly by region and metro area. Renters should be aware of the local market conditions in their desired location, as affordability and availability can differ widely from one place to another.
3. Policy Awareness
Renters should stay informed about any policy changes that could impact their rights and rental costs. Understanding local rent control laws, tenant protections, and eviction policies is crucial for renters to advocate for their interests.
4. Long-Term Planning
For renters considering long-term housing decisions, such as purchasing a home, it's important to factor in rent price trends and potential future changes. Assessing housing market conditions and making informed decisions can help renters navigate changing landscapes.
Hence, for renters in the United States, navigating the rental market in 2023 requires careful attention to the trends and dynamics at play. While some areas may offer cost-saving opportunities due to rent declines, others may present challenges in terms of affordability. Staying informed about regional rent trends, monitoring supply and demand dynamics, and planning accordingly can help renters make the best decisions for their housing needs.
Overall, renters should be prepared for a dynamic and evolving rental landscape and be ready to adapt to changing conditions as they explore their housing options in 2023.
Sources:
- https://www.zumper.com/blog/rental-price-data/
- https://www.rent.com/research/average-rent-price-report/


