Have you ever dreamt of escaping the rat race, building wealth, and becoming your own boss? Real estate investing can be your ticket to freedom, but it's not a walk in the park. This isn't just about random property purchases. It's a strategic game with its own set of rules. Mastering these rules can turn you into a real estate mogul, and this article will be your golden key.
We'll crack open the secrets to smart investing, show you how to find winning properties, and help you dodge the most common mistakes that trip up beginners. Let's unlock your real estate potential!
Understanding Real Estate Investment
Real estate investing encompasses purchasing physical property like residential homes, commercial buildings, or land, with the goal of generating income or appreciation over time. Unlike stocks or bonds, real estate investments come with unique challenges and rewards, requiring a thoughtful approach to strategy, financing, and property management. By harnessing essential knowledge and skills, investors can create a robust portfolio that withstands market fluctuations and yields positive returns.
Why Invest in Real Estate?
Investing in real estate yields several advantages, including:
- Income Generation: Rental properties can provide a consistent cash flow, especially if you invest in high-demand areas.
- Appreciation: Properties often appreciate over time, leading to substantial profits upon selling.
- Tax Benefits: Real estate investments offer various tax deductions, such as depreciation and mortgage interest.
- Portfolio Diversification: Including real estate in your investment portfolio can reduce overall risk and increase stability.
The Golden Rules of Real Estate Investing
Prioritize Location Above All Else
It’s universally acknowledged that location is paramount when it comes to real estate investments. A property’s location influences every aspect of its value and desirability. Consider these factors:
- Proximity to Amenities: Access to essential services such as schools, hospitals, parks, and shopping centers directly affects property attractiveness.
- Neighborhood Trends: Observing the trajectory of neighborhood development—emerging hotspots can indicate future price appreciation.
- Crime Rates: Lower crime rates typically correlate with higher property values and tenant demand.
Tip: Use online tools like neighborhood analytics and crime maps to assess and compare areas before investing.
Conduct Thorough Market Research
Investing without proper research can be likened to jumping into the deep end without checking if there’s water. To safeguard your investment:
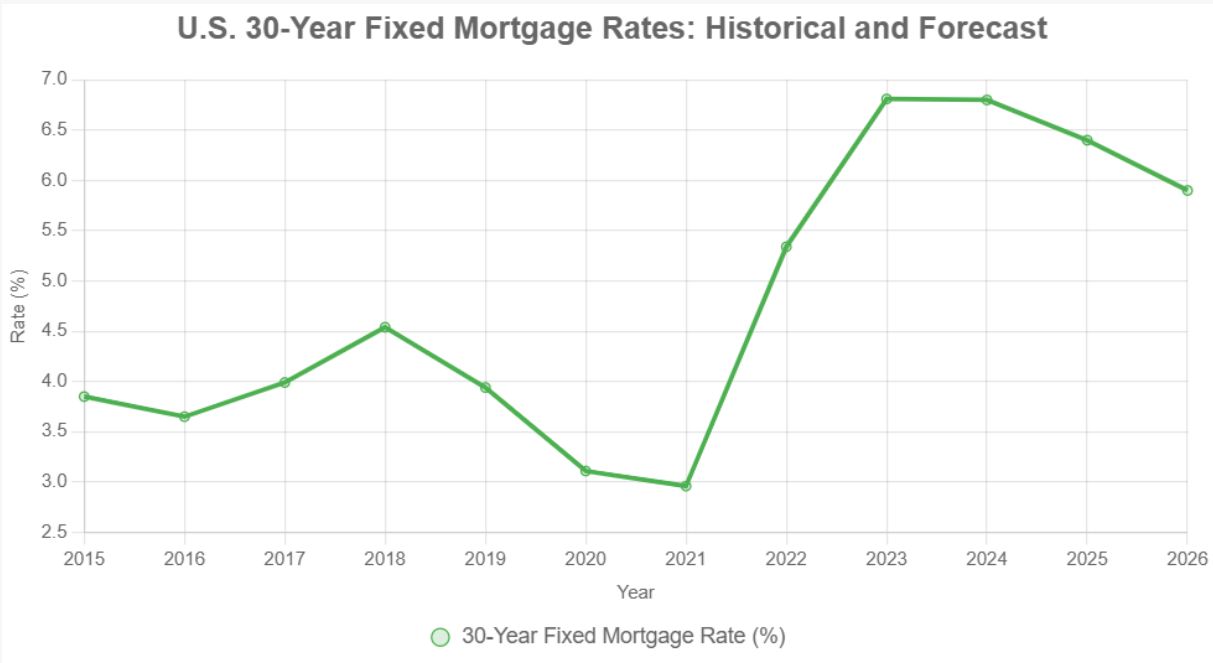
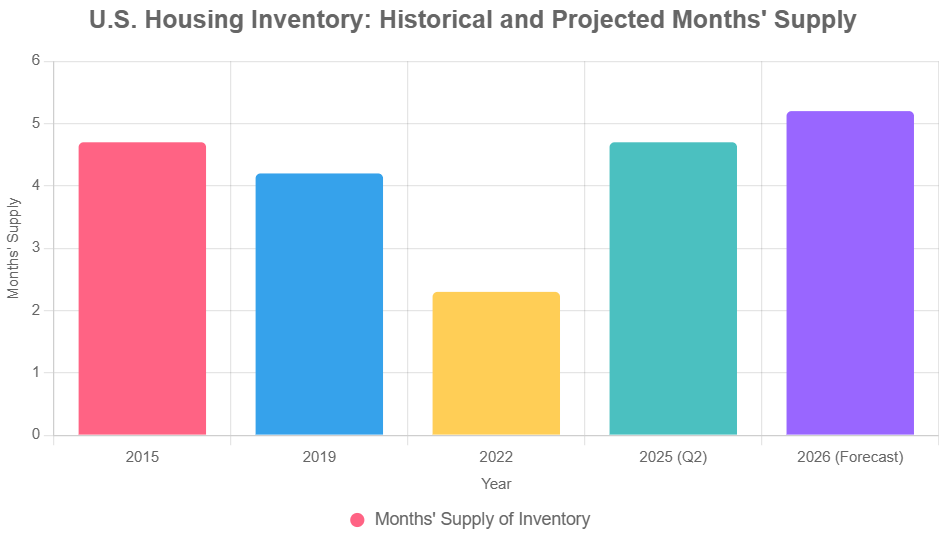
- Analyze Market Trends: Keep an eye on home prices, days on market, and inventory levels. Rising prices coupled with decreasing inventory often indicate a seller's market.
- Economic Indicators: Understand the local economy by evaluating the unemployment rate, median income, and population growth—all critical indicators of demand.
- Comparable Sales (Comps): Investigate recent sales in the area to determine a property’s fair market value and devise a competitive offer.
Understand Your Financing Options
Financing can be a major determinant in your investment success. Getting the right financing strategy in place is essential. Consider:
- Fixed vs. Variable Rate Mortgages: Choose the mortgage type that aligns with your financial strategy. Fixed rates provide stability, while variable rates may offer lower initial costs but come with the risk of fluctuating payments.
- Down Payment Strategy: Aim for a substantial down payment (ideally, at least 20%) to secure better mortgage terms and avoid PMI (Private Mortgage Insurance).
- Alternative Financing: Explore creative options, such as partnering with another investor to pool resources or using seller financing arrangements.
Pro Tip: Consult with a mortgage advisor to pinpoint the best financing solution for your investment strategy.
Build a Comprehensive Business Plan
A well-crafted business plan acts as your investment roadmap. This plan should outline your objectives, financial forecasts, and operational strategies. Important sections of your plan may encompass:
- Investment Goals: Are you looking to flip properties for quick gains or invest in rentals for long-term stability? Be clear about your direction.
- Budget Management: Include not only the property purchase price but also renovation, maintenance, and property management costs.
- Exit Strategy: Having a predefined exit strategy gives you a clear course of action should market conditions shift.
Embrace Property Management Practices
Managing your investment is crucial, whether you do it yourself or hire a property manager. Effective property management encompasses:
- Tenant Screening: Creating stringent tenant criteria minimizes the risk of defaults. Background checks, credit scores, and references are critical checks to conduct.
- Property Maintenance: Develop a system for regular inspections and repairs to maintain the property’s value. Promptly addressing issues can prevent more significant problems down the line.
- Legal Knowledge: Familiarize yourself with local landlord-tenant laws. Understanding your rights and responsibilities will safeguard your investment and minimize disputes.
Think Long-Term; Don’t Rush Into Decisions
Real estate is best approached with a long-term perspective. The temptation to seize immediate opportunities may lead to hasty investments and regrets. Consider:
- Market Cycles: Understanding market cycles can guide you in making better purchasing decisions. Investing during downturns often results in higher yields in the long run.
- Evaluate All Factors: Take time to weigh all factors—including property potential, renovation needs, financing options, and market conditions—before committing.
Network Extensively
Real estate is a relationship-driven business. Building your network can open doors to opportunities and insights. Here’s how to do it:
- Join Local Real Estate Groups: Participate in meetups or forums where investors and professionals share experiences and strategies.
- Seek Mentorship: Learning from seasoned investors can provide invaluable guidance and insider knowledge.
- Collaborate: Look for joint ventures to leverage resources and expertise, enhancing your investment capabilities.
Common Investment Pitfalls to Avoid
Even seasoned investors can stumble if they are unaware of common missteps. Here are some pitfalls to avoid:
| Pitfall | Description |
|---|---|
| Investing Without Research | Jumping into properties without understanding the market can lead to losses. |
| Overleveraging | Taking on too much debt can result in financial strain, especially during downturns. |
| Emotional Decision-Making | Letting emotions drive your decisions can cloud judgment and lead to errors. |
| Neglecting Cash Flow Analysis | Ignoring potential cash flows and expenses can jeopardize your budget expectations. |
| Failing to Plan for Challenges | Not preparing for maintenance, vacancies, and other unexpected issues can impact profitability. |
Conclusion
Now that you hold the golden keys to real estate success, it's time to unlock your full potential! Remember, this is a marathon, not a sprint. Stay committed, leverage your knowledge, and build a network of trusted advisors. With these golden rules as your compass, you're well on your way to navigating the exciting – and lucrative – world of real estate investing. Equip yourself with knowledge and network with others to unlock the full potential of your real estate investment journey. The market awaits, so why wait any longer? Dive in and start building your path to financial freedom!
In 2026, select U.S. cities are projected to see surging demand, rising rents, and appreciation—creating prime opportunities for investors seeking passive income and long‑term wealth.
Work with Norada Real Estate to find stable, cash-flowing markets beyond the bubble zones—so you can build wealth without the risks of ultra-competitive areas.
Read More:
- Housing Market Predictions for Next 5 Years (2025-2029)
- Real Estate Forecast Next 5 Years: Top 5 Future Predictions
- Real Estate Investing: Why Smart Investors Are Buying Now
- Can Robert Kiyosaki's Real Estate Investing Make You Rich
- 18 Best Real Estate Investing Books For Beginners (2025)
- 10 Tips to Be Successful in Real Estate Investing (2025)