Norada Real Estate Investments

  • Home
  • Markets
  • Properties
  • Membership
  • Podcast
  • Learn
  • About
  • Contact

San Diego Housing Market Graph 50 Years: Analysis and Trends

June 3, 2025 by Marco Santarelli

San Diego Housing Market Graph 50 Years

The San Diego housing market graph over the past 50 years tells a captivating tale of booms, busts, and everything in between. As someone who has closely watched this market, I've seen firsthand how it can leave you amazed and bewildered at the same time. Today, we'll break down this rollercoaster ride and try to understand the forces that have shaped San Diego real estate.

San Diego Housing Market Graph: A 50-Year Journey

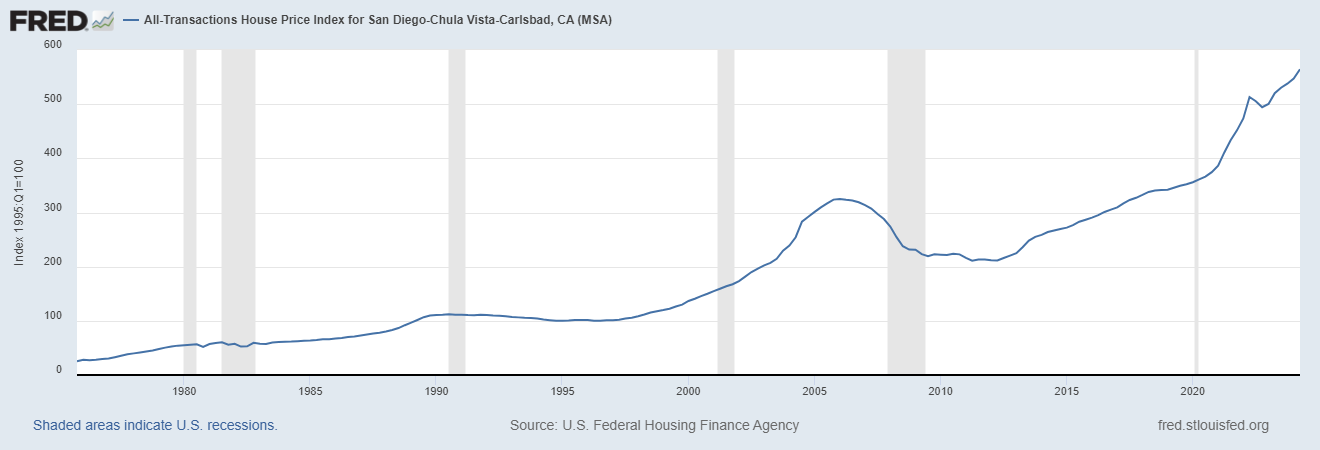
Here's the graph showing the All-Transactions House Price Index for San Diego MSA.
San Diego Housing Market Graph 50 Years: Analysis and Trends
Source: FRED

The Early Decades: Steady Growth and Shifting Sands (1970s-1980s)

Peeking back at the San Diego housing market graph from 1975, we see the House Price Index hovering around 25.29. This period was marked by relatively steady growth, fueled by a developing economy and a growing population.

Key takeaways from this era:

  • Interest rates played a major role. The 1970s saw high inflation, leading to fluctuating interest rates that sometimes made it tough for buyers to jump into the market.
  • The '80s brought about change. Interest rates started to cool down, making homes more affordable and leading to increased demand. This period saw a significant upward swing in the San Diego housing market graph.

The Boom Years: Riding the Wave (1990s-2000s)

Fast forward to the 1990s, and the San Diego housing market graph takes a dramatic turn upwards. The dot-com boom brought an influx of wealth and jobs to the area, making San Diego a hotbed for real estate investment.

Here's what shaped this period:

  • The rise of the tech industry. San Diego, with its pleasant weather and attractive lifestyle, became a magnet for tech professionals, further driving up demand for housing.
  • Low interest rates made borrowing cheaper. This fueled the fire, making it easier for people to qualify for larger mortgages, further escalating home prices.

By the early 2000s, the San Diego housing market graph was on an unprecedented upward trajectory, with the House Price Index soaring above 300. The market was hot, with properties often receiving multiple offers and selling for well above asking price.

The Correction and Recovery: Weathering the Storm (2007-2012)

The San Diego housing market graph took a sharp downturn in the late 2000s with the onset of the global financial crisis.

Here's what happened:

  • The subprime mortgage crisis. This crisis, triggered by risky lending practices, led to a wave of foreclosures nationwide, including in San Diego.
  • The housing bubble burst. Prices that had risen at an unsustainable pace finally corrected, leading to a steep decline in the San Diego housing market graph.

The recovery in San Diego was relatively swift compared to other parts of the country. By the early 2010s, the San Diego housing market graph began to show signs of life.

The Current Chapter: A New Era of Growth? (2013-Present)

The San Diego housing market graph from 2013 onwards has been characterized by consistent, albeit more measured, growth. The House Price Index, while not reaching the dizzying heights of the early 2000s, has been steadily climbing.

Here's what's shaping the market today:

  • Limited housing supply. San Diego faces a chronic shortage of housing inventory, with demand consistently outstripping supply. This is a key driver of the upward pressure on prices.
  • Strong economic fundamentals. San Diego boasts a diverse and robust economy, with strong job growth in sectors like technology, healthcare, and tourism.

Looking at the Data: A Closer Examination

The data from the U.S. Federal Housing Finance Agency paints a clear picture of the San Diego housing market's journey over the past 50 years.

Let's take a look at some key data points from the All-Transactions House Price Index for San Diego-Chula Vista-Carlsbad, CA (MSA):

Year House Price Index Key Trend
1975 25.29 Steady growth
1985 66.11 Significant upward swing
2000 150.05 Unprecedented upward trajectory
2005 323.78 Peak before the correction
2010 222.72 Beginning of recovery
2020 374.44 Consistent, measured growth
2023 537.85 Continued growth despite rising interest rates

Looking Ahead: What's Next for the San Diego Housing Market?

Predicting the future of any real estate market is like trying to predict the weather – there are a lot of factors at play! However, by studying historical trends, analyzing current market indicators, and considering broader economic factors, we can make some educated guesses.

Here are some key things to watch out for:

  • Interest rates: Rising interest rates can impact affordability and potentially slow down price growth.
  • Inventory levels: A significant increase in housing supply could help moderate price increases.
  • Economic conditions: A strong local economy will likely continue to support demand in the housing market.

Final Thoughts: Navigating Your Path in the San Diego Market

The San Diego housing market has certainly had its share of ups and downs over the past 50 years. But one thing remains constant: San Diego's desirable location, strong economy, and high quality of life continue to make it an attractive place to live. Whether you're a seasoned investor or a first-time homebuyer, understanding the cyclical nature of the market and doing your due diligence is key. Remember, every market cycle presents opportunities, and with careful planning and a long-term perspective, you can navigate the San Diego housing market with confidence.

Related Articles:

  • San Diego Housing Market Forecast 2025: What to Expect
  • San Diego Housing Market: Prices, Trends, Forecast
  • Is San Diego’s Housing Getting Very Expensive: Experts Predict
  • San Diego Housing Market Booms With 9.4% Growth: Expert Predictions
  • San Diego Housing Market Predictions: Soaring and Expensive!
  • San Diego Housing Market Predictions: Prices Skyrocket 11.4%; What's Next?
  • Is San Diego Real Estate a Good Investment?
Filed Under: Growth Markets, Housing Market Tagged With: Housing Market, Housing Market Forecast, san diego

Recession in Real Estate: Smart Ways to Profit in a Down Market

June 3, 2025 by Marco Santarelli

Recession in Real Estate: Smart Ways to Profit in a Down Market

Is the word “recession” making you sweat? Especially when you hear it attached to “real estate”? I get it. The news can sound scary, painting pictures of crashing markets and lost dreams. But here’s the thing: fear sells headlines, and fortunes are often made when others are fearful. So, how do you make the real estate recession work for you?

By understanding that a recession isn't the end of the world, but rather a shift in the market that actually creates incredible opportunities for those who are prepared and willing to act smartly. It’s a chance to play the long game, to position yourself for future growth, and potentially snag deals you wouldn’t even dream of in a booming market.

How to Make the Real Estate Recession Work for You?

Understanding the Real Estate Recession: It's Not Always Doom and Gloom

Before we jump into how to make this recession work for you, let's take a deep breath and understand what a real estate recession actually is. It’s not some sudden apocalypse. It’s a phase in the real estate cycle, just like seasons changing. Think of it as a cooldown period after a hot streak.

What exactly does a real estate recession look like? You'll typically see a few key signs:

  • Falling Home Prices: This is probably the most noticeable sign. After years of prices going up and up, they start to come down or at least level off. Sellers might have to lower their asking prices to attract buyers.
  • Slowing Sales: Homes take longer to sell. There are fewer bidding wars, and open houses might feel a bit empty. The frantic pace of the market slows down considerably.
  • Increased Inventory: More homes are listed for sale, but fewer are being bought. This means buyers have more choices, and sellers have more competition.
  • Rising Interest Rates: Often, recessions are linked to or triggered by rising interest rates. Higher mortgage rates make it more expensive to borrow money, cooling down buyer demand.

Why are we talking about a real estate recession now? Well, if you've been following the news, you know that inflation has been stubbornly high, and to combat that, central banks have been raising interest rates. This impacts everything, including the cost of mortgages. Combine this with other global economic uncertainties, and you have the perfect recipe for a real estate market slowdown.

Now, is this really a recession or just a market correction? Honestly, the line can be blurry. Sometimes it's a bit of both. A “correction” implies a temporary dip, while a “recession” suggests a more prolonged period of economic downturn. Regardless of the label, the effects on the real estate market are similar: a shift from a seller's market to a buyer's market, and that, my friend, is where opportunity lies.

I've seen markets go up and down throughout my years watching real estate. What’s crucial to remember is that real estate is cyclical. Just like seasons change, so do markets. The boom times don't last forever, and neither do the downturns. And savvy folks understand this cycle and position themselves to benefit from it.

Opportunities Blooming in a Real Estate Recession: Where the Smart Money Moves

Okay, so prices might be softening, and things are slowing down. Instead of panicking, let's flip the script. A real estate recession isn't a curse; it's a reset button for the market. It’s a time when the balance of power shifts, and if you're smart, you can use this to your advantage.

Let’s break down the opportunities for different folks:

For First-Time Home Buyers: This might be your moment. For years, many first-time buyers have been priced out of the market, constantly outbid, and facing insane competition. A recession can be a game-changer.

  • Lower Prices, Less Competition: Finally, you might find homes within your budget. You won't have to compete with ten other offers, and you might even get the seller to come down on the price. Imagine – actually having time to think and make a reasoned decision, instead of rushing into an offer just to keep up!
  • More Inventory, More Choices: Remember those days of slim pickings? Now, you'll have more homes to choose from. You can be picky, take your time, and find a place that truly fits your needs and wants, not just grab whatever is available.
  • Negotiating Power is Back: Sellers are now more motivated. They might be willing to negotiate on price, repairs, or closing costs. This is your chance to get a better deal and potentially build in some equity from day one.
  • Long-Term Investment Potential: Real estate is still a solid long-term investment. Buying during a recession means you're likely buying at a lower point in the cycle. As the market recovers (and it always does, eventually), your property value should increase. Think of it as buying low and preparing to sell higher down the road (or simply enjoy the appreciation in your own home!).

For Real Estate Investors: For experienced investors, a recession can be like Christmas morning. It's a time of discounts and distressed deals.

  • Distressed Properties Galore: Recessions often lead to an increase in foreclosures and short sales. These are properties where homeowners are struggling financially and might need to sell quickly, often at below market value. This is where seasoned investors find opportunities to buy low, renovate, and either rent out or flip for a profit when the market recovers. This is not about preying on misfortune, but providing solutions for those who need to sell and creating value in the process.
  • Rental Demand Increases: As homeownership becomes less affordable or people become hesitant to buy, the demand for rentals often goes up. This can mean higher rental income and lower vacancy rates for rental property owners. Investing in rentals during a recession can provide a stable income stream and position you for long-term appreciation.
  • Creative Financing Opportunities: In a tighter credit market, sellers and investors might get more creative with financing options. Think seller financing, where the seller acts as the bank, or private lending. These alternative financing methods can open doors for investors who might not qualify for traditional bank loans in a recession.
  • Wholesaling and Flipping Comeback: While flipping got a bad name after the last big recession, the strategy itself is still valid. Buy low, fix it up, and sell when the market turns. A recession can be the perfect time to build a pipeline of deals, get properties under contract at discounted prices, and be ready to capitalize on the eventual market rebound. Wholesaling, which involves getting properties under contract and then assigning the contract to another buyer (often a rehabber) for a fee, can also be a lucrative strategy in this environment without requiring significant capital upfront.

For Existing Homeowners: Okay, you might be thinking, “What about me? I already own a home.” Don't worry; there are still ways to make a recession work for you, even if you're not planning to buy or sell right now.

  • Refinancing Opportunities (Eventually): Interest rates might be high now, but they are cyclical too. If rates eventually come down (which is often the case in or after a recession to stimulate the economy), you could refinance your mortgage at a lower rate. This can significantly reduce your monthly payments and save you a lot of money over the life of your loan. Keep an eye on rate trends and be ready to jump when the time is right.
  • Focus on Home Improvement and Value Adds: Instead of worrying about the market fluctuations, focus on making your current home even better. Invest in upgrades that increase your home's value and your enjoyment of it. A new kitchen, a finished basement, energy-efficient upgrades – these can all pay off in the long run, both in terms of your quality of life and your home's resale value when the market recovers.
  • Review Your Mortgage Terms: Take this time to review your current mortgage and explore your options. Could you prepay some principal? Are you on the best possible loan program? Talking to a mortgage advisor can help you optimize your financial situation, regardless of market conditions.
  • Ride Out the Storm and Think Long-Term: Real estate is a long-term game. If you're not planning to sell immediately, don't panic about short-term price dips. Historically, real estate values tend to recover and appreciate over time. Focus on your long-term financial goals and remember that your home is more than just an investment; it's your home.

Smart Strategies to Thrive in a Real Estate Recession: Playing Your Cards Right

Knowing the opportunities is one thing; seizing them is another. Here’s my take on some key strategies to really make a real estate recession work for you:

  • Cash is King (and Liquidity is Queen): In any downturn, cash is king. Having cash on hand gives you flexibility and power. You can jump on deals quickly, make all-cash offers (which are very attractive to sellers in a slower market), and weather any financial uncertainties. Don't overextend yourself financially. Maintain a healthy cash reserve. Liquidity is equally important. Make sure your investments aren't all tied up in illiquid assets. Being able to access funds quickly is crucial.
  • Due Diligence is Your Best Friend: In a hot market, people sometimes skip steps in their haste to buy. Don't do that in a recession. Due diligence becomes even more critical. Thoroughly inspect properties, research market values, understand the neighborhood, and don't rush into any deals. Get professional inspections, review disclosures carefully, and don't be afraid to walk away if something feels off.
  • Negotiation Skills Become Your Superpower: In a buyer's market, negotiation is key. Don't be afraid to make offers below asking price. Be prepared to negotiate on repairs, contingencies, and closing dates. Remember, sellers are likely more motivated, so you have leverage. Practice your negotiation skills or work with a real estate agent who is a skilled negotiator.
  • Think Long-Term, Act Short-Term Opportunistically: While real estate is a long-term investment, recessions present short-term opportunities. Think long-term about your goals – building wealth, owning a home, generating income – but be ready to act quickly and decisively when those opportunities arise during the downturn. Be patient but be ready to pounce.
  • Seek Expert Advice and Build Your Network: Don't go it alone. Work with experienced real estate agents, mortgage brokers, financial advisors, and real estate attorneys. They can provide valuable insights, help you navigate the complexities of the market, and guide you to make smart decisions. Build your network. Connect with other investors, attend real estate events, and learn from those who have been through market cycles before.

I've personally seen people make incredible gains by being smart and strategic during market downturns. It's not about being a financial wizard; it's about being informed, prepared, and willing to see opportunity where others see only risk.

Conclusion: Recessions are Stepping Stones, Not Roadblocks

Look, recessions aren't fun for anyone. They can bring challenges and uncertainty. But they are also a natural part of the economic cycle. And for those who are prepared and willing to shift their mindset, a real estate recession can be a powerful catalyst for growth and wealth building.

Instead of fearing the headlines, use this time to educate yourself, strategize, and position yourself for future success. Whether you're a first-time buyer, a seasoned investor, or a current homeowner, there are ways to make this market work for you.

Remember, the market will recover. It always does. And those who act strategically during the downturn will be the ones who reap the rewards when the market bounces back. So, take a deep breath, stay informed, and get ready to make this real estate recession your springboard to success. This isn't the time to panic; it's the time to plan and prosper.

Profit From Real Estate—Even in a Down Market

Recessions create rare opportunities for savvy investors to secure deeply discounted properties and build long-term wealth.

Norada helps you target resilient markets with strong rental demand, ensuring positive cash flow—even when home prices soften.

HOT NEW LISTINGS JUST ADDED!

Talk to a Norada investment counselor today (No Obligation):

(800) 611-3060

Get Started Now

Read More:

  • Will There Be a Real Estate Recession in 2025: A Forecast
  • Are We in a Recession or Inflation: Forecast for 2025
  • How To Invest in Real Estate During a Recession?
  • Should I Buy a House Now or Wait for Recession?
  • Will There Be a Recession in 2025?

Filed Under: Foreclosures, Housing Market, Real Estate Tagged With: Housing Market, Recession

5 Worst Cities in Florida to Buy Real Estate

June 3, 2025 by Marco Santarelli

5 Worst Cities in Florida to Buy Real Estate

When it comes to investing in real estate, location is paramount. In Florida, known for its vibrant culture, beautiful beaches, and sunny disposition, choosing the right city can make or break your investment. However, not every city in the Sunshine State is a wise choice for real estate investment.

Florida's real estate market isn't a one-size-fits-all. This article delves into the five worst cities to buy property in 2024, providing crucial insights for potential buyers. By understanding these pitfalls, you can make wiser choices and avoid costly mistakes.

5 Worst Cities to Buy Real Estate in Florida

Before diving into the specifics, it’s essential to understand why certain cities fall short. Imagine stumbling upon a seemingly golden real estate opportunity, only to discover it's a fool's gold. This is the harsh reality for many investors who overlook the critical factors that can turn a promising property into a financial drain.

From ghost towns to crime-ridden neighborhoods, the urban landscape is littered with cautionary tales. To navigate these treacherous waters and secure a profitable investment, understanding the underlying market dynamics is paramount.

1. Miami Beach

Miami Beach often tops the list when discussing unwise real estate purchases. While it dazzles with luxury and is a major tourist hotspot, several detracting factors exist:

  • Skyrocketing Prices: The median home price often hovers above $1 million, making it unaffordable for most buyers.
  • Fluctuating Market Demand: High dependence on tourism leads to seasonal fluctuations in the property market. This unpredictability can result in the values of homes depreciating during off-peak seasons.
  • Increased Competition: A spike in investor interest has led to overpriced properties, often resulting in limited returns on investment.
  • Natural Disasters: As a coastal city, Miami Beach is susceptible to hurricanes and flooding, driving potential buyers away. Additionally, the cost of insurance can significantly impact profit margins.

For a detailed analysis of Miami Beach's real estate situation, read more here.

2. Daytona Beach

While Daytona Beach offers a unique mix of motorsports and coastal fun, it's not a wise choice for real estate investment due to:

  • High Vacancy Rates: The area has witnessed an increase in vacant properties, resulting in potential revenue loss for landlords.
  • Declining Population: An outflow of residents pursuing better opportunities can negatively impact demand for housing, thus lowering property values.
  • Economic Challenges: As tourism-driven, the economy remains vulnerable; changes in travel trends or economic downturns can lead to significant market instabilities.
  • Quality of Life Issues: Higher crime rates in parts of Daytona Beach may deter families and long-term residents, leading to financial losses for landlords.

Explore Daytona Beach's real estate climate in more detail here.

3. Fort Myers

Fort Myers often captivates buyers with its scenic beauty and laid-back atmosphere, but it poses several challenges for investors:

  • Oversaturated Market: A surplus of listings without corresponding buyer interest results in a buyer’s market, contributing to a potential decrease in property values.
  • Developmental Instability: The city has experienced various developments; however, these changes haven’t translated into stable increases in property values.
  • High Maintenance Costs: Due to weather conditions, properties often come with inflated maintenance costs, impacting overall profitability.
  • Uncertain Future: The mix of old and new development creates uncertainty regarding property value trends, making Fort Myers a risky bet for investors.

For insights on Fort Myers’ market dynamics, check out the analysis here.

4. Pensacola

While Pensacola provides a charming coastal vibe, factors make it one of the worst cities to invest in real estate:

  • Fluctuating Property Values: Inconsistent market performance can result in financial losses for investors unaware of the area's instability.
  • Limited Economic Growth: Heavily reliant on tourism and military sectors, Pensacola faces challenges in sustaining job growth, which can indirectly affect housing demand.
  • Crime Rates: Higher crime rates in some areas can deter families from moving to Pensacola, ultimately impacting property values.

For more insights regarding Pensacola's market conditions, visit this article.

5. Ocala

Completing the list, Ocala stands out for various reasons that make it a less favorable investment area:

  • Market Stagnation: Over recent years, the city has not seen meaningful growth in property values, leading to stagnation in investment returns.
  • Limited Employment Opportunities: A lack of diverse job options restricts population influx, decreasing demand for housing.
  • Aging Infrastructure: Old town features and facilities may require significant renovations, leading to higher transaction and maintenance costs.

Investors should tread carefully in Ocala. For further reading on this topic, follow this link here.

Analyzing the Broader Florida Housing Market in 2024

According to recent data and predictions, the Florida housing market in 2024 is expected to show mixed results. Although certain areas may thrive, others struggle due to various factors:

  • Consumer Trends: Homebuyers are increasingly seeking value, indicating a shift toward cities with affordable options, which can devalue properties in cities like Miami Beach and Fort Myers.
  • Rising Interest Rates: As mortgage rates continue to fluctuate, affordability will diminish, potentially leading to buyer reluctance in less appealing markets.
  • Investments in Infrastructure: Areas with better infrastructure developments generally yield better investment returns, thereby making cities with lagging infrastructure like Ocala and Daytona Beach less appealing.
  • Luxury Market Resilience: High-end markets may remain robust, as evidenced by luxury buyers from overseas driving demand, but this does little to improve the circumstances in the aforementioned cities.

Understanding housing market predictions provides valuable context for making informed investment decisions. For a comprehensive overview of the current housing market, read more about the trends and forecasts here.

Final Thoughts

Navigating Florida’s real estate market can be both exciting and daunting. Understanding the five worst cities to buy real estate in Florida, namely Miami Beach, Daytona Beach, Fort Myers, Pensacola, and Ocala, can help investors make informed decisions. Each city presents unique challenges that significantly impact current and future property values.

Although Florida remains a desirable destination for investors, examining the diverse characteristics of cities will prove essential. By investing time in thorough research and an understanding of market conditions, prospective buyers can steer clear of pitfalls and find favorable properties that promise the best returns.

Key Takeaways for Investors

  • Always conduct thorough market research before investing.
  • Be mindful of local economic conditions that can affect property values.
  • Stay updated on market trends to anticipate changes.
  • Invest in cities that have sustainable growth potential rather than simply those that are popular currently.

By following these guidelines, investors can secure solid investments aligned with their financial objectives, ultimately achieving success in the Florida housing market.

Work with Norada, Your Trusted Source for

Turnkey Real Estate Investing

Discover high-quality, ready-to-rent properties designed to deliver consistent returns.

Contact us today to expand your real estate portfolio with confidence.

Contact our investment counselors (No Obligation):

(800) 611-3060

Get Started Now 

Read More:

  • Worst Places to Live in Florida for Families & Retirees
  • Florida Housing Market Predictions for Next 2 Years
  • Top 10 Most Ghetto Cities in Florida
  • Florida Housing Market Warning: Insights from a Proven Predictor
  • Florida's Priciest Places: Top 35 Most Expensive Cities
  • Best Places to Live in Texas for Families
  • 10 Best Places to Live in Florida
  • Florida Housing Market: Will These 2 Metros Crash in 2025?
  • When Will the Housing Market Crash in Florida?
  • South Florida Housing Market: Will it Crash?
  • South Florida Housing Market: A Crossroads for Homebuyers
  • Florida Housing Market Trends: Rent Growth Falls Behind Nation

Filed Under: Housing Market, Real Estate, Real Estate Market Tagged With: Florida, Housing Market, Real Estate Investment

Atlanta Housing Market Flagged for a Major Home Price Decline

June 3, 2025 by Marco Santarelli

Atlanta Ranks Among High-Risk Housing Markets: Will it Crash?

Let's talk about something that might make your stomach drop a little if you own a home in Atlanta, or maybe perk up your ears if you're hoping to buy one. You might have seen headlines or heard whispers about certain housing markets being “at risk.” Well, according to recent insights by Cotality (Formerly CoreLogic), the buzz is true: Atlanta ranks among the high risk housing markets that may see significant price drops. Yes, a new report specifically flags the Atlanta area as the second-highest risk market in the entire country for home price decline.

That's a pretty bold statement, right? Especially for a city like Atlanta that's felt like a non-stop growth machine for years. People have been flocking here, jobs have been growing, and it felt like home prices were just destined to keep climbing forever. So, hearing that Atlanta is now considered “high risk” for a potential price crash – or at least a serious downward correction – is definitely news that grabs your attention.

Let me dive into what this data really means, why Atlanta is on this list, and what it could mean for you if you live here, are looking to buy, or thinking about selling.

Atlanta Housing Market Flagged for a Major Price Decline: Will it Crash?

What Does “High Risk” Even Mean in Real Estate?

When we talk about a “high risk” housing market in this context, it doesn't necessarily mean that tomorrow the bottom is going to fall out completely, like something out of a disaster movie. What it signals is that the market has a higher probability than others of seeing a significant decrease in home values.

Think of it like a weather forecast. A “high risk” of thunderstorms means you should probably make indoor plans, but it doesn't guarantee lightning will strike your house. In housing, high risk means the conditions are ripe for prices to decline notably, potentially by 10%, 15%, or even more in a relatively short period. A true “crash” is often associated with drops exceeding 20% or even 30%, like we saw in some areas during the 2008 financial crisis. The current data suggests the risk of such a scenario is elevated for places like Atlanta.

Atlanta's Spot on the High-Risk List

So, where does this “high risk” ranking come from? It's based on analysis of various factors, including recent price trends, affordability levels, changes in inventory, and broader economic conditions. According to the specific report I'm looking at (from Cotality, providing May 2025 insights), Atlanta isn't just on the list; it's near the very top. Atlanta, GA, is ranked #2 out of the top 5 markets identified with a very high risk of price decline among the top 100 largest metro areas.

That puts us right behind Albuquerque, New Mexico (#1), and ahead of other notable areas flagged for risk:

    1. Albuquerque, NM
    1. Atlanta, GA
    1. Winter Haven, FL
    1. Tampa, FL
    1. Tucson, AZ

It's interesting to see the company Atlanta is keeping here. We have a mix of Sunbelt cities that saw huge population influxes and price surges during the pandemic boom (Atlanta, the Florida cities, Tucson) and Albuquerque. This list points towards markets that might have gotten a little overheated or are facing specific challenges now.

Looking at the price trend chart provided, you can see that Atlanta's home prices, represented by the pink line, saw a massive surge starting in 2021, peaked sharply around mid-2022, dipped, recovered somewhat into early 2024, and then seem to be softening again slightly entering 2025. This kind of volatility and recent softening after a rapid run-up is one of the tell-tale signs that a market might be vulnerable. Atlanta's price peak was also notably higher than most of the other cities on this particular high-risk list before any potential correction.

Is an Atlanta Housing Crash Coming? New Report Says High Risk
Source: Cotality

Why is Atlanta Considered High Risk? Connecting the Dots from the Data

This is where we dig deeper than just the ranking. Why Atlanta? Let's look at some of the factors suggested by the data and add some local perspective.

  1. Rapid, Unsustainable Price Growth: Atlanta experienced phenomenal price appreciation over the last few years. While the provided data doesn't give Atlanta's specific percentage growth since the pandemic, it notes that states like Florida and Texas saw cumulative increases averaging 70% to 90%. Given Atlanta's popularity and growth during the same period, its increase was undoubtedly substantial, likely putting it in a similar league or at least pushing price levels far beyond historical norms relative to local incomes. My experience watching markets tells me that when prices climb too far, too fast, gravity eventually becomes a concern.
  2. Affordability Reached Breaking Point: When home prices double in a few years, but local incomes don't keep pace, homes become severely unaffordable for a large chunk of the population. The national data shows the median home price is $389,000 and requires an income of $86,500. Atlanta's median price likely isn't far off, and while median incomes in Atlanta are decent, the rate at which prices grew far outstripped wage growth. This forces buyers out of the market, shrinks the pool of potential buyers, and reduces demand. When demand drops but supply doesn't disappear, prices have to adjust downwards to meet buyers where they are (or where they can afford to be).
  3. Rising Inventory (Likely): While the report specifically mentions rapidly rising inventories contributing to weakened markets like Florida and Texas, this is a common factor in areas where demand is cooling. As homes become less affordable due to high prices and elevated mortgage rates (which, while dipping slightly in March 2025 according to the data, are still a significant factor compared to the rock-bottom rates of 2020-2021), homes sit on the market longer. This increases the overall supply of homes for sale, putting downward pressure on prices. I've seen inventory tick up in many formerly scorching markets, and it's reasonable to assume Atlanta is experiencing this trend to some degree as well, moving from a severe seller's market towards more balance, and eventually, potentially, a buyer's market in some segments.
  4. Shifting State-Level Trends: The data point that Georgia overall saw a negative price appreciation of -0.3% in March is telling. While Atlanta might have hit “new records” at some point recently, that negative state-level number suggests a cooling trend was already underway statewide entering spring 2025. As the major economic engine of Georgia, a negative trend statewide is highly likely to impact Atlanta, if it hasn't already pulled Atlanta into negative territory after the specific data snapshot.
  5. Broader Economic Headwinds: The report mentions consumer concerns about personal finances, job prospects, and potential tariff impacts. These national and international worries trickle down to local markets. If people are worried about their jobs or how much money they have left after inflation and high interest payments, they're less likely to make a huge purchase like a home, or they have less flexibility in their budget, further impacting affordability.

From my perspective, the combination of these factors creates a perfect storm of vulnerability for the Atlanta market. It had massive, rapid appreciation. That appreciation severely strained affordability. Now, with higher borrowing costs (even if slightly lower than peak), consumer caution, and potentially rising inventory, the air is getting thinner for prices at their current altitude.

Atlanta vs. Other Markets: A Quick Look

It's useful to compare Atlanta's situation to other market types mentioned in the data:

  • The Resilient Northeast/Midwest: Markets like Rhode Island, Connecticut, and New Jersey saw strong 7%+ year-over-year growth. Why? The report suggests a “severe lack of inventory” combined with “more affordable” price ranges (~$230,000 median). Atlanta's inventory might be increasing (unlike the Northeast), and its price point is significantly higher, making it less resilient to affordability pressures.
  • The Already Declining West: Utah and Idaho saw prices drop 2.1% and 2.2%. These were also pandemic boomtowns that got very expensive, very fast. Atlanta seems to be following a similar trajectory towards potential decline, just perhaps a bit behind or distinct in its specific timing and triggers.
  • The Weakened Florida/Texas Markets: Florida and Texas, like Atlanta, had massive cumulative price increases (70-90%). The report explicitly links this rapid growth to “significant affordability challenges” and notes rising inventory. This is exactly the path Atlanta seems to be on, just now being officially flagged as high risk. Winter Haven, Tampa, and other Florida markets already seeing negative annual changes might be slightly ahead of Atlanta in the correction cycle.

This comparison helps illustrate that Atlanta's high-risk status isn't an anomaly; it fits a pattern seen in markets that experienced hyper-growth and affordability stretching during the low-rate era.

What Does This Mean for You?

This is the critical question. If you're connected to the Atlanta real estate market, this ranking should definitely be part of your thinking.

  • If You're a Potential Buyer in Atlanta: This information could feel like a ray of hope. A “high risk” market with potential price declines means that the insane bidding wars and feeling of missing out could become less common. Prices might become more reasonable, or at least stop their upward march. However, buying in a high-risk market also comes with its own risk: you could buy today, and the value of your home could drop significantly in the short to medium term. This is less concerning if you plan to stay in the home for many years (5-10+), as markets tend to recover over time. But if you might need to sell in a few years, buying in a high-risk, potentially declining market is riskier. My advice? Do your homework, don't overpay, ensure the home meets your long-term needs, and be financially prepared for the possibility that the home's value might go down before it goes back up.
  • If You're a Current Atlanta Homeowner: Hearing your market is high risk for a crash is understandably worrying. The most important thing is not to panic. Real estate is often a long-term investment. If you bought your home years ago, before the recent run-up, you likely have significant equity, and a 10-20% correction might only erase some of your recent gains, not your entire investment. If you bought very recently at the peak (or close to it), you are at higher risk of being “underwater” (owing more than the home is worth) if prices fall substantially. Think about your personal situation:
    • Are you planning to sell soon? If so, be prepared for the market to be tougher. Homes may take longer to sell, and you might need to price more competitively or accept offers below what neighbors got a year ago.
    • Is this your long-term home? If you plan to stay put for 5-10 years or more, short-term price fluctuations are less critical. Focus on enjoying your home and its long-term value potential.
    • How is your financial situation? Are you comfortable with your mortgage payments? Having a stable job and finances is key, regardless of market ups and downs.
  • If You're a Potential Seller in Atlanta: The party might be over, or at least winding down. You're likely not going to get 15 offers above asking price within hours of listing anymore. You need to be realistic about pricing. Look at recent sales data, not sales from 6-12 months ago. Condition matters more in a cooling market. Be prepared for your home to sit longer and potentially need price adjustments. From my experience, sellers who are stubborn about peak pricing in a declining market often end up selling for less than they would have if they had priced appropriately from the start.

Is a “Crash” Guaranteed?

No, the word “risk” is key here. Atlanta is at risk of a significant decline, but it's not a guaranteed outcome. Markets are complex and influenced by many factors that can change.

What could prevent a full-blown crash (say, 20%+ drops)?

  • Continued Population Growth: Atlanta is still a desirable city for many, attracting new residents and businesses. Continued strong migration could help cushion falling demand from existing residents.
  • Strong Local Economy: If Atlanta's job market remains robust despite national concerns, it provides underlying support for the housing market.
  • Limited Supply Eventually: While inventory may be rising, it's possible that over the next few years, new construction slows down significantly due of market uncertainty, which could limit supply in the longer term and help prices stabilize after a correction.
  • Interest Rate Changes: While the data shows rates were still a factor in March 2025, a significant drop in mortgage rates (unforeseen in this report's context) could potentially re-ignite some buyer demand.

My professional opinion is that a significant correction (a drop of maybe 10-15% from the recent peak) in the Atlanta market seems highly probable given the factors identified in this report – rapid appreciation, stretched affordability, and cooling demand. Whether it escalates into a full-blown “crash” depends on how deep and prolonged the economic headwinds are and how much inventory ultimately comes onto the market. Atlanta's underlying fundamentals might prevent the absolute worst-case scenario, but the data is a clear warning sign that a significant price adjustment is much more likely than continued robust growth.

In Conclusion

The analysis ranking Atlanta as the second-highest risk housing market in the U.S. for price decline is a serious signal. It highlights that the rapid growth seen in recent years has made the market vulnerable due to affordability constraints and cooling demand driven by higher costs and economic uncertainty.

For anyone involved in the Atlanta housing market – whether buying, selling, or just owning – understanding this risk is crucial. It means being realistic, making informed decisions based on current market conditions, and preparing for the possibility that the value of homes in Atlanta may decrease before they eventually start to climb again. It's a shift from the euphoric seller's market we saw, and while it presents challenges, it could also open doors for those who were previously priced out. Stay informed, watch the local inventory levels and sales volumes closely, and factor this risk into your real estate plans.

“Invest in Turnkey Real Estate: Simple & Profitable”

With growing fears of a real estate crash in Atlanta, it’s more important than ever to choose low-risk, high-cash-flow markets with long-term fundamentals.

Norada helps investors navigate turbulent times by identifying strong markets backed by job growth, population gains, and affordability.

HOT NEW LISTINGS JUST ADDED!

Talk to a Norada investment counselor today (No Obligation):

(800) 611-3060

Get Started Now

Recommended Read:

  • Is the U.S. Heading Toward a Real Estate Crash and Debt Bubble?
  • 5 Riskiest Housing Markets to Avoid in 2025 That May Crash
  • Housing Market Predictions for the Next 4 Years: 2025-2029
  • Top 22 Housing Markets Where Prices Are Predicted to Rise the Most by 2026
  • Housing Market Predictions 2026: Will it Crash or Boom?
  • 12 Housing Markets Set for Double-Digit Price Decline by Early 2026
  • 4 States Facing the Major Housing Market Crash or Correction
  • Housing Prices Are Set to Rise by 4.1% by the End of 2025
  • Housing Market Predictions for the Next 4 Years: 2025 to 2029
  • Real Estate Forecast: Will Home Prices Bottom Out in 2025?
  • Housing Markets With the Biggest Decline in Home Prices Since 2024
  • Why Real Estate Can Thrive During Tariffs Led Economic Uncertainty
  • 5 Hottest Real Estate Markets for Buyers & Investors in 2025
  • Will Real Estate Rebound in 2025: Top Predictions by Experts
  • Will the Housing Market Crash Due to Looming Recession in 2025?

Filed Under: Housing Market, Real Estate Market Tagged With: Debt Bubble, Housing Market, real estate, Real Estate Crash

Average House Price Increase Over Last 30 Years

June 1, 2025 by Marco Santarelli

Average House Price Increase Over Last 30 Years

When it comes to the average house price increase over the last 30 years, one thing is clear: the numbers have skyrocketed. We're not talking about a little jump; they've shot up by hundreds of percentage points, even after you account for inflation making things more expensive overall.

This isn't just some boring statistic. It's a big deal caused by a bunch of different things, like how the economy's doing, what's going on in society, and even political stuff – all of which affect the housing market. So why did this happen, and what does it mean for people who want to buy a house someday?

Let's dive in and uncover the reasons behind these crazy high prices and see how they impact everyone, from the entire economy down to what it means for you and me.

The Evolution of House Prices Over the Last 30 Years

Ask any homeowner or potential buyer about the current state of house prices, and you might hear tales of bidding wars, escalating costs, and heartbreaks over missed opportunities. Over the past three decades, housing prices have taken off, leaving many to wonder what has driven such massive growth. The average house price increase over the last 30 years is not just a statistic; it’s a reflection of numerous economic shifts, demographic changes, and policy decisions that have converged to transform the housing landscape in America.

Historical Context: Tracking the 30-Year Climb

To fully grasp the scope of how house prices have evolved, we must consider historical data. From 1994 to 2024, the U.S. House Price Index has demonstrated a compelling upward trajectory. According to data, the index averaged an impressive annual growth of 4.63% between 1992 and 2024, with an astonishing peak at 19.10% in July 2021 (Trading Economics).

Several pivotal moments marked this climb:

  • Economic Resilience: After the recession of the early 1990s, the U.S. experienced significant economic growth, fueled by technological advancements and globalization. This progress instilled consumer confidence and drove people toward homeownership.
  • Inflation: Inflation is a powerful force that affects purchasing power. Over the last 30 years, inflation has caused shifts in purchasing trends, especially in housing. For example, the Case-Shiller U.S. National Home Price index reported an increase of 18.6% over a singular year in 2021, the highest in recorded history (White House CEA).
  • Interest Rates: Perhaps one of the largest contributions to the increase in house prices was the unprecedented low-interest rates offered in the early 2020s, spurred by the Federal Reserve’s efforts to boost the economy during the COVID-19 pandemic. With cheaper loans, more potential homeowners entered the market, pushing demand—and consequently prices—upwards.

The 2008 Financial Crisis: A Temporary Setback

It’s essential to highlight the 2008 financial crisis, a significant event that momentarily halted the meteoric rise of housing prices. The bubble burst due to irrational lending practices, leading to widespread foreclosures. Home prices plummeted by nearly 30% from their peak before beginning the slow recovery that would eventually drive prices to new heights.

By 2012, home prices began to rebound, initiating a long recovery process driven by low inventory levels and a growing demand for housing. According to Freddie Mac, home price growth began accelerating between 2012 and 2018, setting the foundation for what many would refer to as a housing boom.

Regional Variations: Different Markets, Different Stories

While the national average offers one narrative, local markets tell another. Certain metropolitan areas have experienced greater increases than others over this period. For instance, Denver leads U.S. metropolitan areas, having witnessed substantial increases in property valuations (St. Louis Fed).

Why such disparity?

  • Local Economies: Cities with booming job markets, like San Francisco and Austin, experienced increased housing demand, resulting in surging prices. The average home price in San Francisco has reached nearly nine times the average earnings in the area as of 2022, reflecting a significant affordability crisis.
  • Geographic Limitations: Areas with geographical restrictions, such as coastal cities or mountainous regions, often face supply issues that further exacerbate price increases.
  • Urban vs. Suburban Shifts: The COVID-19 pandemic prompted a significant shift in preferences, with many people seeking homes outside the bustling city centers. This trend spurred a bomb in suburban real estate activity, further complicating the average price increase narrative.

The Impact of Demographics: Buyers vs. Renters

As we observe the average house price increase over the last 30 years, it's crucial to discuss demographic shifts. The Millennial generation, one of the largest cohorts in U.S. history, has started entering the housing market in substantial numbers. Their preferences differ from previous generations, leaning towards smaller, urban living spaces instead of sprawling single-family homes.

However, facing staggering house prices, many Millennials have been pushed into the rental market, creating further pressure on rental prices. According to reports, rental prices have also soared dramatically, increasing by nearly 30% in certain areas. This scenario creates a feedback loop—high prices might prevent buyers from entering the market, sustaining demand for rental properties and subsequently affecting rent prices.

Global Comparison: How Does the U.S. Measure Up?

When reflecting on the average house price increase over the last 30 years, it's insightful to see how the U.S. compares globally. Countries like the UK have seen similar trends in house price inflation, but the pace and magnitude can vary. As of 2022, the average house in the UK costs around nine times the average earnings (Schroders UK).

The factors that influence housing markets across the globe, such as interest rates, local demand, and shifts in consumer behavior, are often interconnected. The U.S. market tends to react quickly to international economic events and trends, which further complicates a clear understanding of housing prices.

Future Outlook: What Lies Ahead?

With this breathtaking growth trajectory in house prices, many wonder whether a slowdown is imminent. Current economic markers and policy interventions may reveal answers.

  • Economic Predictions: Experts predict a tempering of the rapid demand for housing, influenced by rising interest rates and cooling economic conditions. However, the ongoing scarcity of housing inventory could continue to inflate prices, rendering predictions complex.
  • Government Interventions: Potential changes to policy may aim to stabilize the market. Tax incentives or public housing initiatives could reshape dynamics, allowing more individuals to enter homeownership.
  • Sustainability Concerns: The focus on sustainability has begun to change homeowner priorities. Energy-efficient homes or those with lower carbon footprints might attract higher prices in the future, shifting what constitutes a “desirable” home.

Conclusion:

If you're a future buyer watching prices climb, being informed is essential. The housing market is cyclical, marked by periods of feverish growth followed by corrections. While the average house price increase over the last 30 years reveals significant economic insights, ultimately, it’s a reminder of the complicated dynamics that govern real estate. By understanding these patterns, you can navigate through these intriguing times ahead and make educated decisions.

Reflecting on the last three decades, themes of resilience, innovation, and adaptability come to the forefront. The data shows that while past trends will influence the future, emerging patterns in buyer behavior and global economics will continually reshape the real estate landscape.

Related Articles:

  • Average House Price in 1950 (Compared to Today)
  • What Will the Average House Price Be in 2040: Predictions
  • Average Cost of a House in 1970, 1990, and 2000
  • Average Cost of a House in 1980
  • Average Housing Prices by Year in the United States
  • Average Home Value Increase Per Year, 5 Years, 10 Years
  • Average Home Appreciation Over 30 Years: How to Calculate?
  • House Price Graph Last 20 Years USA
  • Housing Market Graph 50 Years: Showing Price Growth

Filed Under: Housing Market Tagged With: Average House Price, Housing Market

Housing Market Graph 50 Years: Showing Price Growth

June 1, 2025 by Marco Santarelli

Housing Market Graph 50 Years

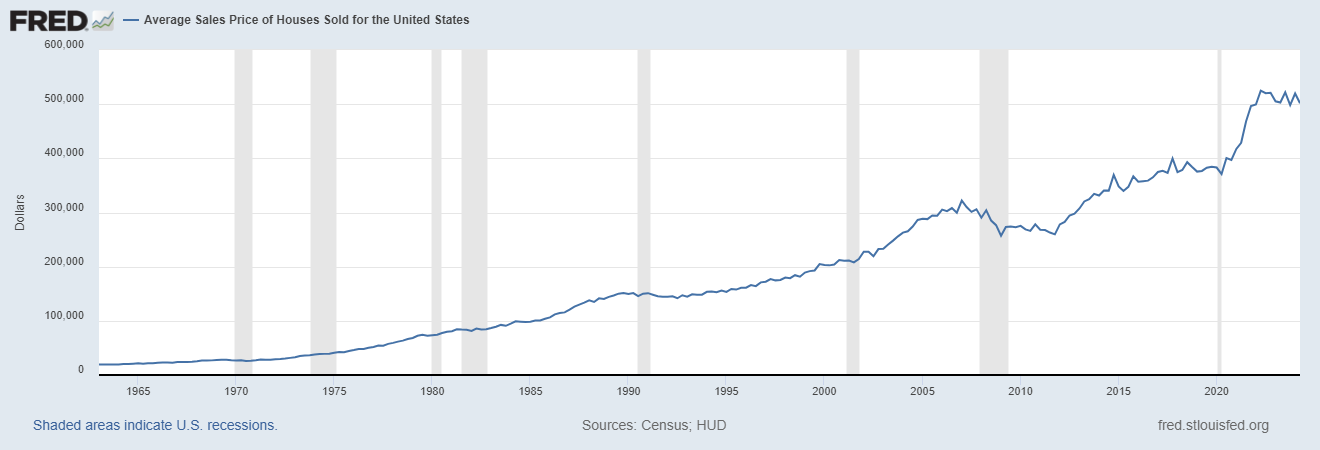
The housing market graph for 50 years is more than just a chart; it's a fascinating story about the American dream, economic booms and busts, and the ever-changing forces that shape where we live. From the humble beginnings of around $20,000 in the 1960s to the head-spinning figures exceeding half a million today, the journey of U.S. home prices has been anything but boring.

Think of it like this: your grandparents probably tell you stories about how cheap things were “back in their day.” Well, they weren't kidding, especially when it comes to houses! But before we dive into the hows and whys of this incredible journey, let's break down the data and see just how much things have changed.

Chart: U.S. Home Price Growth Over 50 Years: A Rollercoaster Ride

Housing Market Graph 50 Years
Souce: FRED

The Numbers Don't Lie: A Look at the Housing Market Graph (50 Years)

Thanks to the diligent data collection of the U.S. Census Bureau and the U.S. Department of Housing and Urban Development, we have a clear picture of how average house prices have evolved over the past five decades. This information, compiled by the Federal Reserve Bank of St. Louis, forms the backbone of our housing market graph (50 years) analysis:

  • 1960s: The Era of Affordability – The average house price hovered around $20,000. Imagine buying a house with what some people spend on a new car today!
  • 1970s: Inflation Hits Hard – Prices started to climb, reaching around $50,000 by the decade's end. This period saw high inflation, which affected the price of everything, including homes.
  • 1980s: Steady Growth – The average price reached $100,000, a significant milestone. This was a time of relative economic stability and a growing middle class.
  • 1990s: A Bit of a Lull – The housing market graph 50 years shows a slight plateau, with prices hovering around $150,000. The early '90s recession played a role in this.
  • 2000s: The Boom and Bust – The early 2000s saw a dramatic surge in prices, peaking at an average of over $300,000 before the housing bubble burst in 2008, leading to a sharp decline.
  • 2010s-Present: The Road to Recovery and Beyond – Prices have steadily recovered, exceeding pre-2008 peaks and recently reaching over $500,000.

What Drives the Housing Market: Unpacking the “Why” Behind the Graph

Looking at the housing market graph for 50 years, it's clear that home prices haven't just gone up in a straight line. There have been periods of rapid growth, stagnation, and even decline. So, what are the key factors that have shaped these trends?

1. Interest Rates: The Price of Money

Interest rates are like the volume knob for the housing market. When rates are low, borrowing money is cheaper, leading to increased demand for homes and, you guessed it, higher prices. Conversely, high-interest rates make mortgages more expensive, cooling down the market and potentially causing prices to drop or stabilize.

2. Economic Growth: Jobs, Wages, and Confidence

When the economy is booming, people feel more secure in their jobs and have more disposable income. This often translates to increased home buying, further fueling demand and pushing prices up. On the flip side, economic downturns can lead to job losses and financial uncertainty, making people hesitant to buy homes and potentially causing a decline in prices.

3. Supply and Demand: The Never-Ending Tug-of-War

The fundamental principle of economics—supply and demand—plays a crucial role in the housing market. When there are more buyers than sellers (high demand, low supply), prices tend to rise. Conversely, when there are more sellers than buyers (low demand, high supply), prices may fall or stagnate.

4. Demographics: The People Factor

Population growth, migration patterns, and even the age distribution of a population can impact the housing market. For example, a surge in young adults entering the housing market can lead to increased demand, while an aging population might result in more homes being put up for sale.

5. Government Policies: A Helping Hand or a Heavy Hand?

Government policies, such as tax incentives for homebuyers or regulations on lending practices, can have a significant impact on the housing market. These policies can be implemented to encourage homeownership, stabilize prices, or address other economic concerns.

Lessons from the Past, Insights for the Future

The housing market graph (50 years) provides valuable lessons about the cyclical nature of real estate.

  • What goes up doesn't always go up forever. The housing bubble of the 2000s is a stark reminder that unsustainable growth can lead to painful corrections.
  • Multiple factors are always at play. Understanding the interplay of interest rates, economic conditions, and other factors is crucial for making informed decisions about buying or selling a home.
  • The market is always evolving. New trends, technologies, and societal shifts will continue to shape the housing market in unpredictable ways.

The Future of Housing: What Lies Ahead?

Predicting the future of the housing market is no easy task. However, by analyzing current trends and considering potential economic and societal shifts, we can make some educated guesses:

  • Affordability Concerns: As prices continue to rise faster than wages in many areas, affordability will likely remain a major concern. This could lead to increased demand for smaller homes, more people renting for longer periods, and a greater focus on affordable housing solutions.
  • The Rise of Technology: Technology is transforming how we buy, sell, and even experience homes. From virtual tours to online real estate platforms, technology is likely to play an even more prominent role in the future of the housing market.
  • Changing Demographics: The aging of the Baby Boomer generation, coupled with shifting migration patterns, could impact housing demand in different regions.

In Conclusion

The housing market graph (50 years) is a testament to the dynamic nature of real estate. Understanding the factors that have shaped the market over the past five decades can provide valuable insights for both homebuyers and sellers as they navigate the ever-evolving world of real estate. While predicting the future of housing is an impossible task, one thing is certain: the journey will continue to be full of twists, turns, and perhaps even a few surprises along the way.

Related Articles:

  • San Diego Housing Market Graph 50 Years: Analysis and Trends
  • Average Housing Prices by Year in the United States
  • Average Home Value Increase Per Year, 5 Years, 10 Years
  • How Much Did Housing Prices Drop in 2008?
  • Housing Market Crash 2008 Explained: Causes and Effects
  • Housing Market Predictions for Next 5 Years: 2025 to 2029
  • Housing Market Predictions for Next Year: Prices to Rise by 4.4%
  • Housing Market Predictions for the Next 4 Years: 2024 to 2028

Filed Under: Housing Market Tagged With: Housing Market, Housing Market Graph

Average House Price in 1950 (Compared to Today)

June 1, 2025 by Marco Santarelli

Average House Price in 1950 (Compared to Today)

Ever wondered what your grandparents or even great-grandparents paid for their homes? The average house price in 1950 might shock you! It's a fascinating journey back in time, revealing how much the housing market has changed and how inflation has played a major role.

The Average House Price in 1950: A Blast from the Past

A Glimpse into the 1950s Housing Market

The year is 1950. The post-war boom is in full swing, families are growing, and the American dream of homeownership is within reach for many. But what did that dream cost?

  • In 1950, the average house price in the United States was a mere $7,354.
  • Today, that might sound like a steal, but adjusted for inflation, that's roughly $93,602.08 in 2024 dollars.

To put this into perspective, the average house price in 2024 is about 12.73 times higher than it was in 1950. That's a significant jump!

Why the Drastic Difference in Average House Prices?

Several factors contribute to this incredible difference in average house prices over the decades:

  • Inflation: The value of money changes over time. What you could buy for a dollar in 1950 is significantly different from what you can buy today. Inflation is a major reason why we see such a large difference in housing prices.
  • Economic Growth: The post-war period saw significant economic growth in the U.S., leading to increased demand for housing and driving up prices.
  • Interest Rates: Interest rates on mortgages were much lower in the 1950s, making it easier for people to afford homes.
  • Construction Costs: The cost of building materials and labor has risen significantly over time, contributing to higher home prices.

A Look at the Decades: Average House Prices Then and Now

To understand just how much the housing market has changed, let's take a look at the average house prices for each decade since the 1940s, comparing them to 2024 dollars:

Decade Average House Price (Then) Average House Price (2024 Dollars)
1940s $2,938 $64,372.84
1950s $7,354 $93,602.08
1960s $19,300 $193,470.52
1970s $40,900 $233,195.38
1980s $151,200 $374,032.22
1990s $204,800 $377,080
2000s $322,100 $476,521
2010s $399,700 $488,024
2020s $552,600 $579,205


The Impact on Homeownership

The dramatic increase in average house prices over the decades has significantly impacted homeownership, making it more challenging for subsequent generations to enter the market. Factors like wage stagnation, student loan debt, and stricter lending practices contribute to this challenge.

My Personal Take on the Housing Market

As someone who has closely watched the housing market for years, I'm constantly fascinated by its fluctuations. The average house price in 1950 serves as a stark reminder of how much things have changed. While it's exciting to see progress and growth, it's also crucial to acknowledge the challenges that rising housing costs present to many individuals and families today.

Finding ways to make homeownership more attainable for future generations should be a priority. This might involve exploring innovative housing solutions, addressing student loan debt, and promoting policies that support affordable housing initiatives.

In Conclusion

Looking back at how much houses cost in 1950 is like peeking into a whole different world! It's wild to see how much things have changed in the housing market. Now, buying a house can feel like a wild ride, right? But by understanding how things worked in the past, we can work towards making sure everyone who wants to own a home someday, can.

Related Articles:

  • Housing Market Graph 50 Years: Showing Price Growth
  • Average Housing Prices by Year in the United States
  • Average Home Value Increase Per Year, 5 Years, 10 Years
  • San Diego Housing Market Graph 50 Years: Analysis and Trends
  • How Much Did Housing Prices Drop in 2008?
  • Housing Market Crash 2008 Explained: Causes and Effects
  • Housing Market Predictions for Next 5 Years: 2025 to 2029
  • Housing Market Predictions for Next Year: Prices to Rise by 4.4%
  • Housing Market Predictions for the Next 4 Years: 2024 to 2028

Filed Under: Housing Market Tagged With: Average House Price, Housing Market

What Will the Average House Price Be in 2040: Predictions

June 1, 2025 by Marco Santarelli

What Will the Average House Price Be in 2040: Predictions

For most Americans, their home is their biggest investment. So, naturally, the question of what the future holds for housing prices is a hot topic. Here's a quick look at US house price growth over the years:

  • Average YoY growth rate (Mar 1992 – Mar 2024): 5.5%
  • All-time high YoY growth: 17.8% (September 2021)
  • Record low YoY growth: -12.4% (December 2008)

With homeownership being a priority for many, will you be able to afford a house in 16 years? Let's delve into the factors that might shape the average US house price in 2040.

US House Price Growth Over the Years

Average YoY Growth

5.5%

(Mar 1992 – Mar 2024)

All-time High Growth

17.8%

(September 2021)

Record Low Growth

-12.4%

(December 2008)

Growth Timeline

1992

2008

2021

2024


Predicting the Average US House Price in 2040

The Winds of Change: Factors at Play

Predicting the future is no easy feat, and the housing market is no exception. Here are some key elements that will likely influence the average house price in 2040:

Inflation: This invisible hand steadily pushes prices upwards. Over the past few decades, inflation has averaged around 2-3% annually in the U.S. While the exact rate in the coming years is uncertain, it's a safe bet that inflation will cause a rise in average house price. This doesn't necessarily mean a house will cost twice as much in 2040 compared to today, but it does suggest that steadily increasing prices will erode purchasing power.

Interest Rates: The cost of borrowing to buy a house significantly impacts affordability. If interest rates remain low, it could fuel demand and potentially push prices higher. Conversely, rising interest rates would make monthly mortgage payments more expensive, potentially dampening demand and slowing price growth. The Federal Reserve plays a key role in setting interest rates, but various economic factors also influence them.

Supply and Demand: Basic economics tells us that if there's a shortage of houses compared to the number of buyers, prices will rise. Demographics play a role here – millennials, a large generation, are entering prime home-buying years. This could create high demand, especially in desirable areas where there's already limited inventory. On the other hand, if new construction keeps pace with demand, it could help stabilize prices.

Location, Location, Location: The adage holds true. Prices will likely continue to vary greatly depending on factors like proximity to job centers, amenities, and overall desirability. Coastal areas, vibrant cities, and suburbs with excellent schools tend to command a premium. However, affordability concerns may cause some buyers to look beyond traditional hot spots and consider more geographically diverse locations.

Looking at the Crystal Ball (Through Fuzzy Glasses)

Expert opinions on future house prices diverge. Some, like speakers at recent investment banker conferences, point to historical trends and project a continuation of the current upward trajectory, with the median house price exceeding $1 million by 2040 [source: YouTube video talking about investment bankers conference]. Their reasoning hinges on the assumption that low-interest rates and a growing population will continue to fuel demand, outpacing new construction.

On the other hand, some analysts foresee a more modest increase. They acknowledge the influence of inflation and demographics but also consider potential dampening factors. An economic downturn or a significant rise in interest rates could cool the market. Additionally, a shift towards more affordable housing options, or a rise in remote work opportunities leading to a decline in the importance of location, could also impact average prices.

$1 Million Homes: Can Americans Afford Them in 2040?

  • Wage Growth: If wages keep pace with inflation and rising house prices, then a $1 million median price might not be completely out of reach. However, historically, wage growth hasn't kept up with housing prices, making affordability a challenge.
  • Interest Rates: Low interest rates make monthly payments more manageable. But if rates rise significantly, even a million-dollar house could become unaffordable for many.
  • Shifting Demographics: Millennials, a large cohort, are entering prime home-buying years. This high demand could push prices even higher, especially in desirable locations.
  • Alternative Housing Options: The rise of tiny homes, multi-generational living, and co-op ownership could become more prevalent as affordability concerns mount.

Here's a breakdown of possible scenarios:

  • Scenario 1: Balanced Growth: If wages rise at an average of 3% annually, keeping pace with inflation, and interest rates stay around 4%, a $1 million median price could be achievable for some Americans, particularly those with high incomes or dual earners. For example, a couple with a combined pre-tax income of $150,000 might qualify for a mortgage on a $1 million house, assuming a 20% down payment. However, for many middle-class earners, especially those in single-income households, a $1 million median price would likely still be out of reach.

Overall, a $1 million median price in 2040 would likely create a more segmented housing market:

  • High-cost areas: Prices in desirable locations could significantly exceed the national median, further limiting affordability.
  • More affordable regions: Areas with lower overall living costs might see a surge in popularity as people prioritize affordability over location.

The future remains uncertain, but one thing is clear: affordability will be a key concern in a $1 million housing market.

The Takeaway: Be Prepared, Not Paranoid

It's important to remember that unforeseen events can dramatically impact the housing market. Economic downturns, changes in government policy, or natural disasters can all disrupt trends.

While the average price is interesting, what truly matters is affordability. Even if the average house price doesn't skyrocket, stagnant wages could make homeownership increasingly difficult for many.

While predicting the exact average house price in 2040 is impossible, understanding the influencing factors can help you make informed decisions. Focus on building a solid financial foundation, explore areas with a good balance of affordability and desirability, and consider alternative housing options if needed.

Remember, the path to homeownership isn't always linear. Stay informed, be adaptable, and don't let the uncertainty of the future hold you back from achieving your dream home.

Position Yourself for 2040—Start Investing in Real Estate Now

As average home prices are expected to rise significantly by 2040, investing in income-generating properties today can help you build massive equity and wealth over time.

Norada Real Estate connects investors with turnkey rental properties in growth markets—so you can benefit from appreciation, cash flow, and tax advantages.

HOT NEW LISTINGS JUST ADDED!

Talk to a Norada investment counselor today (No Obligation):

(800) 611-3060

Get Started Now 

Read More:

  • Real Estate Forecast Next 10 Years: Will Prices Skyrocket?
  • Housing Market Predictions for Next 5 Years (2025-2029)
  • Housing Market Predictions for 2027: Experts Differ on Forecast
  • Housing Market Predictions for the Next 2 Years
  • Housing Market Predictions: Will Real Estate Crash?

Filed Under: Housing Market, Real Estate, Real Estate Market Tagged With: Housing Market, Real Estate Market

Average Cost of a House in 1980

June 1, 2025 by Marco Santarelli

Average Cost of a House in 1980

Have you ever found yourself pondering the financial decisions your parents or grandparents made when they purchased their first homes? Picture this: it’s the vibrant 1980s, a decade filled with iconic fashion trends like leg warmers and shoulder pads, and music that defined a generation.

This era, marked by economic fluctuations and cultural shifts, had a profound impact on the housing market. Can you believe the average cost of a house in 1980 was $76,375? It's crazy to think about how much things have changed, especially the price of buying a house! We're going to take a fun trip back to the 80s to see what the houses and apartments looked like back then. Get ready for some serious flashbacks!

What Was the Average Cost of a House in 1980?

Setting the Stage: The Economic Vibe of 1980

Before we delve into the specifics of housing costs, it’s essential to understand the broader economic context of 1980. The U.S. economy was grappling with severe inflation, presenting a unique and challenging environment for homebuyers. Picture this scenario: you stroll through the local grocery store, only to observe prices perpetually on the rise. In fact, by 1980, inflation had reached alarming heights, fundamentally altering consumer behavior and economic stability.

  • Inflation Rates: By the end of the 1970s, inflation had jumped to about 13.5%, significantly affecting everyday expenses, from groceries to housing. This created an atmosphere where costs seemed to soar overnight, leading to a cautious approach in major purchases.

The high inflation rates forced many families to rethink their strategies when it came to buying homes. Housing became a necessity in an environment where financial confidence was shaky, affecting everything from the average house price to mortgage approvals.

The Average Cost of a House in 1980: Hold onto Your Hats!

Now, let’s get to the heart of the matter—how much did a typical house actually cost in 1980? According to the Federal Reserve Bank of St. Louis, which has meticulously documented financial trends (source: Federal Reserve Bank of St. Louis), the average sales price of a house in the United States fluctuated significantly throughout the year:

Date Average Sales Price
1980-01-01 $73,600
1980-04-01 $74,400
1980-07-01 $77,500
1980-10-01 $80,000

Can you believe that the average house price just about breached the $80,000 mark by the end of the year? This figure seems startlingly low when compared to contemporary prices, where the cost of entry into the housing market can often exceed $300,000. However, it’s crucial to remember that incomes were considerably lower during this time period, creating a different dynamic in the housing market.


Why Was the Average House Price in 1980 So Different?

There are several key factors that explain why the average cost of a home in 1980 presents such a stark contrast to today’s averages:

  • Inflation: As mentioned earlier, while prices were rising due to inflation, the increase in home prices during the 1980s didn’t match the rapid uptick seen in later decades. Consequently, homes were deemed more affordable relative to income levels at the time.
  • Interest Rates: Here’s a crucial factor that changed the game entirely—mortgage interest rates in 1980 were incredibly high, peaking at over 18% at points during the decade. Imagine taking out a mortgage with such exorbitant rates! The high interest burden significantly impacted what families could afford, creating a challenging environment for potential buyers even though home prices seemed low at face value.
  • Different Housing Market Dynamics: The housing market in 1980 was characterized by a lack of emphasis on luxury and size. Unlike today’s trends, where mini-mansions and high-end amenities are prioritized, homebuyers often focused on affordability and basic comfort. This cultural shift has led to a drastic change in what is perceived as desirable in real estate, influencing demand and price growth in subsequent decades.

A Blast from the Past: What Else Could You Buy in 1980?

To gain perspective on the value of $80,000 in 1980, let’s take a whimsical ride down memory lane and see what delightful purchases were possible:

  • Arcade Games Galore: The 80s were the golden age of arcade gaming! Back when each play of Pac-Man cost only a quarter, your $80,000 could have afforded you an astounding 320,000 game plays!
  • A Fleet of Quirky Cars: The automotive industry saw a surge of colorful, boxy designs in this decade. With the price of a new car ranging from $7,000 to $8,000, you could have bought yourself an entire fleet of flashy vehicles, giving you plenty of style on the road.
  • Denim Dreams: With 1980 being an era dominated by denim, you could stock up on as much fashion as you desired. A pair of jeans cost approximately $30, so with $80,000, you could flaunt a staggering 2,666 pairs of jeans—a wardrobe reflecting the quintessential style of the 80s!

The 1980s Housing Market: A Lesson in Perspective

Reflecting on the average cost of a house in 1980 can be both shocking and enlightening. It serves as a poignant reminder of how much societal values evolve over time, influencing everything from financial choices to lifestyle preferences. The economic landscape, complementary interest rates, and the less glamorous desires in housing have all shifted dramatically.

As you listen to your parents fondly recall “the good old days” of affordable housing, remember that nostalgia often glosses over the complexities of those times. The landscape of homeownership has transformed, presenting new challenges and opportunities. Understanding the past helps us appreciate the progress made and the obstacles that still lie ahead in the ever-changing world of real estate.

Related Articles:

  • Average House Price in 1950 (Compared to Today)
  • Housing Market Graph 50 Years: Showing Price Growth
  • Average Housing Prices by Year in the United States
  • Average Home Value Increase Per Year, 5 Years, 10 Years
  • San Diego Housing Market Graph 50 Years: Analysis and Trends
  • How Much Did Housing Prices Drop in 2008?
  • Housing Market Crash 2008 Explained: Causes and Effects
  • Housing Market Predictions for Next 5 Years
  • Housing Market Predictions for Next Year: Prices to Rise by 4.4%
  • Housing Market Predictions for the Next 4 Years

Filed Under: Housing Market Tagged With: Average Cost of a House, Housing Market

Is Income Property Investment a Smart Investment?

June 1, 2025 by Marco Santarelli

Is Income Property Investment a Smart Investment?

Investing in income properties can be a smart financial move, offering the potential for regular income and portfolio diversification. However, it’s crucial for investors to carefully assess their financial situation and risk tolerance before diving in.

An income property is a real estate property purchased or developed to earn income through renting or leasing it out to others. It can be both commercial and residential and offers an alternative to standard market investments in stocks and bonds, providing the security of real property with many investment diversification benefits.

Is Income Property Investment a Smart Investment?

The Pros of Income Property Investment:

  • Steady Cash Flow: If managed well, income properties can provide a steady stream of cash through rental income.
  • Appreciation Potential: Over time, real estate typically appreciates in value, potentially increasing your net worth.
  • Tax Benefits: Real estate investors can benefit from various tax deductions related to property ownership and operations.

The Cons of Income Property Investment:

  • Market Risks: Like any investment, income properties are subject to market conditions, interest rates, and housing market fluctuations.
  • Management Responsibilities: Income properties require active management, including dealing with tenants and maintaining the property.
  • Financial Commitment: Investors must have the financial stability to cover maintenance, repairs, and vacancies.

It's important to note that while income properties may generate income, owners should consider the risks, including disruptive tenants and the costs to maintain the property. A financial cushion is advisable to cover unexpected expenses such as property taxes and utilities.

Investing in real estate for income requires a broad range of considerations. Determining a base rate of income to rentals is often important to ensure the desired rate of return. This involves analyzing the current rental rate on similar properties in the area while factoring in the monthly payments required for the mortgage.

The real estate market can be deceptive; low mortgage rates and a buyer's market do not necessarily mean it's the best time to invest. Investors must consider broader economic factors, such as employment rates, which can affect the ability of tenants to pay rent and the overall demand for rental properties.

For those who already own income properties, it can be a landlord's market, with investors potentially faring better than others in the current economic climate. However, the success of such investments heavily depends on the investor's ability to manage the property effectively and navigate the complexities of the real estate market.

Common Mistakes to Avoid in Income Property Investment

1. Lack of Planning: One of the most critical steps in property investment is to have a clear plan. Without a strategy, it's easy to make decisions that don't align with long-term goals, leading to potential financial setbacks.

2. Insufficient Market Research: Understanding the market is paramount. This includes knowing the area where you're investing, the demand for rental properties, and the standard pricing. Skipping this step can lead to overpaying for a property or investing in an area with little growth potential.

3. Chasing Short-Term Gains: Property investment is generally a long-term endeavor. Aiming for quick returns can result in poor decision-making and may not yield the desired financial results.

4. Overpaying: Ensure you pay a fair price for a property. Overpaying can hinder your return on investment and put you at a financial disadvantage from the start.

5. Underestimating Expenses: It's essential to account for all potential expenses, including maintenance, repairs, and vacancies. Failing to do so can lead to cash flow problems.

6. Neglecting Tenant Quality: Securing reliable tenants is crucial for steady rental income. Not screening tenants thoroughly can lead to issues such as late payments or property damage.

7. Ignoring Property Management: Managing a property takes time and effort. Underestimating the work involved can lead to property neglect and dissatisfied tenants.

8. Failing to Diversify: Relying on a single income property or market can be risky. Diversification helps mitigate risk and can provide more stable returns.

9. Not Understanding Financing Options: Different financing methods come with various terms and obligations. Not fully understanding these can lead to unfavorable loan conditions.

10. Emotional Decision Making: Investing in property should be a decision based on facts and figures, not emotions. Emotional attachments can cloud judgment and lead to poor investment choices.

By avoiding these common mistakes, investors can improve their chances of success in the income property market. Thorough research, careful planning, and a clear understanding of the market are the keys to making informed decisions and achieving your investment goals.

Bottom Line: Income property investment can be a smart investment if approached with caution, thorough research, and a clear understanding of the associated risks and responsibilities. It's not a one-size-fits-all solution and should be considered as part of a broader investment strategy tailored to individual financial goals and circumstances. For more detailed insights and guidance, it's advisable to consult with financial and real estate professionals before making any investment decisions.

Why Income Property Is Still One of the Smartest Investments

With market volatility and inflation concerns, income properties offer predictable cash flow and long-term appreciation.

Norada Real Estate Investments specializes in turnkey rental homes in markets poised for growth—helping you build passive income without the guesswork.

HOT NEW LISTINGS JUST ADDED!

Talk to a Norada investment counselor today (No Obligation):

(800) 611-3060

Get Started Now 

Read More:

  • Best Real Estate Markets for New Investors to Watch in 2025
  • Best Places to Invest in Single-Family Rental Properties in 2025
  • How to Find Investment Properties for Sale?
  • 10 Reasons Why Real Estate is a Prudent Investment
  • Cheap Investment Properties: How to Find Them?

Filed Under: Housing Market, Real Estate Investing Tagged With: Housing Market, income property investment, Investment Property, real estate, Real Estate Investing

  • « Previous Page
  • 1
  • …
  • 5
  • 6
  • 7
  • 8
  • 9
  • …
  • 76
  • Next Page »

Real Estate

  • Birmingham
  • Cape Coral
  • Charlotte
  • Chicago

Quick Links

  • Markets
  • Membership
  • Notes
  • Contact Us

Blog Posts

  • Is Your Money Safe in the Bank in 2025?
    July 3, 2025Marco Santarelli
  • Will the Cape Coral Housing Market Repeat the Crash of 2008?
    July 3, 2025Marco Santarelli
  • Today’s 5-Year Adjustable Rate Mortgage Soars to 7.73% – July 3, 2025
    July 3, 2025Marco Santarelli

Contact

Norada Real Estate Investments 30251 Golden Lantern, Suite E-261 Laguna Niguel, CA 92677

(949) 218-6668
(800) 611-3060
BBB
  • Terms of Use
  • |
  • Privacy Policy
  • |
  • Testimonials
  • |
  • Suggestions?
  • |
  • Home

Copyright 2018 Norada Real Estate Investments

Loading...