If you’re spending more than 30% of your gross monthly income on living expenses, you might be what’s known as “house poor.” A recent survey by HomeTap found that nearly 20% of U.S. homeowners feel like their monthly housing costs impede their ability to achieve other financial goals most of the time, and an overwhelming 73% feel it some of the time.
What is house poor?
House poor is a term used to describe a homeowner or renter who spends so much on housing that they can’t afford much else. Financial advisors recommend spending no more than 30% of your gross monthly income on housing expenses. These expenses include your monthly mortgage payments, homeowner's insurance, and any other unexpected costs that may arise (such as a broken air conditioner).
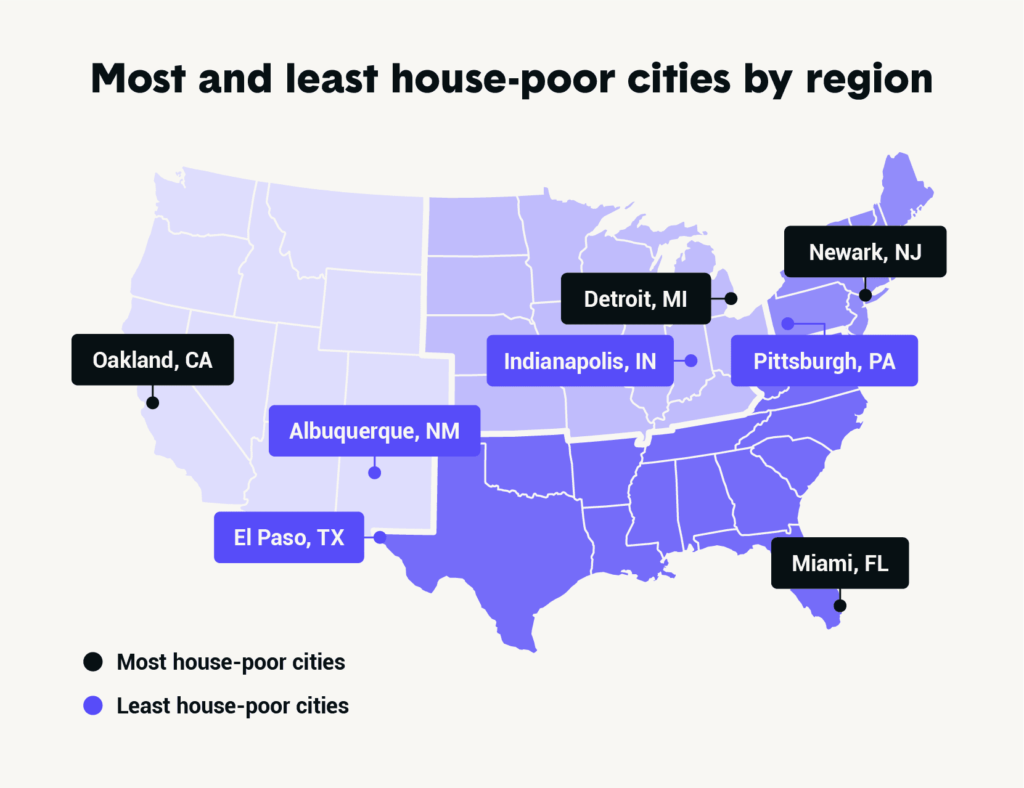
Because location plays such a big role in housing costs, take a look at the numbers to see where homeowners are spending the most and least in housing costs by region. A comparison was made on the median home price, the median household income, and the homeownership rates of the 100 most populous U.S. cities in our study
Check results below per region:
In order to determine the most and least house poor cities by region, The Zebra compared a sample of the 100 most populated U.S. cities. The sample for overall most and least house poor cities excluded cities in the surrounding metro area.
Each city was rated on a sliding scale based on these three factors:
- Median home price – 45 points
- Median household income – 45 points
- Homeownership rate – 10 points
The calculations revealed cities with the largest gap in median household income compared to median home price were the most house poor cities in the nation. It was also found that cities with more affordable housing had a higher ownership rate, as did cities with higher median household incomes.
Data: https://docs.google.com/
Link to study: https://www.thezebra.com/