Norada Real Estate Investments

  • Home
  • Markets
  • Properties
  • Membership
  • Podcast
  • Learn
  • About
  • Contact

Young Buyers Set to Transform the Housing Market in 2025

October 3, 2024 by Marco Santarelli

Young Buyers Set to Transform the Housing Market in 2025

It’s an exciting time for the housing market next year! An influx of young people is set to make waves as they eagerly step into homeownership. With mortgage rates gradually trending lower, this could be the perfect storm to spark a homebuilding boom.

According to Business Insider, industry expert Phillip Ng, a senior analyst at Jefferies, believes the construction and building materials sector could experience a significant boost. The anticipation of a fresh wave of young homebuyers is not just optimistic thinking; it's grounded in economic trends, and it’s definitely worth discussing.

Young Buyers Set to Transform the Housing Market in 2025

Key Takeaways

  • Mortgage Rates: Expected to lower, easing the cost of borrowing.
  • Young Buyers: A wave of millennials and Gen Z are looking to buy homes.
  • Construction Boom: Increased demand will lead to a surge in homebuilding.
  • Underbuilt Market: Current housing supply has not kept up with demand.
  • Forecasts: New home sales are predicted to rise by 14% in 2024.

Over the last few years, the housing market has been a tricky maze for buyers, especially young ones who are just starting to explore their options. High prices and elevated mortgage rates have restrained potential buyers. Many established homeowners are reluctant to sell their properties, clinging to the lower interest rates they locked in during the past years. This phenomenon is known as the “lock-in” effect. Despite this, the horizon looks brighter, as analysts predict that young Americans are poised to enter the housing market in larger numbers next year.

Phillip Ng, from Jefferies, remains optimistic about the upcoming shift in the housing landscape. In a recent interview with CNBC, he revealed his excitement about 2025, stating, “The housing market's been massively underbuilt. We've got a wave of young people that are going to be buying homes.” With predictions of continued declines in mortgage rates, the affordability crisis might finally ease, leading to an uptick in construction activity.

In the current housing market, existing homeowners often enjoy lower mortgage rates, allowing them to stay put rather than sell. Data from Redfin shows that about 89% of existing homeowners have a mortgage rate below 6%. This creates a challenging atmosphere for new homebuyers because fewer listings mean stiff competition for available properties. However, with expectations that mortgage rates may drop further, the stage is set for a more vibrant buying environment.

The Role of Mortgage Rates in the Housing Market Next Year

The 30-year fixed mortgage rate currently fluctuates around 6.35%, nearing its lowest level since early 2023, according to Freddie Mac. If mortgage rates can drop further, buyers may feel less hesitant to enter the market. Forecasters predict that a combination of factors, including rising affordability and increased demand from younger buyers, will lead to a significant lift in housing activity.

The National Association of Realtors projects that new home sales might increase by a remarkable 14% in 2024. With a growing number of younger buyers ready to make their mark, builders are optimistic about ramping up construction. In fact, the market is already witnessing a trend where new homes account for one out of every three properties for sale.

Despite the recent challenges, the homebuilding industry appears to be on a roll. Builders have raced to increase inventory due to a prolonged supply shortage. In July, there were approximately 7.5 months worth of new housing supply available, which is a promising sign for both builders and buyers alike. Strong demand, coupled with stable pricing for building materials, is driving this surge in new home construction.

Demand Dynamics Shape the Future of Homebuilding

The interaction between young people's ambitions and housing supply creates a fascinating dynamic. As more millennials and members of Gen Z prepare to make their homeownership dreams a reality, it creates a strong demand for residential properties. This demand is welcomed by builders who are eager to meet it. As Ng highlighted, while the construction and building materials markets have faced ups and downs, the overall tone for new projects is positive.

Builders have been positively influenced by rising home prices, which have been booming in many regions. The increasing costs of homes reflect heightened buyer interest, particularly from the younger demographics looking for their first home. Lower rates not only improve affordability for buyers, but they also give builders the necessary confidence to invest in new projects. As home prices remain high, builders are also keeping a close watch on building material costs. While the price of lumber has seen a decline over the past year, other costs have remained stable, allowing builders to maintain profitability.

However, it’s important to acknowledge that some uncertainties remain. Housing experts caution that while mortgage rates may decrease, they could still hover above the 6% threshold by the end of 2024. This lingering uncertainty might affect the speed with which young buyers enter the market. Still, the downward trend of mortgage rates and the excitement of new buyers present a favorable scenario for the construction sector.

Sector Impacts and Opportunities Ahead

The potential homebuilding boom anticipated next year does not only signify benefits for builders and new homeowners but also points to wider economic growth. An increase in construction activity leads to job creation, stimulates local economies, and can significantly aid in alleviating the existing housing supply crisis.

For many young buyers aspiring to enter the housing market next year, homeownership represents a significant life milestone. It is their chance to invest in a stable future, create a sense of belonging, and build wealth. The upcoming wave of purchases could shift the market dynamics, allowing new generations to finally break into homeownership after years of delays due to affordability constraints.

As the housing market prepares for this influx of youthful buyers, the ripple effect of this increased activity is likely to touch various facets of the economy. From real estate agents to furniture stores, many sectors will benefit and see increased interactions with young homeowners who are ready to fill their new spaces.

In conclusion, as we gaze into the future of the housing market next year, it’s clear that optimism abounds. With an influx of young people looking to buy homes and favorable conditions around mortgage rates and building materials, we could soon witness a revitalization in the housing sector. The anticipation that accompanies these predictions suggests that the coming years might not only fulfill the dreams of new homeowners but also pave the way for a more robust, resilient housing market.

FAQs

1. What is a buyer's housing market?

A buyer's housing market occurs when there is an increase in the number of homes for sale compared to buyers looking to purchase. This often leads to reduced competition among buyers, giving them more negotiating power regarding prices and terms.

2. Why are mortgage rates dropping?

Mortgage rates can drop due to various economic factors, including changes in the Federal Reserve's interest rate policies, overall economic conditions, and inflation rates. Recently, the Fed cut rates, which often leads to lower mortgage rates for homebuyers, making borrowing less expensive.

3. How does the influx of young buyers affect the housing market?

The entry of millennials and Gen Z into the housing market is anticipated to increase demand for homes. This surge may result in a more competitive environment, but it can also motivate builders to increase new construction to meet the demand.

4. What are the current trends in home prices?

While the median price of homes has seen a slight dip, the price per square foot has increased, indicating that buyers may be getting less value for every dollar spent. This trend shows that high demand continues to keep some upward pressure on prices, particularly in sought-after areas.

5. How can homeowners benefit from the current market conditions?

Homeowners looking to sell may benefit from a larger number of potential buyers who are eager to purchase, especially if they have properties in high-demand areas. They could price their homes competitively to attract buyers looking for the best deals.

Also Read:

  • A Buyer’s Housing Market Might Be Around the Corner
  • Why Falling Mortgage Rates Won't Make Much Impact for Buyers
  • First-Time Home Buyer Government Programs: Guide for Buyers
  • 5 Mistakes First-Time Homebuyers Make (and How to Avoid Them)
  • Why Are Houses So Expensive in 2024: Trends and Economic Influences
  • Housing Market Predictions for the Next 4 Years: 2024 to 2028
  • Real Estate Forecast Next 5 Years: Top 5 Predictions for Future

Filed Under: Housing Market, Real Estate Market Tagged With: Home Price Forecast, Housing Market, housing market predictions, Housing Market Trends, Real Estate Market Predictions

A Buyer’s Housing Market Might Be Around the Corner

October 3, 2024 by Marco Santarelli

A Buyer’s Housing Market Might Be Around the Corner

Imagine standing in a busy marketplace filled with eager shoppers, each person searching for the best deals and hidden gems. This bustling activity can feel much like the housing market, which has seen a mix of excitement and frustration over the past few years. Now, exciting changes are on the horizon. A buyer’s housing market might be around the corner thanks to a surge in new listings and falling mortgage rates. This combination of factors could be a game-changer for people hoping to buy homes soon.

A Buyer’s Housing Market Might Be Around the Corner

Key Takeaways

  • A Buyer’s Market: The possibility of a buyer's housing market emerging is becoming more likely due to an increase in home listings and lower mortgage rates.
  • Inventory Surge: According to Realtor.com, in September, homes newly listed for sale skyrocketed by 34% compared to last year.
  • Regional Variations: The South and West saw the highest increases in listings, some areas in Florida seeing rises of up to 74%.
  • Price Trends: Although the median price of homes dipped slightly, the price per square foot has risen, suggesting changing value dynamics.
  • Longer Selling Times: Homes are taking longer to sell, suggesting a shift in market dynamics as more listings become available.

Understanding the Shift in The Real Estate Market

The real estate landscape has experienced significant ups and downs over the past few years. Initially characterized by soaring prices and a tough market for buyers, the tide is starting to turn. A recent report from Realtor.com® signals that the fall housing market is gaining traction, with September witnessing an impressive 11.6% increase in new home listings over last year**. This surge marks a three-year high and brings a wave of optimism as falling mortgage rates and the Federal Reserve’s recent rate cuts give potential buyers hope.

Ralph McLaughlin, an economist at Realtor.com, notes that the so-called “lock-in effect” — where homeowners hesitated to sell their homes due to high mortgage rates — is finally easing. The Federal Reserve's decision to cut rates by 50 basis points has allowed some buyers who have previously held back to reenter the market. This resurgence is pivotal as buyers will have not only more options but potentially better deals since they can now afford to buy without being crippled by high rates.

Where Are the Listings Increasing?

While many are excited about the increase in inventory, it’s important to remember that these changes impact different regions unequally. The surge in newly listed homes has primarily been a highlight in expensive markets, where sellers benefit more from the savings associated with lower mortgage rates. For example, Seattle, Washington, DC, and San Jose, California are experiencing notable growth rates in new listings of 41.8%, 30.4%, and 27.1%, respectively.

McLaughlin highlights that higher-priced homes yield larger savings, which could explain why sellers in these metro areas are more inclined to list their homes now. Homebuyers in these cities stand to gain more financially, motivating more individuals to consider moving out of their current homes.

For instance, while a family may be hesitant to sell in a lower-priced market, they might find it worthwhile in an area where they can save significantly on a new mortgage. This has opened the door to opportunities across the housing spectrum, encouraging buyers who may have put their plans on hold amid uncertainty.

Furthermore, the South region is witnessing the most substantial increases in listings overall, making it an attractive destination for homebuyers. From Tampa to Miami to Jacksonville, cities report mind-blowing increases of up to 74% in new listings compared to the previous year. Such growth reveals a significant market shift, indicating a growing sense of urgency among buyers to take advantage of available listings before any further changes occur.

Overall Market Conditions and Home Prices

While the reported increases in inventory are noteworthy, it’s crucial to recognize that current listing levels still lag behind those seen before the pandemic. Homes listed this September are 23.2% fewer compared to the average inventory levels observed from 2017 to 2019, suggesting that while buyers have more options, the market isn’t entirely recovering to its pre-pandemic norm.

In terms of prices, there is a mixed picture unfolding. The median sale price of homes dropped by nearly $5,000 from August to September, moving from $429,500 to $425,000. This might seem like good news for prospective homeowners, but the price per square foot has increased by 2.3%. This growth indicates that while overall prices have dipped, buyers might be receiving less value for every dollar spent.

For instance, consider homebuyers comparing similar properties. Despite the drop in the median price, their purchasing power may not be as strong as it seems, given that the cost per square foot has risen significantly over the past few years. A deeper look into historical trends shows that price per square foot has surged by 50.8% since September 2019, which means buyers may still face challenges with affordability.

Market Dynamics: Fewer Days on the Market

As more homes come onto the market, a notable trend is emerging: homes are taking longer to sell. Data reveals that homes spent an average of 55 days on the market in September, a slight increase from 53 days in August. While this is the slowest selling rate for September in five years, it is worth remembering that homes are still turning over quicker than they did during the pre-pandemic era, when averages reached around 62 days.

This gradual increase in selling times may indicate a shift where buyers are becoming more selective due to the expanded inventory. With so many options available, potential buyers can afford to wait longer and carefully evaluate which homes best meet their needs and financial resources. This trend allows buyers to strategize their purchases carefully rather than rushing into decisions that they may regret later.

Regional Snapshots: The Difference Across Geography

To paint a clearer picture of how the current trends impact various locations, let’s take a regional snapshot:

  • The South: This area has recorded the most significant changes, with listings increasing by 42% compared to last year. In cities such as Tampa, the increase in listings is remarkable, making it a hotspot for buyers seeking opportunities.
  • The West: Although still noteworthy, the West has seen a lower increase in listings at about 36.5%. However, areas like California continue to rank among the highest in terms of housing value, keeping interest levels high despite the competitive nature of the market.
  • The Northeast and Midwest: These regions experienced more modest increases at 14.8% and 22.3%, respectively. While the growth may not be as pronounced, it still signifies a movement toward a more balanced market.

This breakdown illustrates the various dynamics at play within the housing market, highlighting how sellers and buyers are responding differently within their respective regions.

Price Cuts and Purchasing Power

In addition to increased listings, there has also been an uptick in price reductions. Currently, about 18.4% of all listings feature price cuts, which represents an increase compared to the previous year. While price cuts might seem like positive news for buyers, indicating flexibility on the part of sellers, it’s still essential to view this trend within the broader context of the market.

Despite the presence of price cuts, the housing market has managed to maintain stability overall. McLaughlin notes that “while market speed moved at the slowest rate for a September since 2019, buyers have been engaged just enough to keep prices from falling.” Interestingly, this balance suggests that while buyers are more cautious, they still remain engaged in the process and willing to act when they see suitable opportunities.

Summary:

In summary, the spectrum of recent changes in the housing market indicates that a buyer’s housing market might be around the corner. Thanks to a notable increase in inventory, optimism surrounding lower mortgage rates, and fluctuating home prices, it appears that buyers may soon find themselves in a more favorable environment. While challenges remain and market dynamics continue to evolve, the current trends across various regions present hopeful signs for prospective homeowners who have been patiently waiting for the right time to enter the market.

Recommended Read

  • Young Buyers Set to Transform the Housing Market in 2025
  • Why Falling Mortgage Rates Won't Make Much Impact for Buyers
  • First-Time Home Buyer Government Programs: Guide for Buyers
  • 5 Mistakes First-Time Homebuyers Make (and How to Avoid Them)
  • Why Are Houses So Expensive in 2024: Trends and Economic Influences
  • Housing Market Predictions for Next Year: Prices to Rise by 4.4%
  • Housing Market Predictions for the Next 4 Years: 2024 to 2028
  • Real Estate Forecast Next 5 Years: Top 5 Predictions for Future
  • Real Estate Market Predictions 2025: What to Expect

Filed Under: Housing Market, Real Estate Market Tagged With: Home Price Forecast, Housing Market, housing market predictions, Housing Market Trends, Real Estate Market Predictions

Alabama Housing Market Forecast 2025-2026: Insights for Buyers

October 2, 2024 by Marco Santarelli

Alabama Housing Market Forecast

Looking ahead to 2025, Alabama's housing market is kind of a mixed bag – good news and bad news. House prices are expected to go up a little across the state, but some areas will do much better than others. Some might even see prices drop. This is really important information for anyone thinking about buying, selling, or investing in Alabama real estate. It'll change how people make decisions in the market.

While Alabama has lots of different housing choices, places like Huntsville and Mobile look especially promising. Huntsville is expected to bounce back after a small dip, and Mobile should stay pretty steady, even if there are a few ups and downs.

Alabama Housing Market Forecast 2025-2026: Insights for Buyers

  • Average Home Value: Currently stands at approximately $228,102, reflecting an increase of 1.4% over the past year.
  • Median Sale Price: As of July 31, 2024, the median sale price is $249,167, which demonstrates a solid market stance.
  • Median List Price: By August 31, 2024, the median list price has varied to $306,633.
  • Sales Trends: Around 21.8% of sales went for over the list price while 56.2% sold below list price in July 2024.
  • Regional Differences: Varied forecasts across Alabama indicate growth in some areas while others face potential declines.

Key Highlights

Average Home Value in Alabama: $228,102 (1.4% annual increase – Zillow)

Median Sale Price: $249,167 (as of July 2024)

Median List Price: $306,633 (as of August 2024)

Regions on the Rise

Region Forecasted Growth by 2025
Huntsville 1.2%
Daphne 1.1%
Florence 1.5%

Regions Facing Challenges

Region Forecasted Decline by 2025
Birmingham 0.2%
Montgomery 0.3%
Tuscaloosa 0.8%

Overall Market Sentiment

Sales Trends: 21.8% of sales above list price; 56.2% below list price (as of July 2024).

Market Outlook: Continued moderate growth expected with varying regional performance. 

Current State of the Alabama Housing Market

As of now, Alabama's housing market is experiencing a phase of stability with light growth amid fluctuating buyer behavior. The average home value of $228,102 signals ongoing appreciation, primarily due to steady demand amidst increasing inventory. Interestingly, homes in Alabama are finding buyers quickly—with an average pending time of 22 days. The diversification of the economy in key cities like Birmingham, Huntsville, Montgomery, and Mobile plays a crucial role in this stability.

Despite the overall positive trajectory, there is a notable dichotomy between different market responses. The state's real estate market has seen around 21.8% of homes going under contract above their list prices, indicating competitiveness among buyers. Conversely, 56.2% of homes sold below list prices reveal that many sellers are adjusting expectations based on current market realities.

Regional Forecasts Until 2025

Focusing on regional forecasts provides insight into the Alabama housing market's future. Some MSAs exhibit promising growth, while others could face contractions. Below is an in-depth analysis of several key regions:

Birmingham, AL

  • Forecast: A 0.2% decline is expected by September 2024, which may deepen to 0.6% over the following months, stabilizing back to 0.2% by August 2025 (Zillow).
  • Market Sentiment: The Birmingham market is rich but faces pressure from high inventory levels and economic adjustments. The city's diverse economic base, including healthcare and education sectors, is expected to mitigate severe downturns, although short-term fluctuations remain a concern.

Huntsville, AL

  • Forecast: Following a 0.3% decline in late 2024, Huntsville is projected to rebound with 1.2% growth by August 2025. This recovery is attributed to continued population growth and a booming tech industry.
  • Market Insights: Huntsville's unique economic strengths make it an attractive location for newcomers, sustaining robust housing demand despite minor short-term price corrections.

Mobile, AL

  • Forecast: Homes in Mobile may see a slight decline of 0.1% through November 2024, followed by a 0.7% increase by mid-2025.
  • Community Dynamics: Mobile's economic recovery efforts and growing job market help stabilize home prices, and even with predicted declines, the outlook for recovery remains positive.

Montgomery, AL

  • Forecast: Montgomery's market may experience a dip with estimates indicating 0% growth for September 2024 and 0.5% declines thereafter.
  • Economic Factors: While the state capital has solid fundamentals, the challenges facing its housing market stem from fewer buyers entering the market, causing sellers to adjust their expectations accordingly.

Tuscaloosa, AL

  • Forecast: The forecast anticipates consistent downturns, predicting 0.2% drop by September 2024 through to 0.8% decline by mid-2025.
  • Implications: The reliance on university business can create volatility as demand fluctuates with student enrollment cycles, adding pressure to the real estate market.

On the Horizon: Other Notable Areas

  • Daphne and Florence show potential for growth with 1.1% and 1.5% increases respectively by August 2025, reflecting localized economic resilience.

Will Home Prices Drop in Alabama? Will It Crash?

The question of whether Alabama’s home prices will drop significantly or crash entirely can evoke concern among potential buyers and sellers. According to various forecasts and expert opinions, it seems unlikely that Alabama will face a drastic downturn. While several regions, such as Montgomery and Tuscaloosa, show signs of declines, this does not equate to an overall market collapse.

The state maintains a degree of balance with many areas, particularly Huntsville and Mobile, anticipated to outperform the broader trends. Economic growth, workforce increases, and ongoing community developments should continue to underpin the market. Moreover, Alabama's housing market does not show signs of the excessive speculation seen in past cycles, which often preceded significant downturns.

Alabama Home Price Forecast for 2026

Expectations for the Alabama housing market in 2026 remain hopeful but varied across regions. Sustained economic growth, particularly in technology and industrial sectors, could push property values in Huntsville towards 2-3% increases, making it a hot spot for investments. In contrast, cities that struggle with economic stagnation, like Montgomery, may continue facing price pressures, with forecasts of slight declines possibly extending into 2026.

As cities adapt to evolving economic realities, additional housing initiatives or infrastructure developments could substantially influence these forecasts. If real estate agencies and local governments effectively stimulate the housing market, optimism will likely prevail beyond 2025.

My Opinion on the Alabama Forecast

In my opinion, while several regions face challenges, those like Huntsville and Mobile provide fertile ground for investment. With growing industries and increasing populations, these areas are likely to reward investors and homeowners in the long run. Recognizing the patterns in other regions allows market participants to calibrate their strategies effectively.

Conclusion

In summary, as we delve into the intricacies of the Alabama housing market forecast 2025, the outlook reveals a blend of opportunities and contingencies. Factors such as localized economic conditions play a crucial role in shaping the real estate landscape, indicating that stakeholders should remain aware of market dynamics. While some regions may struggle, others show substantial promise, presenting rich opportunities for savvy investors and engaged homebuyers alike.

Recommended Read:

  • 10 Best Places to Live in Alabama
  • Top 20 Most Dangerous Cities in Alabama: High Crime Index
  • Montgomery Housing Market Trends and Forecast 2024-2025
  • Mobile, AL Housing Market Trends and Predictions 2024
  • Birmingham AL Housing Market 2024: Trends and Forecast

Filed Under: Growth Markets, Housing Market Tagged With: Alabama, Home Price Trends, Housing Market, housing market predictions

Worst Economic Crisis in US History: Great Depression & Beyond

October 2, 2024 by Marco Santarelli

Worst Economic Crisis in US History: A Look at the Great Depression & Beyond

Remember the stories your grandparents told about times being so tough they had to use a potato as a toy? Those tales might have been about the worst economic crisis in US history: The Great Depression.

But hold on! Was that really the worst crisis we've ever faced? Buckle up as we dive deep into the history of economic downturns in the US, exploring the ups and downs of our financial past. We'll break down complex economic jargon into simple terms everyone can understand.

The Worst Economic Crisis in US History

The Great Depression: A Defining Moment in US History

The Great Depression, spanning from 1929 to the late 1930s, remains etched in the minds of many Americans. This period wasn't just a “bad week” for the economy; it was a decade-long struggle that touched every corner of American life.

Imagine this:

  • Businesses closing left and right: One minute your dad worked at the local factory, the next, it's shut down.
  • Banks failing: People lost all their savings because the banks just… disappeared.
  • Unemployment skyrocketing: Finding a job was like finding a needle in a haystack – nearly impossible.

What caused this massive economic earthquake? Historians point to a few key tremors:

  1. The Stock Market Crash of 1929: Imagine a giant bubble. People kept pouring money into the stock market, making the bubble bigger and bigger. Then, poof – the bubble burst, causing widespread panic and selling. This event, known as Black Tuesday (October 29, 1929), is often seen as the start of the Great Depression.
  2. Overproduction and Underconsumption: Factories were churning out products, but people didn't have enough money to buy them. This imbalance created a domino effect, leading to businesses shutting down and people losing their jobs.
  3. The Dust Bowl: As if things weren't tough enough, a severe drought hit the Midwest in the 1930s. Crops failed, dust storms raged, and farmers were forced to leave their land in search of work. This ecological disaster further deepened the economic woes of the nation.

The Great Depression was more than just numbers on a chart. It was a time of immense hardship, forcing Americans to adapt, innovate, and rely on each other for support. It led to major changes in government policies, including the creation of Social Security, designed as a safety net for vulnerable populations.

Other Notable Economic Crises in US History

While the Great Depression casts a long shadow, other economic crises have also shaken the US:

  • The Panic of 1873: This crisis, sparked by the failure of a major investment firm, ushered in a period of economic decline known as the Long Depression.
  • The Panic of 1907: This crisis, also triggered by bank failures, highlighted the need for a centralized banking system in the US, eventually leading to the creation of the Federal Reserve in 1913.
  • The Recession of 1980-1982: High inflation and rising oil prices led to a severe recession, marked by high unemployment and economic stagnation.
  • The Great Recession of 2008-2009: Remember the housing bubble? This crisis was triggered by a collapse in the housing market, leading to a global financial meltdown.

So, Was the Great Depression Really the Worst?

It's tough to definitively crown any single economic crisis as the absolute “worst.” Each downturn has its unique set of triggers, consequences, and long-term impacts. While the Great Depression holds a significant place in US history due to its duration and severity, the Great Recession also brought about its own set of challenges, particularly for the housing market and the financial industry.

However, the Great Depression stands out for a few reasons:

  • Unprecedented Unemployment: The unemployment rate peaked at a staggering 25% during the Great Depression, meaning one in four Americans were out of work.
  • Prolonged Duration: The Great Depression lasted for an entire decade, leaving deep scars on the economy and the lives of millions.
  • Global Impact: The Depression wasn't just a US phenomenon. It had a ripple effect across the globe, impacting international trade and contributing to political instability.

Lessons Learned and the Path Forward

Economic crises, like those we've discussed, serve as stark reminders of the importance of:

  • Financial Regulation: Putting rules in place to prevent excessive risk-taking and protect consumers.
  • Economic Diversification: Not putting all our eggs in one basket and relying on a variety of industries.
  • Social Safety Nets: Ensuring that support systems like unemployment insurance and food assistance are in place to help those impacted by economic downturns.

By studying past economic crises, we can learn from our mistakes, adapt our strategies, and hopefully, mitigate the impact of future economic challenges.

Recommended Read:

  • How Strong is the US Economy Today in 2024?
  • Economic Forecast: Will Economy See Brighter Days in 2024?
  • Will the Economy Recover in 2024?
  • Economic Forecast for Next 10 Years
  • Economic Forecast for the Next 5 Years
  • How Close Are We to Total Economic Collapse?

Filed Under: Economy Tagged With: Economy

Cheapest Cities to Buy a House in California in 2024

October 2, 2024 by Marco Santarelli

Cheapest Cities to Buy a House in California

So, you're dreaming of California living, but the hefty price tags are giving you sticker shock? Don't worry, you're not alone! Finding the cheapest cities to buy a house in California in 2024 is a quest many share. While California's housing market is famously competitive, there are still some surprisingly affordable options out there if you know where to look. This in-depth guide will reveal some of the most budget-friendly locations, offering insights that might just make your California dream a reality.

Why is Finding Affordable Housing in California So Important?

California's beauty and opportunities draw people from across the nation, creating intense competition for housing. This often leads to inflated prices, particularly in the popular coastal cities and metropolitan areas. But the reality is that many hard-working individuals and families still want to make California their home – and that means finding creative solutions to navigate the challenging housing market. This guide focuses on finding options that might surprise you, focusing on the truly cheapest cities to buy a house in California in 2024.

Understanding the Data: Zillow Home Value Index (August 2024)

All the information presented here is based on the Zillow Home Value Index for August 2024. It’s important to remember that real estate is dynamic – prices change constantly! This data provides a snapshot, and it's always a good idea to verify prices with local real estate agents for the most up-to-date information before making any decisions.

I've personally spent years analyzing California's real estate market, and I can tell you that even within these “cheapest” cities, you’ll find variations in prices based on lot size, property condition, and location within the city itself.

The Top 10 Cheapest Cities to Buy a House in California

Here's a closer look at the ten cheapest cities to buy a house in California in 2024, based on the data:

City Name State County Name Home Price August 2023 Home Price August 2024
Trona CA San Bernardino County $51,147 $55,293
Johannesburg CA San Bernardino County $99,452 $99,835
Herlong CA Lassen County $113,157 $113,913
Macdoel CA Siskiyou County $129,315 $123,221
Dorris CA Siskiyou County $133,351 $134,390
Tulelake CA Modoc County $151,092 $152,424
Yermo CA San Bernardino County $138,469 $155,670
Hinkley CA San Bernardino County $148,571 $160,109
Stirling City CA Butte County $163,632 $160,612
Doyle CA Lassen County $171,180 $163,376

A Deeper Dive into the Cheapest Cities:

Let’s delve a bit deeper into some of these surprisingly affordable California towns. Remember, the data only tells part of the story. Your personal experience will also be crucial.

Trona, CA: The Undisputed Cheapest

Trona consistently emerges as the cheapest city to buy a house in California in 2024, according to Zillow's data. Located in San Bernardino County, it's a small town with a unique history tied to mining. While it offers incredible affordability, potential buyers should be prepared for a more remote lifestyle. Jobs might be limited, and amenities may be less abundant than in larger cities. However, for those seeking a quiet life with a low cost of living, Trona could be a hidden gem.

Estimated Cost of a 3-Bedroom House in Trona: Based on the average home value of $55,293, finding a three-bedroom house in good condition might prove difficult. It's more likely that you'd find smaller homes or fixer-uppers at this price point. Expect to budget for repairs and upgrades.

Johannesburg, CA: A Step Up in Price, but Still Affordable

Johannesburg, also in San Bernardino County, offers a slightly higher average home price compared to Trona. It presents a similar trade-off: affordability versus a remote location with fewer amenities. Similar to Trona, be prepared to potentially find smaller homes or those needing some TLC at the average price point.

Estimated Cost of a 3-Bedroom House in Johannesburg: At an average of $99,835, you'll still likely be looking at smaller homes or houses that require renovation. A larger, newer 3-bedroom might be beyond this price range.

Herlong, CA: Rural Charm with a Higher Price Tag

Herlong, located in Lassen County, marks a significant jump in price from Trona and Johannesburg. While still relatively affordable for California, it's a noticeable shift. This is a smaller, rural community with a different feel. If you enjoy a more isolated, nature-focused lifestyle, Herlong might fit the bill.

Estimated Cost of a 3-Bedroom House in Herlong: At an average of $113,913, you might be able to find a larger, well-maintained 3-bedroom house, depending on the availability of listings.

Macdoel, Dorris, and Other Cities: A Range of Options

The remaining cities in the list – Macdoel, Dorris, Tulelake, Yermo, Hinkley, Stirling City, and Doyle – represent a range of price points and locations across different counties in California. Researching each location individually is key to understanding the specific advantages and drawbacks.

Remember, these prices represent averages. Always consult local real estate agents for current pricing and availability.

Factors to Consider Beyond Just Price:

  • Job Market: Before purchasing a home in any of these cities, research employment opportunities. The availability of jobs will greatly influence your quality of life.
  • Commute: If you'll need to commute to a nearby city for work or other activities, factor in travel time and costs.
  • Amenities: Consider access to healthcare, education, shopping, and other essential services.
  • Community: Take time to explore the community and determine if it aligns with your lifestyle preferences.
  • Climate: California has diverse climates. Research the specific climate of your target city to ensure it suits your needs.

My Personal Thoughts and Advice:

Having worked in California real estate for many years, I can say with certainty that finding the cheapest cities to buy a house in California in 2024 is challenging but not impossible. These cities offer a pathway to homeownership, but it requires thorough research, a willingness to embrace a potentially different lifestyle, and a realistic budget. Never rely solely on online data; connect with local real estate agents for on-the-ground insights.

Conclusion: The California Dream is Still Within Reach

While buying a home in California presents unique challenges, this list demonstrates that finding affordable options is indeed possible. By carefully considering location, budget, lifestyle, and essential factors like employment opportunities, your California dream can still become a reality. Remember to always verify information with local professionals and remain flexible and patient throughout your search.

Recommended Read:

  • 10 Best Places to Live in California for Families in 2024
  • Most Expensive Housing in California as of 2024
  • Cheapest Housing Markets in California: Affordable Cities (2024)
  • Where Can I Buy a House for 300k in California? (2024)
  • California Housing Market Predictions 2025
  • Cheapest State to Buy a House in 2024 is West Virginia
  • 21 Cheapest States to Buy a House: Most Affordable States (2024)
  • 10 Cheapest Places to Live in the United States in 2024

Filed Under: Housing Market, Real Estate Market Tagged With: California housing market, Cheapest Cities to Buy a House in California

Historical Mortgage Rates Since 1950: How Did Rates Change By Year?

October 2, 2024 by Marco Santarelli

Historical Mortgage Rates Since 1950: Rate Trends Over Time

If you are thinking about buying a home or refinancing your current mortgage, you might be wondering how interest rates have changed over time and what factors affect them. In this blog post, we will take a look at the historical trends of mortgage rates in the U.S. from 1950 to 2023.

How Have Mortgage Rates Changed by Year Since 1950?

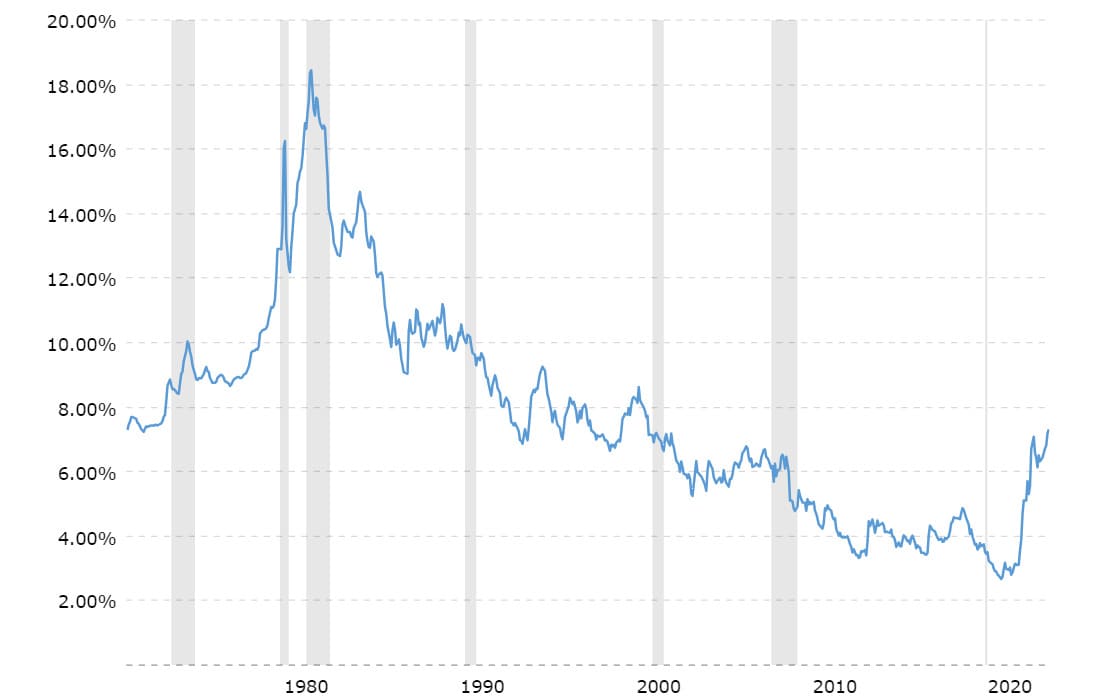
Mortgage rates have fluctuated significantly over time, depending on the changes in the factors mentioned above. According to Freddie Mac's Primary Mortgage Market Survey (PMMS), which tracks the average rates for 30-year fixed-rate mortgages since 1971, mortgage rates have ranged from a record low of 2.65% in January 2021 to a record high of 18.63% in October 1981.

The following chart shows the historical trends of 30-year fixed-rate mortgage rates from 1950 to 2023, based on data from Freddie Mac's PMMS (from 1971 onwards) and Federal Reserve Economic Data (FRED) (from 1950 to 1970).

As you can see from the chart, mortgage rates have gone through several cycles of rising and falling over time, reflecting the changes in the economic and financial conditions.

How Have Mortgage Rates Changed Over Time Since 1950
Source

Historical Mortgage Rate Changes Since 1950

Some of the notable periods of mortgage rate movements include:

The 1950s, when mortgage rates were relatively stable and low, averaged around 4%. This was a period of strong economic growth and low inflation after World War II, supported by government spending on infrastructure, defense, education, and social programs.

The housing market also benefited from favorable policies such as low down payment requirements, long-term amortization schedules, tax deductions for mortgage interest payments, and government-backed mortgage insurance programs.

In the 1960s, mortgage rates started to increase gradually, reaching around 7% by the end of the decade. This was a period of moderate economic growth and rising inflation, driven by increased government spending on social welfare programs, such as Medicare and Medicaid, as well as military spending on the Vietnam War. The housing market also faced some challenges from tighter credit conditions, higher construction costs, and urban unrest.

The 1970s, when mortgage rates soared to double-digit levels, peaking at 12.9% in 1979. This was a period of stagflation, characterized by low economic growth and high inflation, caused by the oil price shocks, the collapse of the Bretton Woods system of fixed exchange rates, and the expansionary monetary and fiscal policies. The housing market also suffered from declining affordability, lower demand, and reduced construction activity.

The 1980s, when mortgage rates reached record highs, hitting 18.63% in 1981, before falling sharply to around 9% by the end of the decade. This was a period of disinflation, marked by a severe recession in the early 1980s, followed by a strong recovery in the mid-to-late 1980s.

The Fed adopted a tight monetary policy to curb inflation, while the government implemented a fiscal policy that combined tax cuts and spending increases. The housing market also experienced a boom-and-bust cycle, with high-interest rates and low affordability in the early 1980s, followed by lower interest rates and higher demand in the mid-to-late 1980s.

The 1990s, when mortgage rates declined steadily, reaching around 6.5% by the end of the decade. This was a period of stable economic growth and low inflation, supported by technological innovations, productivity gains, trade liberalization, and fiscal consolidation. The housing market also enjoyed a sustained expansion, with rising homeownership rates, increasing home values, and robust construction activity.

In the 2000s, the mortgage rates fluctuated within a narrow range of 4.7% to 8.6%, averaging around 6.2% for the decade. This was a period of economic volatility and financial instability, marked by the dot-com bubble and bust in the early 2000s, followed by the housing bubble and bust in the mid-to-late 2000s.

The Fed adopted an accommodative monetary policy to stimulate the economy, while the government implemented various fiscal stimulus measures to mitigate the effects of the recessions.

The housing market also witnessed a dramatic rise and fall, with lax lending standards, speculative demand, and excessive leverage fueling a housing boom in the early-to-mid 2000s, followed by a housing bust in the late 2000s that triggered the global financial crisis.

In the 2010s, the mortgage rates reached historic lows, falling below 3.5% for most of the decade. This was a period of slow economic recovery and low inflation, hampered by the aftermath of the financial crisis, the European debt crisis, the trade war between the U.S. and China, and other geopolitical uncertainties.

The Fed adopted an unconventional monetary policy to support the economy, including quantitative easing (QE), forward guidance, and near-zero interest rates. The housing market also recovered gradually from the crisis, with improving affordability, pent-up demand, limited supply, and favorable demographics boosting home sales and prices.

The 2020s saw the mortgage rates hit an all-time low of 2.65% in January 2021 amid the Covid-19 pandemic, before surging to over 7% in October 2023 amid rising inflation pressures. This was a period of unprecedented economic disruption and policy intervention due to the global health crisis that caused widespread lockdowns, business closures, job losses, and income shocks.

The Fed adopted an emergency monetary policy to provide liquidity and stimulus to the economy, including slashing interest rates to zero, expanding QE programs, launching new lending facilities, and adopting a new framework that allows for higher inflation tolerance.

The government also implemented massive fiscal stimulus measures to provide relief and support to households and businesses affected by the pandemic. The housing market also defied expectations and performed strongly during the pandemic, with record-low interest rates, increased savings rates, shifting preferences for more space and amenities, limited inventory levels, and strong demand from millennials driving home sales and prices to new highs.

How Are Mortgage Rates Determined Over Time?

Mortgage rates are the interest rates that lenders charge borrowers for borrowing money to buy or refinance a home. Mortgage rates are influenced by many factors, such as:

  • The Federal Reserve's monetary policy, which affects the supply and demand of money in the economy. The Fed can raise or lower its target for the federal funds rate, which is the interest rate that banks charge each other for overnight loans. This rate affects other short-term interest rates, such as the prime rate and the London Interbank Offered Rate (LIBOR), which are benchmarks for many consumer and business loans, including some mortgages.
  • The inflation rate, which measures the change in the prices of goods and services over time. Higher inflation erodes the purchasing power of money and reduces the real return on investments. Lenders demand higher interest rates to compensate for the loss of value of their money over time. Conversely, lower inflation increases the real return on investments and reduces the demand for higher interest rates.
  • The economic growth, which reflects the level of activity and income in the economy. Higher economic growth increases the demand for credit and pushes up interest rates, as more people and businesses want to borrow money to invest or spend. Lower economic growth decreases the demand for credit and puts downward pressure on interest rates, as less people and businesses want to borrow money or save more.
  • The supply and demand of mortgage-backed securities (MBS), which are bonds that represent pools of mortgages that are sold to investors. MBS are a major source of funding for mortgage lenders, who use the proceeds from selling MBS to make new loans. The price and yield of MBS are determined by the market forces of supply and demand, which depend on factors such as the quality and performance of the underlying mortgages, the expectations of future interest rates and inflation, and the risk appetite of investors.
  • The creditworthiness of borrowers, which reflects their ability and willingness to repay their loans. Lenders assess borrowers' creditworthiness based on their income, assets, debts, credit history, and other factors. Borrowers with higher credit scores, lower debt-to-income ratios, larger down payments, and more stable income sources are considered less risky and qualify for lower interest rates. Borrowers with lower credit scores, higher debt-to-income ratios, smaller down payments, and less stable income sources are considered more risky and pay higher interest rates.

Filed Under: Financing, Housing Market, Mortgage, Real Estate Tagged With: 30-Year Mortgage Rate Forecast, Mortgage Rates Forecast

How Much Did a 3-Bedroom House Cost in 1970, 1980, 1990, 2000?

October 2, 2024 by Marco Santarelli

How Much Did a 3-Bedroom House Cost in 1970, 1980, 1990, 2000?

Ever wonder what your dream home might have cost decades ago? Thinking about how much did a 3-bedroom house cost in 1970, 1980, 1990, and 2000? is a fascinating journey through time and American real estate. It's a trip that reveals not only price changes but also broader societal shifts, economic trends, and the evolution of home construction itself. This isn't just about numbers; it's about understanding the context behind those numbers and what they tell us about the past and, perhaps, the future.

How Much Did a 3-Bedroom House Cost in 1970, 1980, 1990, and 2000?

The Challenges of Pinpointing Exact Costs

Before we dive into specific numbers, let's address a crucial point: finding precise average prices for a 3-bedroom house across the entire United States for any given year is incredibly difficult. Data collection wasn't as standardized back then as it is now. Furthermore, a “3-bedroom house” in 1970 is drastically different from a 3-bedroom house in 2000.

Location plays a huge role too. A modest 3-bedroom home in rural Iowa in 1970 would have cost significantly less than a similar home in a bustling city like Los Angeles or New York.

What we can do is examine available data from reliable sources and offer a reasonable approximation based on national trends and averages. Remember, these are estimates, not absolute figures, and significant regional variations would exist.

Utilizing Historical Data for Estimating 3-Bedroom House Prices

My approach involves leveraging data from reputable sources like the U.S. Census Bureau, the Federal Housing Finance Agency (FHFA), and historical real estate records where accessible. While these sources won't offer the precise price of a 3-bedroom home in every city or town, they provide valuable national averages and broader trends we can use as a starting point.

Estimating the Cost of a 3-Bedroom House: 1970

Finding concrete data for the average cost of a 3-bedroom house in 1970 is surprisingly tough. Official national averages for home prices weren’t consistently tracked in the same way they are today. However, historical accounts and scattered real estate records suggest that the median price for a home (not necessarily just a 3-bedroom house) across the US was somewhere in the range of $20,000 to $25,000.

Remember, this was a time of simpler homes, often smaller in square footage than what we consider standard today. Many homes built in this era might lack features that are now considered standard, such as central air conditioning or even attached garages.

Keep in mind: This figure needs to be viewed within the context of the overall economic climate of 1970. Inflation and changes in purchasing power play a critical role in understanding the true cost.

A Look at 3-Bedroom Home Costs in 1980

The 1980s ushered in a period of significant economic growth and shifting housing preferences. Based on FHA data and other available sources, the median price of homes in 1980 was considerably higher than in 1970. A reasonable estimate for a 3-bedroom house during this time could be placed between $60,000 and $75,000.

However, remember that various factors influence this price, like the size of the house, location, and amenities. A large home in a desirable suburb would cost substantially more than a smaller one in a rural area.

3-Bedroom House Prices in 1990: Entering a New Decade

By 1990, the real estate market continued its upward trajectory. The median home price was noticeably higher compared to the 1980s. Based on available historical data, we can estimate the cost of a 3-bedroom home in 1990 to be around $90,000 to $120,000.

At this point, the construction standards and home features were generally improved. Many homes boasted features like more modern kitchens and bathrooms. Location remained a major price determinant.

The Turn of the Millennium: 3-Bedroom House Costs in 2000

As we enter the 2000s, we observe a marked increase in home prices, largely due to an influx of buyers and generally robust economic conditions. By 2000, we find ourselves in a different real estate climate. Using data from credible sources, a reasonable estimate for a 3-bedroom house would fall within the range of $150,000 to $200,000.

This was also a time when the size and style of typical 3-bedroom houses were expanding. Many new homes began incorporating more luxurious features and larger living spaces.

Factors Affecting Home Prices Across the Decades

Several factors significantly impacted the cost of a 3-bedroom house across these decades:

  • Inflation: The steady increase in the general price level throughout these years inevitably impacts the cost of homes.
  • Interest Rates: Mortgage interest rates play a huge role in affordability. Lower rates mean more buyers can afford to purchase.
  • Economic Conditions: Booming economies generally lead to higher home prices and vice-versa.
  • Location: This factor always plays a major role. Desirable areas with excellent schools and amenities will always command higher prices.
  • Construction Costs: The cost of building materials and labor fluctuates over time, affecting the final price.
  • Housing Supply and Demand: A limited supply of homes combined with high demand pushes prices upward.

Table Summarizing Estimated 3-Bedroom House Prices

Let's create a summary table of our estimated average 3-bedroom house prices, remembering that these are broad estimations based on available data and should be considered with caution. The data presented is approximate and variations are to be expected.

Year Estimated Price Range for a 3-Bedroom House
1970 $20,000 – $25,000
1980 $60,000 – $75,000
1990 $90,000 – $120,000
2000 $150,000 – $200,000

Inflation Adjustment: A More Accurate Picture

To truly understand the price changes over time, we need to consider inflation. To illustrate this, we'd need to convert the historical prices into today's dollars using an inflation calculator provided by a reputable source like the U.S. Bureau of Labor Statistics (BLS). This provides a far more accurate comparison across the years.

This process requires using the Consumer Price Index (CPI) to determine the equivalent value of a dollar from previous years in current dollars. The results of this adjustment would reflect the real cost of a 3-bedroom house considering the purchasing power at different times. This is essential to accurately compare house prices across the decades.

My Personal Perspective: More Than Just Numbers

As someone who has been closely observing the real estate market for many years, I can tell you these price changes reflect broader social trends. The affordable homes of the 1970s contrasted significantly with the larger, more luxurious homes favored in the 2000s. This speaks volumes about lifestyle changes, economic growth, and societal shifts across the decades.

The fluctuations in home prices also illuminate shifts in the financial markets and the availability of mortgage financing. The price isn't solely determined by building costs; societal and financial dynamics play a crucial role.

Conclusion: The Enduring Allure of the 3-Bedroom House

Understanding how much did a 3-bedroom house cost in 1970, 1980, 1990, and 2000 allows us to gain insights beyond simple numbers. It provides a deeper comprehension of economic trends, changes in family structures, and the evolving American dream of homeownership. While precise figures are hard to definitively pinpoint, the estimated values and insights provided offer a good understanding of the significant price increases and the various influential factors throughout these four decades.

Remember, this information is for educational purposes and should be considered an approximation. For precise figures, you’ll need to consult local real estate records for specific areas.

Related Articles:

  • Average House Prices by State in USA (2024)
  • Average House Price Increase Over Last 30 Years
  • Average House Price in 1950 (Compared to Today)
  • What Will the Average House Price Be in 2040: Predictions
  • Average Cost of a House in 1970, 1990, and 2000
  • Average Cost of a House in 1980
  • Average Housing Prices by Year in the United States
  • Average Home Value Increase Per Year, 5 Years, 10 Years
  • Average Home Appreciation Over 30 Years: How to Calculate?
  • House Price Graph Last 20 Years USA
  • Housing Market Graph 50 Years: Showing Price Growth

Filed Under: Housing Market Tagged With: house prices, Housing Market, How Much Did a 3-Bedroom House Cost

Will the Housing Market Crash in 2025?

October 2, 2024 by Marco Santarelli

Will the Housing Market Crash in 2025?

This year's housing market rollercoaster ride left many wondering: will the housing market crash or rebound in 2025? Home prices will continue to slow down but not drop. However, there is no one-size-fits-all answer to this question, as the housing market in the United States will likely vary depending on location and other factors. While a complete housing market crash in 2025 seems unlikely, a slowdown or correction is more probable. Let's discuss more.

Will the Housing Market Crash in 2025?

💸 No Immediate Crash Expected: Experts largely predict a housing market correction rather than a full-blown crash.

  • 📈 Moderate Declines: Some regions may experience slight price drops, but the overall market is expected to remain stable.
  • 🛠 Inventory Challenges: Continued low housing supply is likely to support prices and prevent a sharp decline.
  • 💰 Interest Rates: High mortgage rates could slow down buyer activity, but not to the point of a market crash.

The housing market experienced a significant boom during the pandemic, fueled by low interest rates and increased demand. However, rising interest rates and economic uncertainties have cooled the market.

Early indicators for 2025 suggest no crash in the housing market but a potential continuation of market stabilization or a gradual cooling. Home price appreciation is expected to moderate compared to the rapid growth seen in recent years.

Additionally, inventory levels may increase, providing more choices for buyers and potentially putting downward pressure on prices in some markets. It's important to note that these are projections, and actual market conditions can vary based on economic factors, interest rate fluctuations, and regional disparities.

Most experts in the housing industry predict less buyer demand, lower prices, and higher borrowing rates. Rate increases, along with a shortage of availability, have pushed many purchasers to the sidelines. So, in 2025, the housing market is likely to be a balancing act on a tightrope but it will not crash.

The Shifting Landscape of the Housing Market for 2025:

  • Interest Rate Rollercoaster: Mortgage rates, the primary driver of demand, are a wild card. Some foresee their descent with economic cooling, while others predict potential hikes due to inflation concerns. This delicate dance will significantly impact buyer affordability and market activity.
  • Inventory Tango: The chronic shortage of homes may finally ease as construction catches up. Increased supply could dampen price growth, leading to a more balanced market, especially in previously overheated areas.
  • Regional Rhythms: Remember, the housing market isn't a monolith. Each region will perform its own unique dance, with factors like local economies, job markets, and population trends influencing prices and buyer behavior.

Possible Scenarios:

  1. The Soft Landing: If interest rates stabilize and inventory gradually increases, we could see a moderation in price growth, with some markets experiencing slight dips. This scenario, akin to a gentle waltz, wouldn't dramatically alter the affordability crisis but could offer a glimmer of hope to aspiring homeowners.
  2. The Tightrope Wobble: A more volatile scenario emerges if a potential recession throws market dynamics into disarray. Sharper price corrections could occur in certain regions, but affordability may not improve significantly due to pre-existing high prices. This tightrope walk requires agility and careful judgment for both buyers and sellers.
  3. The Unexpected Twist: Remember, unforeseen events can throw the market off balance. Geopolitical turmoil, natural disasters, or policy changes could significantly alter the trajectory. This unpredictable tango keeps everyone on their toes, highlighting the need for flexibility and adaptability.

How Likely Is a Housing Market Crash?

While these factors pose risks, it's crucial to note that a crash is not inevitable or imminent. Positive factors supporting the housing market include:

  • Strong Fundamentals: Factors like population growth, household formation, limited land availability, and low vacancy rates create a long-term demand for housing.
  • Improved Lending Standards: Unlike the 2008 crash, the current housing market benefits from improved lending standards, higher credit scores, and more equity in homes.
  • Pent-up Demand: Despite challenges, a large pool of potential buyers, especially among millennials, could enter the market as mortgage rates decline.

ALSO READ: Latest National Housing Market Trends

Top Housing Market Predictions for 2025

Here's when home prices can drop in 2025. While this may appear to be oversimplified, it is how markets work. Prices drop when demand is met. There is now an excessive demand for houses in several property markets, and there simply aren't enough homes to sell to prospective purchasers. Home construction has increased in recent years, although they are still far behind.

Thus, big drops in housing prices would necessitate considerable drops in buyer demand. Demand falls mostly as a result of higher interest rates or a general weakening of the economy. Rising interest rates would ultimately need far less demand and far more housing supply than we now have.

Even if price growth slows this year, a drastic fall in home prices is quite unlikely. As a result, there will be no fall in house values; rather, a pullback, which is natural for any asset class. According to many experts, in the United States, house price growth is forecasted to “moderate” or maybe slightly drop in 2024.

Fannie Mae's recent survey of housing experts offers valuable insights into the future of the housing market, predicting a shift from the breakneck pace of 2023 to a more moderate rhythm in 2024 and 2025. The projected slowdown to 2.4% and 2.7% growth in 2024 and 2025, respectively, marks a significant departure from the anticipated 5.9% surge in 2023.

This reflects the impact of rising interest rates, which have already cooled buyer demand and are expected to continue exerting pressure in the coming year. While some may interpret this as a sign of a housing market crash, the experts' projections paint a more nuanced picture.

  • Moderation, not Meltdown: The deceleration in price growth doesn't necessarily translate to price drops. Instead, it suggests a more balanced market where supply and demand find a middle ground. This could benefit buyers facing affordability challenges in the current red-hot market.
  • Inventory on the Rise: Increased construction activity is slowly chipping away at the chronic shortage of homes, potentially easing competition and putting downward pressure on prices, particularly in overheated markets.
  • Long-Term View: For those planning to hold onto a property for the long haul, short-term fluctuations may matter less. Focusing on fundamentals like location and long-term value can be a wiser strategy than chasing volatile price movements.

A housing market crash would have different implications for homeowners and buyers depending on their situation. For homeowners who plan to stay in their homes for a long time, a temporary decline in home values may not matter much, as long as they can afford their mortgage payments and maintain their equity. However, for homeowners who plan to sell or refinance their homes in the near future, a drop in home values could reduce their net worth and limit their options.

For buyers who are looking for a home, a housing market crash could offer an opportunity to buy at a lower price and with less competition. However, buyers should also be aware of the risks involved in buying a home during a downturn, such as lower income and employment prospects, higher interest rates and closing costs, and negative equity if prices fall further.

The broader outlook from several housing analysts is that housing demand will continue to surge due to several factors. For e.g; the millennials have aged into their prime homebuying years, and they are now the fastest-growing segment of home buyers. In 2018, millennial homeownership was at a record low but the situation has changed markedly. They are no longer holding back when it comes to homeownership.

According to the 2023 Home Buyers and Sellers Generational Trends report from the National Association of Realtors, the demand for homes is increasing among baby boomers, who now make up the largest generation of homebuyers in the US, accounting for 39% of home buyers in 2022, up from 29% in 2021.

On the other hand, younger and older millennials' combined share of homebuyers decreased from 43% in 2021 to 28% in 2022. Generation X made up 24% of total buyers, and Generation Z makes up 4% of homebuyers, with 30% of Gen Z moving directly from a family member's home into homeownership.

Furthermore, buyers are now moving farther distances, with younger boomers moving the greatest distance at a median of 90 miles away. Additionally, all generations agreed that the most common reason to sell was to be closer to friends and family. Buyers expect to live in their homes for 15 years on average, up from 12 years in 2021.

Overall, the report suggests that demand for homes is growing among baby boomers and Generation Z while decreasing among younger and older millennials. Buyers are moving farther distances, with a desire to be closer to friends and family being the most common reason to sell. Buyers also view owning a home as a good investment, with a majority of buyers using a real estate agent to help with the purchase.

Hence, housing prices cannot drop drastically. Although the housing market appears to be cooling from 2023 through 2024, there are some bright spots. Economic forecasters, despite the recent recession, continue to expect robust demand from purchasers (millennials) and high home price increases in the housing market.

With homebuyers active and supply still lacking, the current trend of home prices will not see a major downfall. Despite a sluggish market and waning buyer enthusiasm, we anticipate that home demand will continue to outstrip available inventory. Increasing rental costs should add to this expected development.

However, as the number of available homes increases, the demand for housing should decrease owing to affordability concerns. As a result, we are not on the verge of a housing market crash. The rate of home price growth during the two years of the pandemic was unsustainable, and higher mortgage rates combined with increased inventory will result in slower home price growth but unlikely any big price decline.

Of course, these predictions are just that – predictions. The housing market can be unpredictable, and unforeseen factors can always come into play. However, these educated guesses can give us a general idea of what we can expect in the coming years. If you're planning to buy or sell a home, it may be helpful to keep these predictions in mind as you make your plans.


References:

  • https://www.fanniemae.com/newsroom/fannie-mae-news/q4-2023-home-price-expectations-survey
  • https://www.zillow.com/research/home-value-forecast-november-2023-33540/
  • https://www.noradarealestate.com/blog/housing-market-predictions/
  • https://www.spglobal.com/spdji/en/indices/indicators/sp-corelogic-case-shiller-us-national-home-price-nsa-index/
  • https://www.nar.realtor/newsroom/baby-boomers-overtake-millennials-as-largest-generation-of-home-buyers

Filed Under: Housing Market Tagged With: Housing Market

Is the Housing Market Crash Coming? Experts Weigh In

October 1, 2024 by Marco Santarelli

Is the Housing Market Going to Crash?

The housing market is a complex and dynamic system influenced by various economic factors, policies, and consumer behaviors. As of 2024, the question of whether the housing market will crash is on the minds of many, from potential homebuyers to economic analysts.

While the housing market has shown signs of stagnation with existing home sales at their lowest since 2010 and mortgage demand dropping significantly, most experts do not anticipate a crash in 2024.

Factors such as average mortgage rates remaining more than double compared to 2020 and 2021, and home prices staying high, have contributed to this sluggish activity. However, despite these challenges and the possibility of a recession, the consensus among housing experts is that the market will likely come back into balance without a crash.

Several experts have identified signs of a potential housing bubble since 2022, but the increase in home prices was attributed to factors other than speculation or credit expansion, such as low mortgage rates and a shift in housing demand. This suggests that while the market is under pressure, it may not be headed for a crash as seen in previous economic downturns.

Others forecast a slower rise in home prices in 2024 compared to recent years, with fluctuations depending on regional market supply and demand. Business Insider echoes this sentiment, indicating that economists do not expect a housing market crash in 2024 or beyond, with home prices projected to increase modestly.

Morgan Stanley, on the other hand, expects a slight decrease in home prices by 2 percent in 2024, suggesting a correction rather than a crash. Similarly, The Guardian reports that most property companies predict small declines in home prices in 2024, with a return to growth expected in 2025.

The housing market predictions for the second quarter of 2024 suggest a slight increase in home prices, with high demand persisting despite a low supply. Mortgage rates, while still on the higher side, could see a dip by the end of the quarter, providing some relief to potential homebuyers.

Fannie Mae's forecast also aligns with this outlook, expecting an increase in home sales transactions compared to the previous year. However, the rise in home prices is anticipated to be slower, with regional fluctuations heavily dependent on local market supply and demand.

Zillow's economists predict that home buyers will have more options and a bit more affordability in 2024, following the inventory crunch and mortgage rate hikes that dominated the previous year's news. This suggests a market that is adjusting to the new economic realities, offering opportunities for buyers who can navigate the high-rate environment.

It's evident that while the housing market faces headwinds, it is not uniformly heading towards a downturn. Instead, certain areas are thriving, and others are adjusting to create a more balanced market. For prospective buyers and investors, these trends underscore the importance of regional research and staying abreast of the latest developments to make informed decisions in a shifting landscape.

Factors That Could Prevent a Crash in the Housing Market

Here are some of the important factors that could prevent a crash in the US housing market this year.

1. Stringent Lending Standards

One of the key factors contributing to the stability of the housing market is the stringent lending standards that have been in place since the last financial crisis. These standards have ensured that borrowers are more qualified and less likely to default on their loans, creating a healthier environment for mortgage lending.

2. Homeowner Equity

Another significant factor is the overall healthier balance sheet among homeowners. Many homeowners have built up substantial equity in their homes, which acts as a buffer against market fluctuations. This equity accumulation means that even if property values were to decline, many homeowners would still have equity, reducing the likelihood of widespread foreclosures.

3. Cautious Building Practices

Builders have also adopted a more cautious approach in recent years, focusing on demand-driven construction rather than speculative building. This has helped prevent the over-supply issues that contributed to the housing market crash in 2008.

4. Demographic Demand

The strong housing demand from millennials, who are now entering their prime home-buying years, is another factor that supports the market. This demographic shift is expected to create a sustained demand for housing, particularly as this age group seeks to own homes and start families.

5. Limited Housing Supply

The limited housing supply, partly due to slower building rates and supply chain disruptions, has also played a role in maintaining home values. While this has posed challenges for affordability, it has also prevented a sudden drop in home prices that could trigger a market crash.

6. Economic Recovery and Job Market Strength

The broader economic recovery and the strength of the job market are also crucial. A strong job market means more people can afford to buy homes, which supports housing demand and prices. Moreover, as the economy recovers, consumer confidence tends to increase, which can further bolster the housing market.

7. Policy Interventions

Finally, policy interventions by the government and federal agencies can play a pivotal role in stabilizing the housing market. Measures such as interest rate adjustments, homeowner assistance programs, and housing market regulations can help mitigate the risk of a crash by addressing affordability and preventing speculative bubbles.

Therefore, while the housing market is not immune to fluctuations, several factors in 2024 are working in tandem to prevent a crash. From stringent lending practices to demographic demand and limited supply, these elements contribute to a more balanced and resilient housing market.

Factors That Could Lead to a Housing Market Crash

While the US housing market has shown resilience, there are several factors that could lead to a crash as discussed below.

1. Rising Interest Rates

One of the most significant factors that could contribute to a housing market crash is the rise in interest rates. The Federal Reserve has been increasing rates in an effort to combat inflation. Higher interest rates make mortgages more expensive, which can reduce the demand for home buying and put downward pressure on home prices.

2. Inflation and Eroding Purchasing Power

Inflation, which has been at a 40-year high, erodes consumers' purchasing power. This means that even if incomes rise, the increased cost of living can make it more difficult for people to afford homes. If inflation continues to outpace income growth, it could lead to a decrease in home affordability and demand.

3. Potential Recession

Economists have warned that the US economy may be headed for a recession in 2024. A recession typically leads to higher unemployment rates and lower consumer confidence, which can result in decreased demand for housing. This, in turn, can cause home prices to fall.

4. High Mortgage Rates and Inflated Home Values

The combination of high mortgage rates and inflated home values can also be a precursor to a housing market crash. If homeowners are unable to afford their mortgage payments due to rising rates, it could lead to an increase in foreclosures. Additionally, if home values decline, homeowners may find themselves with negative equity, which can further exacerbate the situation.

5. Scarcity of Inventory

While a limited housing supply has been supporting home prices, a sudden increase in inventory without a corresponding rise in demand could lead to a market crash. If builders respond to the current demand by rapidly increasing supply, it could create an oversupply that the market cannot absorb, leading to falling prices.

6. Household Debt

Another factor to consider is the level of household debt, which has surpassed $17 trillion. Mortgages, credit cards, and student loans make up a significant portion of this debt. If households are stretched too thin financially, any economic downturn could lead to a wave of defaults and foreclosures.

7. Shifts in Disposable Income and Access to Credit

Changes in disposable income and access to credit are also important factors. If disposable income decreases or if credit becomes more difficult to obtain, it could reduce the number of potential homebuyers in the market. This reduction in demand could lead to a decrease in home prices.

8. Rising Labor and Construction Material Costs

Finally, rising labor and construction material costs can impact the housing market. If the cost of building new homes becomes too high, it could slow down new construction and limit the supply of new homes. This could initially support prices but could also lead to a bubble if demand decreases and supply suddenly increases.

In summary, while the housing market faces challenges such as high mortgage rates, elevated home prices, and low housing stock, the majority of experts do not foresee a crash in 2024. Instead, they anticipate a market correction with a gradual balancing of supply and demand.

Filed Under: Housing Market, Real Estate Market Tagged With: Housing Market

How the Housing Market Fared During Obama’s Presidency?

October 1, 2024 by Marco Santarelli

How the Housing Market Fared During Obama's Presidency - An Analysis

The year was 2009. The global economy was reeling from the aftermath of the worst financial crisis since the Great Depression. Barack Obama was sworn in as the 44th President of the United States, inheriting a housing market in freefall. The question on everyone's mind was simple yet daunting: could the new president steer the nation, and its housing market, out of this storm?

Obama's two terms, from 2009 to 2017, witnessed a tumultuous period for the U.S. housing market. It was a time of unprecedented government intervention, dramatic price swings, and a slow, arduous recovery. Let's delve deeper into this period, examining the key trends, influential policies, and lasting impacts on the American dream of homeownership.

Obama's Housing Legacy: From Crisis to Recovery – A Market Analysis

The Inheritance: A Housing Market in Crisis (2008-2009)

To understand the housing market under Obama, we must first rewind to the crisis he inherited. The bursting of the housing bubble, fueled by subprime mortgages and lax lending practices, had triggered a domino effect:

  • Foreclosures skyrocketed: Millions of homeowners, unable to meet their mortgage obligations, faced foreclosure. In 2009 alone, there were over 2.8 million foreclosure filings.
  • Home prices plummeted: The national median home price, which peaked at $252,000 in 2007, had crashed to $189,000 by 2009.
  • Credit markets froze: Lenders, wary of further losses, tightened lending standards, making it incredibly difficult for even creditworthy borrowers to secure a mortgage.

This perfect storm of negative factors created a climate of fear and uncertainty in the housing market. It was against this backdrop that Obama took office, inheriting a crisis that demanded immediate and decisive action.

Obama's Response: Intervention and Recovery Efforts

Recognizing the housing crisis as a significant threat to the overall economic recovery, the Obama administration implemented a series of programs and policies designed to stabilize the market and assist struggling homeowners. Some of the key initiatives included:

  • The American Recovery and Reinvestment Act of 2009 (ARRA): This massive stimulus package, totaling $787 billion, included funds for programs like the Home Affordable Modification Program (HAMP), designed to help homeowners avoid foreclosure through loan modifications and other relief measures.
  • The Home Affordable Refinance Program (HARP): HARP allowed homeowners who were current on their mortgages but “underwater” (owed more than their homes were worth) to refinance into lower interest rate loans, reducing their monthly payments.
  • The Dodd-Frank Wall Street Reform and Consumer Protection Act (2010): This landmark legislation aimed to prevent future financial crises by introducing stricter regulations for the financial industry, including the creation of the Consumer Financial Protection Bureau (CFPB) to protect consumers from predatory lending practices.

These interventions, while not without their critics, played a significant role in stemming the bleeding in the housing market. They helped to slow the pace of foreclosures, stabilize home prices, and gradually restore confidence in the market.

The Long Road to Recovery: Trends from 2010 to 2016

The housing market's journey under Obama was far from a straight line upward. It was a period marked by gradual improvement interspersed with setbacks and regional variations:

2010-2012: Stabilization and Tentative Growth:

  • The pace of home price declines slowed, and by 2012, prices began to show signs of bottoming out in many areas.
  • The foreclosure crisis began to ease, although foreclosure rates remained elevated in some states.
  • The Federal Reserve implemented a policy of near-zero interest rates and quantitative easing, making mortgages more affordable and providing support to the housing market.

2013-2016: Uneven Recovery and Continued Challenges:

  • Home prices began to rise more consistently, but the pace of appreciation varied significantly across regions. Some areas, particularly those hit hardest by the crisis, experienced slower recoveries.
  • The inventory of homes for sale remained tight, leading to increased competition among buyers and contributing to rising prices.
  • Mortgage rates remained historically low, but tighter lending standards made it challenging for some borrowers to qualify for a loan.

By the end of Obama's second term, the housing market had made significant strides in its recovery from the depths of the crisis. However, challenges remained, including affordability concerns, tight inventory levels, and lingering anxieties about the long-term health of the market.

Key Data Points: A Statistical Snapshot

Here's a look at some key data points that illustrate the housing market's performance under Obama:

Metric 2009 2016 Change
Median Home Price (National) $189,000 $245,000 +29.6%
Foreclosure Filings 2.8M 1.1M -60.7%
Unemployment Rate 9.3% 4.7% -49.5%

The Obama Housing Legacy: A Mixed Bag?

The housing market's performance under Obama remains a subject of debate. While critics argue that his administration's interventions were too costly or inefficient, proponents point to the stabilization of the market and the assistance provided to millions of homeowners as evidence of their success.

Here's a balanced perspective on the Obama housing legacy:

Positives:

  • Averted a complete collapse: The Obama administration's swift and aggressive actions helped to prevent a complete meltdown of the housing market and financial system.
  • Assisted struggling homeowners: Programs like HAMP and HARP provided crucial relief to millions of homeowners facing foreclosure, allowing them to stay in their homes or avoid a devastating financial blow.
  • Strengthened consumer protections: The Dodd-Frank Act, despite its imperfections, introduced reforms aimed at preventing future crises and protecting consumers from predatory lending practices.

Challenges:

  • Slow and uneven recovery: The housing market's recovery under Obama was slow and geographically uneven, leaving some homeowners and communities behind.
  • Affordability concerns: Rising home prices, coupled with stagnant wages, exacerbated affordability challenges, particularly for first-time homebuyers.
  • Long-term impacts of interventions: The long-term consequences of the government's unprecedented intervention in the housing market, including the moral hazard implications, are still being debated.

To sum up, the housing market under Obama navigated a period of extraordinary turbulence. From the depths of the crisis to the early stages of recovery, his presidency witnessed dramatic swings in home prices, unprecedented government intervention, and a slow, uneven return to stability. While the legacy of his housing policies continues to be debated, there's no denying that his administration played a pivotal role in shaping the housing market we see today.


ALSO READ:

  • Is the Housing Market on the Brink in 2024: Crash or Boom?
  • Trump vs Harris: Which Candidate Holds the Key to the Housing Market (Prediction)
  • 2008 Forecaster Warns: Housing Market 2024 Needs This to Survive
  • Housing Market Predictions for the Next 2 Years
  • Housing Market Predictions for Next 5 Years (2024-2028)
  • Housing Market Predictions 2024: Will Real Estate Crash?
  • Housing Market Predictions: 8 of Next 10 Years Poised for Gains

Filed Under: Housing Market, Real Estate Market Tagged With: Housing Market, housing market predictions, Housing Market Trends

  • « Previous Page
  • 1
  • …
  • 266
  • 267
  • 268
  • 269
  • 270
  • …
  • 378
  • Next Page »

Real Estate

  • Birmingham
  • Cape Coral
  • Charlotte
  • Chicago

Quick Links

  • Markets
  • Membership
  • Notes
  • Contact Us

Blog Posts

  • 20 Best U.S. Cities to Invest in Real Estate in 2026
    July 26, 2026Marco Santarelli
  • Interest Rate Predictions for the Next 5 Years: 2026-2030
    July 26, 2026Marco Santarelli
  • Mortgage Rates Today, July 26, 2026: 30-Year Refinance Rate Rises by 17 Basis Points
    July 26, 2026Marco Santarelli

Contact

Norada Real Estate Investments 30251 Golden Lantern, Suite E-261 Laguna Niguel, CA 92677

(949) 218-6668
(800) 611-3060
BBB
  • Terms of Use
  • |
  • Privacy Policy
  • |
  • Testimonials
  • |
  • Suggestions?
  • |
  • Home

Copyright 2018 Norada Real Estate Investments

Loading...