Norada Real Estate Investments

  • Home
  • Markets
  • Properties
  • Membership
  • Podcast
  • Learn
  • About
  • Contact

Today’s Mortgage Rates, June 10: Buyer Costs Ease Slightly as 30‑Year Fixed Drops to 6.33%

June 10, 2026 by Marco Santarelli

Today's Mortgage Rates, July 21: Buyers Catch a Small Break as 30‑Year Fixed Dips to 6.40%

As of June 10th, most mortgage rates are showing a slight dip compared to yesterday, with the notable exception of the 15-year fixed loan, which has nudged upwards. This means there might be a small window of opportunity for some buyers, but the overall picture remains one of cautious movement rather than a dramatic shift.

It feels like just yesterday we were talking about rates heading into the low 6s, and now, here we are, back to watching the numbers closely. As someone who's been following the housing market for a good while now, I know how much even small fluctuations can mean for your budget. So, let's dive into what's happening with today's mortgage rates and what it could mean for you.

Today's Mortgage Rates, June 10: Buyer Costs Ease Slightly as 30‑Year Fixed Drops to 6.33%

What the Numbers Say Today

The most recent data gives us a snapshot of where things stand on June 10, 2026. It's important to remember these are national averages, and your specific rate will depend on your credit score, down payment, and the lender you choose.

Here's a breakdown of what Zillow is reporting for purchase loans:

Loan Type Rate Today (June 10) Change from Yesterday
30-year fixed 6.33% Down 8 basis points
20-year fixed 6.26% Down 14 basis points
15-year fixed 5.89% Up 8 basis points
5/1 ARM 6.26% Down 14 basis points

It’s interesting to see the 30-year and 20-year fixed rates moving down, while the 15-year is inching up. This suggests a bit of a mixed bag. The 5/1 ARM is also showing a nice dip, which could be attractive for those looking for a lower initial payment.

For those who have served our country, VA loans also have their own set of rates:

Loan Type Rate Today (June 10)
30-year VA 5.80%
15-year VA 5.50%
5/1 VA 5.69%

Why Are Rates Moving Like This?

It’s easy to get caught up in just the numbers, but understanding why they move is crucial. Honestly, the mortgage rate environment right now feels a bit like being on a rollercoaster that’s mostly stuck on a middle track – it's volatile and seems determined to stay within a certain range. We’re seeing rates hovering between 6.0% and 6.7%, not really breaking free.

A big player in this is the ongoing geopolitical situation. Remember earlier this year when rates flirted with dipping below 6.0%? Well, events in places like the Middle East, specifically involving Iran and the Strait of Hormuz, have caused oil prices to spike. This, in turn, has made it harder for inflation to cool down. We’re looking at a US consumer price index (CPI) that’s stubbornly around 3.8%.

On top of that, the Federal Reserve, under its new Chair Kevin Warsh, has made it clear they're not rushing to cut interest rates. The job market is still showing strength, with reports like the 172,000 jobs added in May. This resilience means the Fed is less pressured to stimulate the economy with lower borrowing costs. In fact, some economists are even whispering about the possibility of a rate hike if inflation doesn’t start cooperating. So, any hope of a quick return to those ultra-low rates we saw during the pandemic (think 3% to 4%) is pretty much off the table for the foreseeable future. Housing authorities like Fannie Mae and the Mortgage Bankers Association are adjusting their predictions, suggesting that 30-year fixed rates will likely average between 6.3% and 6.5% for the rest of the year.

What This Means for You: Smart Moves to Make

So, what can you do with this information? It’s all about being strategic.

1. Rethink Your Refinance Plan

  • The Action Plan: If you’re thinking about refinancing, my advice is to only seriously consider it if your current mortgage rate is above 7.125%.
  • The Logic: Moving from a 7.5% rate down to today’s 6.33% would obviously save you money each month. However, if your current rate is already below 6.5%, the closing costs associated with refinancing will likely eat up any savings you’d see. It just doesn't make financial sense in that scenario.

2. Master the Rate Lock Game

  • The Action Plan: If you’re currently under contract to buy a home, be ready to lock in your rate the moment you see a short-term dip in the market.
  • The Logic: Mortgage rates are sensitive to sudden jumps in things like the 10-year Treasury yields and those unpredictable energy markets. If you’re waiting for a rate below 6.0%, you could miss your chance if geopolitical news causes rates to spike again. Acting quickly when you see a favorable movement is key.

3. Consider Shorter Terms or Different Loan Types

  • The Action Plan: Take a close look at how a 15-year fixed loan or a 7/1 Adjustable-Rate Mortgage (ARM) would fit your budget.
  • The Logic: A 15-year fixed loan, while it comes with a higher monthly payment, will save you a significant amount of money in interest over the life of the loan – often more than half of what you’d pay on a 30-year. A 7/1 ARM, on the other hand, offers a lower initial rate for the first seven years. This can provide some breathing room financially while you wait for the broader economic picture to stabilize. It's a trade-off, but a potentially worthwhile one for some.

4. Get Creative with Your Closing Costs

  • The Action Plan: Explore options like negotiating a temporary seller buydown (2-1 or 3-1) or paying for discount points upfront.
  • The Logic: In today’s market, asking the seller to help with a temporary buydown can lower your interest rate by 2% in the first year and 1% in the second year. This can significantly reduce your immediate housing costs, giving you more time to plan for a permanent refinance down the road if rates become more favorable. Paying discount points out-of-pocket is another way to permanently lower your rate, but you need to do the math to ensure it makes sense for how long you plan to stay in the home.

Navigating today's mortgage market requires a good understanding of the numbers and the forces behind them. By staying informed and being proactive, you can make the best decisions for your homeownership journey.

🏡 Real Estate Investment in Indiana and Florida

Indianapolis, IN
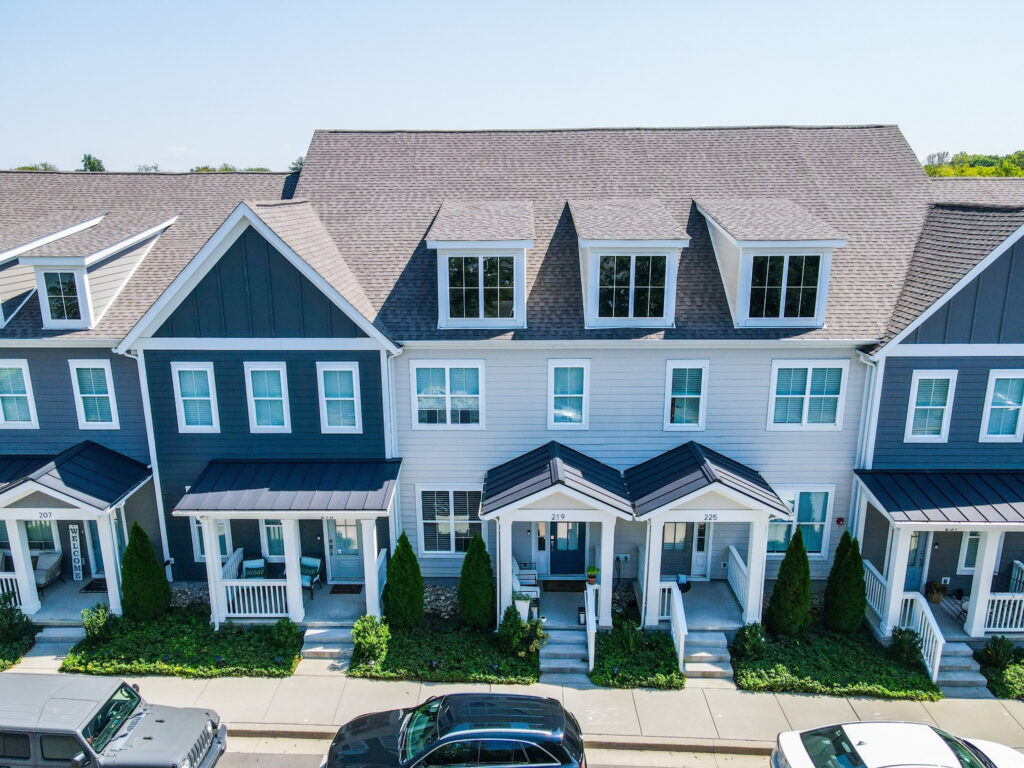
🏠 Property: Balboa Dr
🛏️ Beds/Baths: 4 Bed • 2 Bath • 1925 sqft
💰 Price: $190,000 | Rent: $1,600
📊 Cap Rate: 8.1% | NOI: $1,277
📅 Year Built: 1963
📐 Price/Sq Ft: $99
🏙️ Neighborhood: C+

VS

Port Charlotte, FL
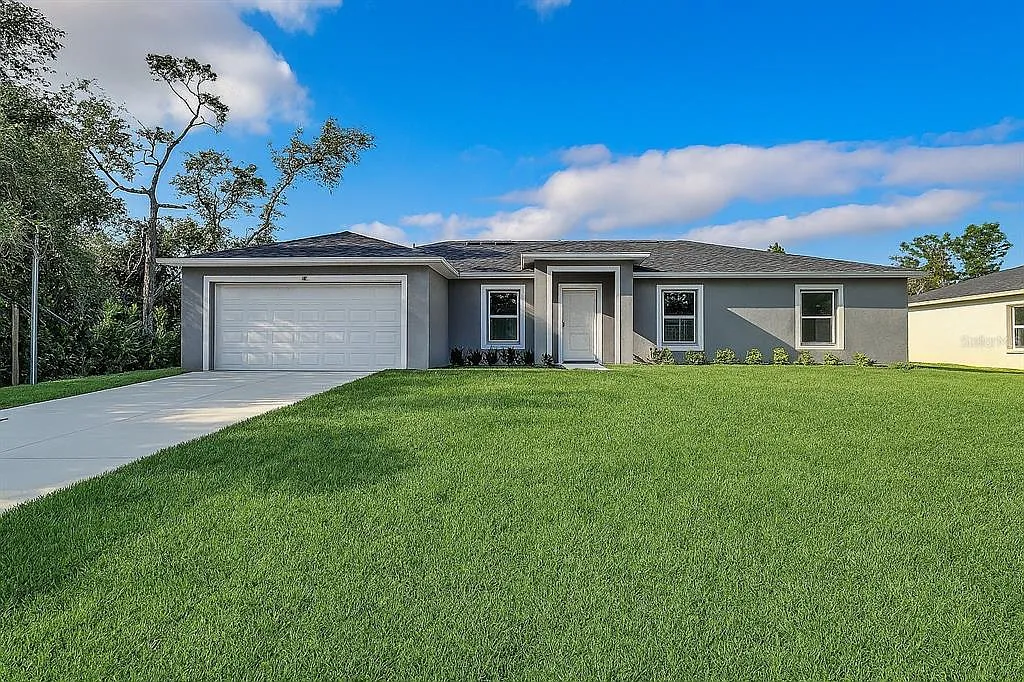
🏠 Property: Tyler Ave
🛏️ Beds/Baths: 4 Bed • 2 Bath • 1617 sqft
💰 Price: $274,900 | Rent: $1,845
📊 Cap Rate: 5.4% | NOI: $1,231
📅 Year Built: 2023
📐 Price/Sq Ft: $171
🏙️ Neighborhood: A+

Out‑of‑State investors can compare Indiana’s affordable rental with higher cap rate vs Florida’s newer A+ property with stability. Which fits YOUR investment strategy?

We have much more inventory available than what you see on our website – Let us know about your requirement.

📈 Choose Your Winner & Contact Us Today!

Speak to a Norada Investment Counselor (No Obligation):

(800) 611-3060

View All Properties

Build Passive Income & Wealth with Turnkey Rentals in 2026

Mortgage rates remain high in 2026, but rental properties continue to deliver strong cash flow and appreciation. Savvy investors know that turnkey real estate is the path to passive income and long‑term wealth.

Norada Real Estate helps you secure turnkey rental properties designed for immediate cash flow and appreciation—so you can invest smartly regardless of interest rate trends.

🔥 HOT 2026 INVESTMENT LISTINGS JUST ADDED! 🔥
Request a Callback / Fill Out the Form Online

Contact Us

Also Read:

  • Mortgage Rates Predictions Backed by 7 Leading Experts: 2025–2026
  • Mortgage Rate Predictions for the Next 3 Years: 2026, 2027, 2028
  • 30-Year Fixed Mortgage Rate Forecast for the Next 5 Years
  • 15-Year Fixed Mortgage Rate Predictions for Next 5 Years: 2025-2029
  • Will Mortgage Rates Ever Be 3% Again in the Future?
  • Mortgage Rates Predictions for Next 2 Years
  • Mortgage Rate Predictions for Next 5 Years
  • Mortgage Rate Predictions: Why 2% and 3% Rates are Out of Reach
  • How Lower Mortgage Rates Can Save You Thousands?
  • How to Get a Low Mortgage Interest Rate?
  • Will Mortgage Rates Ever Be 4% Again?

Filed Under: Financing, Mortgage Tagged With: mortgage, mortgage rates, Today’s Mortgage Rates

Should You Invest in the Houston Real Estate Market in 2026?

June 10, 2026 by Marco Santarelli

Houston Real Estate Investment: Should You Invest in Houston?

If you're weighing your options for real estate investments in the coming year, I can tell you with a good deal of confidence that Houston in 2026 presents a compelling, and frankly, opportune window for those looking for solid long-term gains, not quick flips. The market has shifted from a frenzied seller's market to a much more balanced playing field, giving savvy investors the breathing room they need to make smart decisions.

Houston Real Estate Investment: Should You Invest in Houston in 2026?

As someone who's watched Houston's real estate scene evolve for years, I've seen its cycles. And right now, 2026 feels like a sweet spot. It's not the boom-or-bust scenario we've witnessed in the past. Instead, it’s a return to what I'd call “the fundamentals” – good old-fashioned supply and demand, thoughtful neighborhood growth, and a strong economy driving it all. This isn't about chasing a fleeting trend; it's about planting roots in a market that’s poised for steady, sustainable growth.

What's Really Going On in Houston's Market Right Now?

Let's break down the numbers, because they paint a clear picture of why 2026 is looking so interesting. Forget the days where houses flew off the market in a weekend with multiple bids. We're in a different phase now, and that's good news for investors.

  • Inventory is Up, and That's a Good Thing: We're seeing a healthy increase in the number of homes available. Right now, you can expect to see somewhere between 31,350 to 34,570 active residential listings. This translates to about a 4.5 to 4.7-month supply of homes, which is considerably more than the national average of around 3.3 months. What does this mean for you? It means you have choices! You can take your time, do your homework, and find the right property without feeling rushed.
  • Prices are Settling Down: The crazy price hikes of the recent past have cooled off. Median sales prices are hovering around $322,000 to $335,000. Experts are forecasting a modest, but importantly, sustainable appreciation of 2% to 5% for the year. This isn't the double-digit growth that can be unsustainable, but a steady climb that indicates a healthy market.
  • Homes are Sitting a Little Longer: The average time a home spends on the market is about 65 to 72 days. This is the longest we've seen since early 2020. Again, this is a positive for investors. It gives you ample time to perform thorough inspections, secure financing, and really understand what you're buying. No more making snap decisions under pressure!
  • Interest Rates are Becoming More Manageable: While nobody has a crystal ball, the general consensus is that mortgage rates will likely stay in the 6% to 7% range. There's even a chance they could dip below 6% by the end of 2026. This is a big deal. These rates offer a better return on investment compared to the higher rates we've seen recently, making it more feasible to acquire income-producing properties.

Top Reasons To Invest In The Houston Real Estate Market

Where Should You Be Looking to Invest in Houston?

Houston is a massive, diverse city, and not all areas are created equal when it comes to investment potential. Based on what I'm seeing and hearing from my network, these are the areas and types of properties that are really standing out for 2026:

Top Investment Opportunities to Consider

  • Single-Family Rentals (SFRs) in Growing Suburbs:
    Houston continues to attract people from all over, and families are a huge part of that migration. Suburbs like Katy, Cypress, and Fulshear are experiencing significant growth and have a consistent demand for well-maintained single-family homes. These areas offer a good balance of affordability, amenities, and good school districts, making them attractive to renters and future buyers alike. I personally believe these established suburban markets will continue to be a bedrock for reliable, long-term rental income.
  • The Rise of Build-to-Rent (BTR):
    This is a trend that's really gaining momentum. As more people choose to rent longer or look for communities with more amenities, developers are building entire neighborhoods specifically for renters. With Houston's population growth and sustained demand for housing, BTR communities are becoming a very strong investment avenue. It’s a more professionalized approach to rental housing, often with single management.
  • The Luxury Segment is Heating Up:
    It might surprise some, but the luxury segment (homes priced at $1 million and above) has been the star performer recently. We're seeing sales in this bracket jump by over 15% year-over-year as of early 2026. This often indicates a strong job market for high-earners and a desire for premium living in a city that offers a high quality of life.
  • Inner-Loop Neighborhood Revivals:
    Think about areas close to the Texas Medical Center, the trendy neighborhoods of The Heights, and the affluent community of West University. These established, desirable areas continue to draw professionals who want to be close to major employment centers, entertainment, and dining. Properties here often hold their value well and command higher rents.

What About Renting in Houston?

Even with more homes on the market, Houston's rental demand remains strong. Many people are holding off on buying until interest rates become more favorable, which is excellent news for landlords.

  • Rental Demand is Still Robust: People need places to live, and right now, renting is the sensible option for many.
  • Rent Growth Will Be Moderate: Don't expect massive jumps in rent. We're looking at a more “low single-digit” rent growth of 0% to 4%, depending on the specific area and type of property. This stability is good for long-term planning.
  • Vacancy Rates are Up Slightly: You'll see vacancy rates around 11.4% to 11.6%. This is largely due to a recent surge in new apartment construction. While this might sound like a lot, it's important to remember that in Houston, demand is usually high enough to absorb this supply over time.
  • Texas is Investor-Friendly: One of the biggest advantages of investing in Texas, and Houston specifically, is that it's consistently ranked as one of the most landlord-friendly states. We don't have a state income tax, and the regulatory environment is generally stable and predictable. This is a huge piece of the puzzle for me when considering where to put my money.

My Takeaway

As an investor, I'm always looking for markets that offer stability, growth potential, and a favorable economic environment. Houston in 2026 checks all those boxes. While it’s not a market for get-rich-quick schemes, it's an excellent place to build wealth through carefully selected real estate investments. The current market conditions – higher inventory, stabilizing prices, and manageable interest rates – provide a unique environment for investors to do their due diligence and secure properties with strong long-term potential.

The “return to fundamentals” that you’re seeing in Houston means that smart investors can get back to basics: buy properties in desirable locations, maintain them well, and benefit from consistent rental income and steady appreciation. The city's economic drivers, from its booming energy sector to its world-class healthcare and growing tech scene, continue to fuel population growth and demand for housing.

So, to answer the question directly: Yes, investing in Houston in 2026 can be a smart move for long-term investors. Just remember to do your homework, work with trusted local professionals, and focus on properties that align with your investment goals.

Want Stronger Returns? Invest Where the Housing Market’s Growing

In 2026, select U.S. cities are projected to see surging demand, rising rents, and appreciation—creating prime opportunities for investors seeking passive income and long‑term wealth.

Work with Norada Real Estate to find stable, cash-flowing markets beyond the bubble zones—so you can build wealth without the risks of ultra-competitive areas.

🔥 HOT 2026 INVESTMENT LISTINGS JUST ADDED! 🔥
Talk to a Norada Investment Counselor (No Obligation):
(800) 611-3060

Get Started Now

Read More:

  • Houston Housing Market: Trends and Forecast 2025-2026
  • Houston Real Estate Market Forecast 2025-2026: What to Expect
  • 17 Facts That Make Houston the Best City in America
  • Best Houston Neighborhoods to Buy Investment Properties in 2025
  • Housing Market Trends: Big Investors Buy in Atlanta, Dallas, Charlotte, Houston
  • Is Texas a Good Place to Live: Explore the Cost, Jobs and Lifestyle

Filed Under: Real Estate Investing, Real Estate Investments Tagged With: Houston Real Estate Investment

Houston Housing Market: Trends and Forecast 2026

June 10, 2026 by Marco Santarelli

Houston Housing Market: Trends and Forecast 2025-2026

The Houston housing market is showing robust signs of returning to pre-pandemic norms and is even expanding, with sales surpassing 2019 levels. This trend is expected to continue through 2026, offering a more balanced and accessible environment for homebuyers.

As someone who's spent a good chunk of time watching Houston's real estate scene unfold, I've got to say, things are looking pretty interesting for 2026. Forget those wild swings we saw a few years back; the market is settling into a rhythm that feels more familiar, and honestly, more sustainable.

Houston Housing Market Trends in 2026

You might have heard that Houston home sales picked up in April. That's according to the Houston Association of Realtors® (HAR), and it’s a big deal. It means more people are finding homes, and that’s always a good sign for any city. The numbers for April 2026 showed a healthy jump in single-family home sales, up 4.4% from the year before. That translates to about 8,196 homes finding new owners, compared to 7,852 in April 2025. It’s not just a blip; it feels like a solid shift.

What’s really making this shift happen? Two big things: more homes available and prices that are actually starting to ease up a bit. We’ve been in a seller’s market for so long, it's refreshing to see things tilt back towards buyers.

Why More Homes on the Market Matters

Let’s talk about inventory. It’s like the oxygen for the housing market. When there aren’t many homes for sale, it creates a frenzy. Buyers are stressed, bidding wars are common, and the whole process can be exhausting. But in April 2026, active listings for single-family homes jumped by 6.5% year over year, reaching a total of 36,572 homes. That’s a significant number, and it means buyers have more choices.

HAR Chair Theresa Hill put it perfectly: “More inventory is giving buyers room to breathe again.” And she’s right. Homes are still selling, but there’s less pressure. Buyers have more time to think, to visit properties, and crucially, to negotiate. This increase in available homes is creating a more balanced marketplace, which is something we haven't seen much of in Houston lately.

Price Adjustments: A Welcome Sight

Alongside the increased inventory, home prices have started to moderate. This doesn't mean they're crashing, but the rapid climb we witnessed has definitely slowed. In April 2026, the average single-family home price saw a slight decrease of 1.4% to $428,709. The median price, which is often a better indicator for the typical buyer, dipped by 1.6% to $332,000.

This is great news for affordability. When you combine moderating prices with the fact that mortgage rates have also been dropping – down to 6.33% in April 2026 from 6.73% a year prior, according to Freddie Mac – it makes a real difference. For someone buying a median-priced home with a 20% down payment, their monthly principal and interest payment is nearly $100 less than it was a year ago. This improvement in affordability has been happening for 18 of the last 21 months, which is fantastic news for anyone looking to own a home in Houston.

Houston vs. The Nation: A Story of Resilience

Here’s where Houston really shines. While national housing sales are still struggling to get back to where they were before the pandemic, Houston’s market has not only recovered but is surpassing 2019 sales levels. In April 2026, single-family home sales were up 6.8% compared to April 2019. For the entire 12 months leading up to April 2026, sales were up 7.6% compared to the same period in 2019.

Think about that for a second. The rest of the country is still down significantly, with U.S. existing-home sales down 22.4% in April 2026 compared to April 2019. Houston, on the other hand, is showing growth. This tells me something about the fundamental strengths of our city – our diverse economy, our growing population, and the sheer desirability of living here.

Dr. Ted C. Jones, HAR’s Chief Economist, hit the nail on the head when he said, “Houston housing markets are back to pre-pandemic norms and expanding.” It's not just a rebound; it's progress.

A Deeper Dive into the Numbers (April 2026)

Let's break down some of the key figures from the HAR report for April 2026:

  • Overall Property Sales: Across all property types in Greater Houston, sales increased by 3.1% year over year, with 9,568 properties sold.
  • Total Dollar Volume: The total value of homes sold climbed by 2.6%, reaching over $3.9 billion.
  • Active Listings (All Property Types): The number of homes available for sale across all types went up by 6.0%, totaling 57,436.

Single-Family Homes: The Heart of the Market

  • Sales Volume: As mentioned, single-family home sales were up 4.4%, with 8,196 homes sold.
  • Pending Sales: A strong indicator of future activity, pending sales jumped by a significant 9.4%, showing continued buyer interest.
  • Average Price: $428,709 (down 1.4% year over year)
  • Median Price: $332,000 (down 1.6% year over year)
  • Price per Square Foot: Decreased by 2.0% year over year to $176.
  • Days on Market (DOM): Homes are staying on the market a bit longer, averaging 60 days, up from 55 days a year ago. This is a sign of a more balanced market.
  • Inventory: Months of inventory rose slightly to 4.9 months, compared to 4.8 months last year. This is still a healthy level and above the national average of 4.1 months.

Sales by Price Segment (Single-Family Homes)

It’s interesting to see how different price points are performing:

Price Range Percentage Change (YoY) Number of Transactions
$1 – $99,999 +11.0% 111
$100,000 – $149,999 +26.0% 213
$150,000 – $249,999 +12.4% 1,528
$250,000 – $499,999 +2.8% 4,551
$500,000 – $999,999 -1.3% 1,398
$1M and above +2.1% 394

What jumps out to me here is the strong performance in the lower to mid-price ranges. This indicates that affordability is a key driver for many buyers. The luxury market is holding steady, which is also a good sign for overall market health.

Townhome and Condominium Market

The townhome and condo market showed a different dynamic. Sales volume held steady year over year, but the median price rose 7.0% to $230,000. This suggests strong demand for these types of properties, even as the average price saw a slight decline. Inventory for townhomes and condos expanded significantly to an 8.3-month supply, up from 7.2 months a year ago, providing more options for buyers in this segment.

Houston Housing Market Forecast for 2026

Looking ahead to 2026, I believe these positive trends will continue. The economic foundation of Houston remains strong, attracting new residents and businesses. The ongoing improvements in affordability, driven by stable mortgage rates and a healthy inventory, will keep the market accessible for a wider range of buyers.

I expect to see continued growth in single-family home sales, likely at a more measured pace than the rapid surges of the past. The balance between buyers and sellers will favor buyers more than in recent years, leading to more predictable pricing and less intense competition.

Key factors I’m watching for the Houston housing market in 2026 include:

  • Interest Rate Stability: While rates are lower than a year ago, any significant increases could impact affordability. I'm optimistic they'll remain in a favorable range for buyers.
  • Job Growth and Economic Diversification: Houston’s economy is its backbone. Continued job creation, especially in diverse sectors beyond oil and gas, will fuel housing demand.
  • New Construction: The pace of new home building will play a crucial role in meeting demand and keeping inventory levels healthy.
  • Affordability Index: I’ll be keeping an eye on how Houston’s affordability compares to other major metros, as this is a key draw for newcomers.

My Personal Outlook

From where I stand, 2026 looks like a fantastic year for Houston real estate. It's a market that's maturing, offering opportunities for both seasoned investors and first-time homebuyers. The days of homes flying off the market within hours might be behind us for now, but that’s not a bad thing. It means we’re entering a phase of steady, sustainable growth, which is what any healthy housing market strives for. If you've been waiting for the right time to buy or sell, 2026 is shaping up to be a prime year to make your move in Houston.

Want Stronger Returns? Invest Where the Housing Market’s Growing

In 2026, select U.S. cities are projected to see surging demand, rising rents, and appreciation—creating prime opportunities for investors seeking passive income and long‑term wealth.

Work with Norada Real Estate to find stable, cash-flowing markets beyond the bubble zones—so you can build wealth without the risks of ultra-competitive areas.

🔥 HOT 2026 INVESTMENT LISTINGS JUST ADDED! 🔥
Talk to a Norada Investment Counselor (No Obligation):
(800) 611-3060

Get Started Now

Recommended Read:

  • Houston Real Estate Market Forecast: What to Expect
  • Houston Real Estate Investment: Should You Invest in Houston?
  • Housing Market Trends: Big Investors Buy in Houston, Atlanta, Dallas, Charlotte
  • Best Houston Neighborhoods To Buy Investment Properties
  • 17 Facts That Make Houston the Best City in America
  • Texas Housing Market: Prices, Trends, Predictions 2024-2025

Filed Under: Growth Markets, Housing Market, Real Estate Investments Tagged With: Housing Market, Houston

Dallas Housing Market: Prices, Trends, Forecast 2026

June 10, 2026 by Marco Santarelli

Dallas Housing Market: Prices, Trends, Forecast 2025-2026

The Dallas housing market, while showing some signs of cooling in early 2026, is poised for a steady, if not spectacular, rebound by the end of 2026, driven by sustained population growth and a resilient economy.

You're probably wondering what's happening with home prices and what to expect if you're thinking about buying or selling in the Dallas-Fort Worth (DFW) area. It's a question on many minds, and I've been closely following the numbers. Based on the latest reports from the Texas Real Estate Research Center and my own observations, it's clear that while we've seen some dips, the DFW market isn't headed for a crash. Instead, I see a market that's adjusting and finding a new equilibrium.

Let's dive into what the data is telling us for April 2026 and what that might mean for the rest of the year and into 2026.

Dallas Housing Market Trends 2026

A Closer Look at April 2026: Signs of Change

The first few months of 2026 have presented a bit of a mixed bag, and April's numbers offer some interesting insights. When I look at the Texas Real Estate Research Center‘s housing report for the Dallas-Fort Worth-Arlington metropolitan area in April 2026, I see a market that's not quite as hot as it was in previous years, but certainly not cold either.

Here's a snapshot of what happened in April 2026 compared to April 2025:

Table 1: April 2026 Housing Activity vs. April 2025

Metric April 2026 YoY % Change (vs. 2025) Year-to-Date (YTD) 2026 YTD YoY % Change (vs. 2025)
Sales 8,761 7.47% 28,046 0.87%
Dollar Volume $4.47B 6.49% $13.83B 0.24%
Median Close Price $390,000 -2.27% $385,000 -2.53%
New Listings 14,779 -5.96% 52,440 -1.33%
Active Listings 32,877 0.61% 30,155 3.45%
Months Inventory 4.3 -0.80% 4.3 -0.80%
Days to Sell 93 4.49% 103 7.29%
Average Price PSF $208.03 -2.66% $203.58 -2.45%
Median Price PSF $189.90 -2.92% $186.88 -3.12%
Median Square Feet 2,100 0.53% 2,100 0.67%
Close to Original List Price 95.26% -0.44% 94.36% -0.69%

What jumps out at me immediately is the increase in sales volume (7.47% year-over-year). That's a significant jump, and it tells me that despite some price adjustments, people are still actively buying homes in DFW. The dollar volume, which represents the total value of all sales, also saw a healthy increase. This suggests that while individual home prices might be slightly down, more homes are changing hands, and the overall market activity is robust.

However, there's a nuance. The median close price did decrease by 2.27%. This is where things get interesting. It’s not a dramatic drop, but it signals a shift from the rapid appreciation we’ve become accustomed to. The average price per square foot has also followed suit.

From my perspective, this isn't necessarily a bad thing. It indicates a market that's stabilizing. For buyers, it means there might be a bit more room for negotiation, and for sellers, it means pricing strategies need to be more realistic than they might have been a year or two ago.

The number of new listings is down, which, coupled with rising sales, helps explain why the months of inventory (the time it would take to sell all active listings at the current pace) remained steady at 4.3 months. This is still a relatively balanced market, leaning slightly towards a seller's advantage, but it’s a far cry from the extremely tight inventory we saw during the pandemic boom.

The days to sell has increased slightly, meaning homes are taking a little longer to find a buyer. This is another indicator of a more balanced market, giving buyers a bit more time to consider their options.

Diving Deeper: What's Happening Across Different Price Points?

The overall numbers are important, but they don't tell the whole story. When I look at the price cohort analysis (Table 2), I see some fascinating trends.

Table 2: Price Cohort Analysis – April 2026

Price Cohort Median Close Price (Apr 2026) YoY % Change (Median Close Price) Active Listings Months Inventory Median Year Built
$0 < $70k $55,000 -15.38% 41 2.8 1981
$70k < $100k $88,650 -1.50% 120 4.3 1970
$100k < $150k $125,000 -1.96% 405 3.7 1961
$150k < $200k $180,000 1.41% 957 4.3 1970
$200k < $250k $230,000 0.08% 1,670 3.0 1984
$250k < $300k $275,000 -0.72% 3,490 3.4 2003
$300k < $400k $345,000 -0.72% 7,679 3.7 2007
$400k < $500k $442,050 -0.10% 5,467 4.4 2012
$500k < $750k $590,000 0.00% 7,314 5.0 2008
$750k < $1 mil $835,000 -0.30% 2,591 5.7 2005
$1 mil + $1,400,000 -0.43% 3,143 6.9 2007

It's interesting to see that the lower price points (below $200,000) are experiencing some significant price declines. This is likely due to a combination of factors, including the age of these homes (older average year built) and potentially higher interest rates affecting affordability for first-time buyers in these segments.

On the flip side, the mid-range and higher-end markets (from $200,000 upwards) are showing much more price stability, with very minimal year-over-year changes. The luxury market ($1 million and above) even saw a slight increase in active listings, suggesting more inventory becoming available in this segment. However, months of inventory are higher in these upper brackets, indicating that while sales are happening, they might take a bit longer.

My take here is that the DFW market is segmenting. The demand for affordable housing remains strong, but the supply might be catching up or facing affordability challenges from financing. The move-up and luxury markets are seeing more balanced conditions.

Single-Family Homes vs. Townhomes and Condos

Let's break down the activity by property type, as this often tells a different story.

Single-Family Homes (Table 3):

Single-family homes continue to be the backbone of the DFW housing market. In April 2026, we saw an 8.45% increase in sales volume compared to the previous year. Dollar volume also rose by 7.67%. This is the segment driving the overall sales growth I mentioned earlier. However, the median close price for single-family homes dipped by 1.25%, and the median price per square foot also saw a slight decrease. The months of inventory remained tight at 4.1 months, and days to sell increased slightly.

Table 3: Single-Family Activity – April 2026 vs. April 2025

Metric April 2026 YoY % Change (vs. 2025)
Sales 8,300 8.45%
Dollar Volume $4.29B 7.67%
Median Close Price $395,000 -1.25%
New Listings 13,735 -5.28%
Active Listings 29,696 0.64%
Months Inventory 4.1 -1.61%
Days to Sell 94 5.62%
Average Price PSF $206.47 -2.35%
Median Price PSF $188.46 -2.95%
Median Square Feet 2,131 0.14%

This reinforces my earlier observation: increased sales activity in single-family homes, but with prices moderating.

Townhomes (Table 4):

The townhome market in April 2026 showed a different picture, with a 9.93% decrease in sales volume. Dollar volume also dropped significantly. The median close price for townhomes saw a notable decrease of 5.23%. Months of inventory for townhomes rose to 6.4 months, indicating a move towards a buyer's market in this segment.

Table 4: Townhouse Activity – April 2026 vs. April 2025

Metric April 2026 YoY % Change (vs. 2025)
Sales 245 -9.93%
Dollar Volume $103.47M -16.35%
Median Close Price $375,000 -5.23%
New Listings 482 -19.26%
Active Listings 1,426 0.21%
Months Inventory 6.4 12.12%
Days to Sell 94 -1.05%
Average Price PSF $216.62 -4.34%
Median Price PSF $210.04 -3.07%
Median Square Feet 1,849 -0.86%

From my experience, townhomes can sometimes be more sensitive to economic shifts, and the current data suggests a slowdown. This could be due to a variety of factors, including changing buyer preferences or increased competition from more affordable single-family homes in certain areas.

Condominiums (Table 5):

The condominium market in April 2026 also experienced a downturn, with a 7.49% decrease in sales volume. Dollar volume and median close prices also declined. Months of inventory for condos increased significantly to 8.9 months, and days to sell also rose.

Table 5: Condominium Activity – April 2026 vs. April 2025

Metric April 2026 YoY % Change (vs. 2025)
Sales 210 -7.49%
Dollar Volume $76.18M -16.77%
Median Close Price $272,250 -7.71%
New Listings 562 -9.06%
Active Listings 1,755 0.40%
Months Inventory 8.9 15.44%
Days to Sell 103 17.05%
Average Price PSF $258.41 -6.17%
Median Price PSF $238.51 -3.86%
Median Square Feet 1,154 -2.86%

The condo market appears to be facing the most challenges, with a considerable increase in inventory and longer selling times. This segment often appeals to first-time buyers or those looking for a more urban lifestyle, and the current economic climate and interest rate environment may be impacting affordability and demand more acutely here.

Dallas Housing Market Forecast for 2026

Looking ahead to the rest of 2026 and beyond, I believe the Dallas housing market will continue its trajectory of stabilization and moderate growth. Here's my forecast:

  • Continued Sales Growth: The underlying demand for housing in DFW, fueled by its strong job market and continued population influx, is not going away. I expect sales volume to continue its upward trend, especially in the single-family segment, as we move through the year.
  • Price Moderation, Not Collapse: The days of rapid, double-digit price appreciation are likely behind us for now. However, I don't foresee a significant price crash. The median home price might see slight fluctuations, but overall, it will likely remain relatively stable, with potential for gradual increases towards the end of 2026 as inventory tightens further in desirable areas.
  • Inventory Management: We'll likely see inventory levels remain a key factor. While new listings have decreased, sustained sales will continue to absorb available homes. Expect inventory to remain balanced, leaning slightly in favor of sellers in many popular DFW submarkets.
  • Affordability Remains Key: Interest rates will continue to play a crucial role in market dynamics. While they may not drop dramatically, any easing could significantly boost buyer demand and affordability, leading to increased price pressure. Conversely, any sharp increases could slow things down.
  • Segmented Market Performance: The trends we're seeing across different property types and price points will likely persist. Single-family homes will remain strong, while townhomes and condos might see slower recovery, depending on local demand and developer activity. The luxury market will continue to be driven by different economic factors.
  • Focus on Value: Buyers will continue to seek value and good deals. Sellers who price their homes realistically and present them well will be the most successful. Negotiation will be more common than in recent years.

As an observer and participant in the real estate world, my advice is this: If you're a buyer, now might be a good time to explore the market. You may find more options and potentially better terms than you would have a year ago. However, be prepared for continued competition in certain areas and price points. If you're a seller, focus on strategic pricing and making your home as attractive as possible. Understand that the market has shifted, and while it's still a strong market, it's no longer a seller's free-for-all.

The Dallas housing market is dynamic. It's not about predicting exact numbers, but understanding the underlying forces at play. My overall outlook for 2026 is one of a healthy, evolving market that continues to offer opportunities for those who are informed and adaptable.

Want Stronger Returns? Invest Where the Housing Market’s Growing

In 2026, select U.S. cities are projected to see surging demand, rising rents, and appreciation—creating prime opportunities for investors seeking passive income and long‑term wealth.

Work with Norada Real Estate to find stable, cash-flowing markets beyond the bubble zones—so you can build wealth without the risks of ultra-competitive areas.

🔥 HOT 2026 INVESTMENT LISTINGS JUST ADDED! 🔥
Talk to a Norada Investment Counselor (No Obligation):
(800) 611-3060

Get Started Now

Recommended Read:

  • Texas Housing Market: Trends and Predictions
  • Will the Texas Housing Market Crash?
  • Is Texas a Good Place to Live: Explore the Cost, Jobs & Lifestyle
  • Are Texas Home Sales Dropping?
  • Should You Invest in the Dallas Real Estate Market?

Filed Under: Growth Markets, Housing Market Tagged With: Dallas, Dallas Housing Market

Mortgage Rates Today, June 10, 2026: 30‑Year Refinance Rate Rises by 3 Basis Points

June 10, 2026 by Marco Santarelli

Mortgage Rates Today, July 21, 2026: 30-Year Refinance Rate Drops by 2 Basis Points

As of Wednesday, June 10, 2026, the average 30-year fixed refinance rate is sitting at 6.75%, marking a slight uptick of 3 basis points from last week. While this movement might seem small, it's part of a larger picture of mortgage rates remaining in a tight, elevated range, especially for those looking to refinance their homes.

Mortgage Rates Today, June 10, 2026: 30-Year Refinance Rate Rises by 3 Basis Points

It’s been a bit of a roller coaster, hasn’t it? Just when you think you have a handle on where mortgage rates are headed, something shifts. I’ve been following this market closely for years, and I can tell you that even minor moves like this one can be telling. For homeowners thinking about refinancing, understanding these nuances is key. It’s not just about the headline number; it’s about what’s driving it and what it means for your financial goals.

What's Pushing Refinance Rates Today?

This slight increase in the 30-year fixed refinance rate isn't happening in a vacuum. Several big economic forces are at play, and they're keeping lenders a bit cautious.

  • A Stronger-Than-Expected Job Market: The latest report from the U.S. Bureau of Labor Statistics painted a pretty rosy picture of May's employment data. More jobs mean a stronger economy, which, in turn, gives the Federal Reserve less reason to rush into lowering its benchmark interest rate. When that benchmark rate stays higher, mortgage rates tend to follow suit.
  • Inflation Isn't Quite Beaten Yet: Even though we've made progress, inflation is still a persistent concern. This “stubbornly high” inflation keeps the yields on longer-term investments, like bonds, elevated. Investors are anxiously waiting for the next Consumer Price Index (CPI) report, which will be a major clue about where inflation is truly heading. The bond market, which mortgage rates are closely tied to, reacts strongly to these kinds of signals.
  • Treasury Yields are Creeping Up: If you’ve been paying attention, you’ll notice that mortgage rates often mirror the performance of the 10-year U.S. Treasury yield. We've seen this yield recently climb back above the 4.5% mark. This upward trend directly influences what lenders can offer on mortgages.
  • Global Jitters: The world stage can also play a role. Ongoing geopolitical tensions and instability in certain regions can create uncertainty in financial markets, including oil and bond prices. This added layer of unpredictability can make lenders more hesitant, leading to slightly higher rates.

The 15-Year Fixed and 5-Year ARM Picture

While the 30-year fixed refinance rate saw a minor bump, other popular options are holding steady:

  • 15-Year Fixed Refinance Rate: This option remains stable at 5.87%. This is often a good choice for those looking to pay off their mortgage faster and save on interest over time, provided they can manage the higher monthly payments.
  • 5-Year ARM Refinance Rate: The current national average for a 5-year Adjustable-Rate Mortgage (ARM) refinance is 6.31%. ARMs can be attractive if you plan to move or refinance again before the fixed period ends, as they often start with lower rates than fixed-rate loans.

What Does This Mean for You Right Now?

Seeing rates tick up, even slightly, can be frustrating, especially if you're a homeowner who locked in a much lower rate a few years ago. Based on my experience, traditional rate-and-term refinances are only a smart move for a smaller group of people right now. The key is to ensure that the savings you'll get from a new loan will actually outweigh the costs of getting that loan.

Here’s my advice for anyone considering a refinance in this market:

  • Know Your Break-Even Point: This is crucial. Calculate exactly how long it will take for the money you save on monthly payments to cover all your closing costs. If you don't plan on staying in your home long enough to “break even,” refinancing might not be the best financial decision.
  • Polish Your Credit Score: Lenders are currently offering their best rates to borrowers with excellent credit. If your score is in the mid-to-high 700s, you're in a strong position. Focus on paying down credit card balances and avoid opening new credit lines right before you apply.
  • Explore Cash-Out Options Carefully: If you need to access your home equity for renovations or to consolidate debt, a cash-out refinance isn't the only game in town. Definitely compare it to a Home Equity Line of Credit (HELOC). A HELOC might be a better fit because it allows you to keep your original, low-rate mortgage intact.
  • Shop Around Like You Mean It: Never settle for the first quote you get. I can’t stress this enough. Get official loan estimates from at least three different lenders – whether they are big banks, credit unions, or online mortgage companies. Compare not just the interest rate but also the Annual Percentage Rate (APR), which includes fees. This is where the real costs are often hidden.

Looking Ahead

The mortgage market is a dynamic beast, influenced by a constant flow of economic data and global events. While the 30-year refinance rate has nudged up by 3 basis points today, June 10, 2026, it's important to see this within the broader context. Rates remain elevated, and smart borrowers will focus on personalized calculations and diligent comparison shopping.

🏡 Out-of-state turnkey real estate investments

Helena, AL
🏠 Property: Village Pkwy
🛏️ Beds/Baths: 3 Bed • 2.5 Bath • 1500 sqft
💰 Price: $300,000 | Rent: $1,925
📊 Cap Rate: 6.4% | NOI: $1,608
📅 Year Built: 2025
📐 Price/Sq Ft: $200
🏙️ Neighborhood: B

VS

Nashville, TN
🏠 Property: Winton Dr
🛏️ Beds/Baths: 3 Bed • 2.5 Bath • 1688 sqft
💰 Price: $360,000 | Rent: $2,100
📊 Cap Rate: 5.5% | NOI: $1,662
📅 Year Built: 2001
📐 Price/Sq Ft: $214
🏙️ Neighborhood: A

Alabama’s newer rental with solid cap rate vs Tennessee’s established A‑rated property with stability. Which fits YOUR investment strategy?

We have much more inventory available than what you see on our website – Let us know about your requirement.

📈 Choose Your Winner & Contact Us Today!

Speak to a Norada Investment Counselor (No Obligation):

(800) 611-3060

View All Properties

Build Passive Income & Wealth with Turnkey Rentals in 2026

Mortgage rates remain high in 2026, but rental properties continue to deliver strong cash flow and appreciation. Savvy investors know that turnkey real estate is the path to passive income and long‑term wealth.

Norada Real Estate helps you secure turnkey rental properties designed for immediate cash flow and appreciation—so you can invest smartly regardless of interest rate trends.

🔥 HOT 2026 INVESTMENT LISTINGS JUST ADDED! 🔥
Request a Callback / Fill Out the Form Online

Contact Us

Also Read:

  • Mortgage Rates Predictions Backed by 7 Leading Experts: 2025–2026
  • Mortgage Rate Predictions for the Next 3 Years: 2026, 2027, 2028
  • 30-Year Fixed Mortgage Rate Forecast for the Next 5 Years
  • 15-Year Fixed Mortgage Rate Predictions for Next 5 Years: 2025-2029
  • Will Mortgage Rates Ever Be 3% Again in the Future?
  • Mortgage Rates Predictions for Next 2 Years
  • Mortgage Rate Predictions for Next 5 Years
  • Mortgage Rate Predictions: Why 2% and 3% Rates are Out of Reach
  • How Lower Mortgage Rates Can Save You Thousands?
  • How to Get a Low Mortgage Interest Rate?
  • Will Mortgage Rates Ever Be 4% Again?

Filed Under: Financing, Mortgage Tagged With: mortgage rates, Mortgage Rates Today, Refinance Rates

Today’s Mortgage Rates, June 9: Rates Are in Mid‑6% Range, Buyer Power Shrinks

June 9, 2026 by Marco Santarelli

Today's Mortgage Rates, July 21: Buyers Catch a Small Break as 30‑Year Fixed Dips to 6.40%

As of Tuesday, June 9, 2026, today's mortgage rates are showing a slight uptick, with the average 30-year fixed rate at 6.41%, according to Zillow. This means that if you're looking to buy a home or refinance, you'll find borrowing a little more expensive than yesterday.

Rates are now firmly settled in the mid-6% territory for the most common home loan, the 30-year fixed. I know this can be frustrating for anyone dreaming of homeownership or trying to trim their monthly payments. Let's dive into what's actually happening with these numbers and what it means for you.

Today's Mortgage Rates, June 9: Rates Are in Mid‑6% Range, Buyer Power Shrinks

The numbers are the numbers, but understanding them helps make sense of the market. Here's a breakdown from Zillow for Tuesday, June 9, 2026:

Loan Type Interest Rate
30-year fixed 6.41%
20-year fixed 6.40%
15-year fixed 5.81%
5/1 ARM 6.66%
7/1 ARM 6.74%
30-year VA 5.96%
15-year VA 5.51%
5/1 VA 5.71%

As you can see, the 30-year fixed and 15-year fixed loans have both edged up. The 5/1 ARM, which is a loan where the rate is fixed for five years before adjusting, saw a more significant jump. This suggests that lenders are becoming more cautious about longer-term fixed rates, perhaps anticipating further upward movement.

While these rates are higher than they were a few months ago (they dipped to around 5.98% in February 2026), they're still not at their highest point this year. We saw rates inching towards 6.75% back in May. So, there's some perspective to be had, but the trend lately has been upward.

Why Are Rates Moving Like This? It's Not Just the Fed.

Many people think mortgage rates are directly tied to what the Federal Reserve does with its overnight lending rate. While that influences things, the biggest driver for mortgage rates is actually the 10-year U.S. Treasury note yield. Think of it as the benchmark for longer-term borrowing costs.

Right now, that 10-year Treasury yield is trading around 4.55%. This is a noticeable jump from where it was at the end of last year, which was closer to 4.15%. When investors want more return on their investment in these government bonds, lenders have to increase mortgage rates to stay competitive.

The Big Picture: What's Pushing Yields Up?

So, why is the 10-year Treasury yield climbing? It's a mix of several factors, and understanding them gives you a better handle on where rates might go.

1. Inflation is Stubborn (and Energy Costs Aren't Helping)

This is probably the biggest reason rates are where they are. Inflation fears are keeping a lid on falling bond yields.

  • A Stronger-Than-Expected Economy: The latest jobs report showed that the U.S. economy is still adding jobs, with 172,000 jobs created in May. A healthy job market means people are spending money, and that can keep inflation from cooling down. When the economy is hot, inflation tends to follow.
  • Investor Worries: For lenders and investors who are locking in money for 30 years with a mortgage, they need to be compensated for the risk that inflation will eat away at the value of those future payments. If inflation stays high, they demand higher interest rates.

2. Global Turmoil and Oil Prices

The world stage has a direct impact on our wallets, and unfortunately, it's not in a good way right now.

  • Geopolitical Tensions: Military operations involving Iran have sent crude oil prices soaring, crossing the $115 per barrel mark.
  • The Ripple Effect: When oil prices jump, so do the costs of everything that relies on transportation – shipping, manufacturing, you name it. This surge in energy costs directly fuels inflation concerns here at home. It was a major shock that pushed those 10-year Treasury yields to their highest points in a year and reversed the downward trend we saw in mortgage rates earlier this year.

3. Domestic Debt and Federal Reserve Uncertainty

Our own government's finances and the future direction of interest rate policy also play a significant role.

  • Growing Debt: Big spending and tax packages passed last year have led to a wider U.S. budget deficit. To cover this debt, the U.S. Treasury is issuing a lot more bonds. When there's more supply of something, prices tend to drop, and in the bond market, this means yields go up. More bonds being issued means higher yields to attract buyers, which then pushes mortgage rates higher.
  • What About the Fed? Despite pressure from the President to lower interest rates, the new Federal Reserve Chair, Kevin Warsh, and the persistent economic data suggest that the Fed is likely to hold interest rates steady at their upcoming meeting on June 17. Some experts are even worried that if inflation doesn't cool down, we could see an interest rate hike later this year. This uncertainty can also make markets nervous and contribute to higher yields.

What This Means for You Today

If you're in the market for a home or considering refinancing, it's a good idea to:

  • Get Pre-Approved: Knowing your budget and what you can afford is crucial.
  • Shop Around: Don't just go with the first lender you talk to. Rates can vary significantly between lenders, even on the same day.
  • Understand Your Options: Fixed-rate mortgages offer stability, while ARMs can offer a lower initial rate but come with the risk of future increases.
  • Consider Your Long-Term Goals: How long do you plan to stay in the home? This can influence whether a fixed or adjustable-rate mortgage is a better fit.

The mortgage market is dynamic, and while today's rates are up slightly, understanding the underlying economic forces can help you make more informed decisions. Keep an eye on inflation data and global events, as these will continue to be major influencers of borrowing costs.

🏡 Real Estate Investment in Indiana and Florida

Indianapolis, IN
🏠 Property: Balboa Dr
🛏️ Beds/Baths: 4 Bed • 2 Bath • 1925 sqft
💰 Price: $190,000 | Rent: $1,600
📊 Cap Rate: 8.1% | NOI: $1,277
📅 Year Built: 1963
📐 Price/Sq Ft: $99
🏙️ Neighborhood: C+

VS

Port Charlotte, FL
🏠 Property: Tyler Ave
🛏️ Beds/Baths: 4 Bed • 2 Bath • 1617 sqft
💰 Price: $274,900 | Rent: $1,845
📊 Cap Rate: 5.4% | NOI: $1,231
📅 Year Built: 2023
📐 Price/Sq Ft: $171
🏙️ Neighborhood: A+

Out‑of‑State investors can compare Indiana’s affordable rental with higher cap rate vs Florida’s newer A+ property with stability. Which fits YOUR investment strategy?

We have much more inventory available than what you see on our website – Let us know about your requirement.

📈 Choose Your Winner & Contact Us Today!

Speak to a Norada Investment Counselor (No Obligation):

(800) 611-3060

View All Properties

Build Passive Income & Wealth with Turnkey Rentals in 2026

Mortgage rates remain high in 2026, but rental properties continue to deliver strong cash flow and appreciation. Savvy investors know that turnkey real estate is the path to passive income and long‑term wealth.

Norada Real Estate helps you secure turnkey rental properties designed for immediate cash flow and appreciation—so you can invest smartly regardless of interest rate trends.

🔥 HOT 2026 INVESTMENT LISTINGS JUST ADDED! 🔥
Request a Callback / Fill Out the Form Online

Contact Us

Also Read:

  • Mortgage Rates Predictions Backed by 7 Leading Experts: 2025–2026
  • Mortgage Rate Predictions for the Next 3 Years: 2026, 2027, 2028
  • 30-Year Fixed Mortgage Rate Forecast for the Next 5 Years
  • 15-Year Fixed Mortgage Rate Predictions for Next 5 Years: 2025-2029
  • Will Mortgage Rates Ever Be 3% Again in the Future?
  • Mortgage Rates Predictions for Next 2 Years
  • Mortgage Rate Predictions for Next 5 Years
  • Mortgage Rate Predictions: Why 2% and 3% Rates are Out of Reach
  • How Lower Mortgage Rates Can Save You Thousands?
  • How to Get a Low Mortgage Interest Rate?
  • Will Mortgage Rates Ever Be 4% Again?
Filed Under: Financing, Mortgage Tagged With: mortgage, mortgage rates, Today’s Mortgage Rates

San Diego Housing Market Graph 50 Years: Analysis and Trends

June 9, 2026 by Marco Santarelli

San Diego Housing Market Graph 50 Years

The San Diego housing market graph over the past 50 years tells a captivating tale of booms, busts, and everything in between. As someone who has closely watched this market, I've seen firsthand how it can leave you amazed and bewildered at the same time. Today, we'll break down this rollercoaster ride and try to understand the forces that have shaped San Diego real estate.

San Diego Housing Market Graph: A 50-Year Journey

Here's the graph showing the All-Transactions House Price Index for San Diego MSA.

San Diego Housing Market Graph 50 Years: Analysis and Trends
Source: FRED

The Early Decades: Steady Growth and Shifting Sands (1970s-1980s)

Peeking back at the San Diego housing market graph from 1975, we see the House Price Index hovering around 25.29. This period was marked by relatively steady growth, fueled by a developing economy and a growing population.

Key takeaways from this era:

  • Interest rates played a major role. The 1970s saw high inflation, leading to fluctuating interest rates that sometimes made it tough for buyers to jump into the market.
  • The '80s brought about change. Interest rates started to cool down, making homes more affordable and leading to increased demand. This period saw a significant upward swing in the San Diego housing market graph.

The Boom Years: Riding the Wave (1990s-2000s)

Fast forward to the 1990s, and the San Diego housing market graph takes a dramatic turn upwards. The dot-com boom brought an influx of wealth and jobs to the area, making San Diego a hotbed for real estate investment.

Here's what shaped this period:

  • The rise of the tech industry. San Diego, with its pleasant weather and attractive lifestyle, became a magnet for tech professionals, further driving up demand for housing.
  • Low interest rates made borrowing cheaper. This fueled the fire, making it easier for people to qualify for larger mortgages, further escalating home prices.

By the early 2000s, the San Diego housing market graph was on an unprecedented upward trajectory, with the House Price Index soaring above 300. The market was hot, with properties often receiving multiple offers and selling for well above asking price.

The Correction and Recovery: Weathering the Storm (2007-2012)

The San Diego housing market graph took a sharp downturn in the late 2000s with the onset of the global financial crisis.

Here's what happened:

  • The subprime mortgage crisis. This crisis, triggered by risky lending practices, led to a wave of foreclosures nationwide, including in San Diego.
  • The housing bubble burst. Prices that had risen at an unsustainable pace finally corrected, leading to a steep decline in the San Diego housing market graph.

The recovery in San Diego was relatively swift compared to other parts of the country. By the early 2010s, the San Diego housing market graph began to show signs of life.

The Current Chapter: A New Era of Growth? (2013-Present)

The San Diego housing market graph from 2013 onwards has been characterized by consistent, albeit more measured, growth. The House Price Index, while not reaching the dizzying heights of the early 2000s, has been steadily climbing.

Here's what's shaping the market today:

  • Limited housing supply. San Diego faces a chronic shortage of housing inventory, with demand consistently outstripping supply. This is a key driver of the upward pressure on prices.
  • Strong economic fundamentals. San Diego boasts a diverse and robust economy, with strong job growth in sectors like technology, healthcare, and tourism.

Looking at the Data: A Closer Examination

The data from the U.S. Federal Housing Finance Agency paints a clear picture of the San Diego housing market's journey over the past 50 years.

Let's take a look at some key data points from the All-Transactions House Price Index for San Diego-Chula Vista-Carlsbad, CA (MSA):

Year House Price Index Key Trend
1975 25.29 Steady growth
1985 66.11 Significant upward swing
2000 150.05 Unprecedented upward trajectory
2005 323.78 Peak before the correction
2010 222.72 Beginning of recovery
2020 374.44 Consistent, measured growth
2023 537.85 Continued growth despite rising interest rates

Looking Ahead: What's Next for the San Diego Housing Market?

Predicting the future of any real estate market is like trying to predict the weather – there are a lot of factors at play! However, by studying historical trends, analyzing current market indicators, and considering broader economic factors, we can make some educated guesses.

Here are some key things to watch out for:

  • Interest rates: Rising interest rates can impact affordability and potentially slow down price growth.
  • Inventory levels: A significant increase in housing supply could help moderate price increases.
  • Economic conditions: A strong local economy will likely continue to support demand in the housing market.

Final Thoughts: Navigating Your Path in the San Diego Market

The San Diego housing market has certainly had its share of ups and downs over the past 50 years. But one thing remains constant: San Diego's desirable location, strong economy, and high quality of life continue to make it an attractive place to live. Whether you're a seasoned investor or a first-time homebuyer, understanding the cyclical nature of the market and doing your due diligence is key. Remember, every market cycle presents opportunities, and with careful planning and a long-term perspective, you can navigate the San Diego housing market with confidence.

Related Articles:

  • San Diego Housing Market Forecast 2025: What to Expect
  • San Diego Housing Market: Prices, Trends, Forecast
  • Is San Diego’s Housing Getting Very Expensive: Experts Predict
  • San Diego Housing Market Booms With 9.4% Growth: Expert Predictions
  • San Diego Housing Market Predictions: Soaring and Expensive!
  • San Diego Housing Market Predictions: Prices Skyrocket 11.4%; What's Next?
  • Is San Diego Real Estate a Good Investment?

Filed Under: Growth Markets, Housing Market Tagged With: Housing Market, Housing Market Forecast, san diego

Mortgage Rates Today, June 9, 2026: 30‑Year Refinance Rate Rises by 13 Basis Points

June 9, 2026 by Marco Santarelli

Mortgage Rates Today, July 21, 2026: 30-Year Refinance Rate Drops by 2 Basis Points

As of today, June 9, 2026, the 30-year fixed refinance rate has seen an increase, now standing at 6.85%. This marks a rise of 13 basis points from the previous week's average of 6.72%, according to Zillow's latest data. While this uptick might seem small, it's part of a broader trend that's making refinancing a trickier proposition for many homeowners.

Mortgage Rates Today, June 9, 2026: 30‑Year Refinance Rate Rises by 13 Basis Points

It feels like just yesterday we were talking about rates hovering around 6% and then surging past 7%. Now, we've settled into a bit of a plateau in the mid-6% range, and today's figures show a slight upward nudge. This plateau has created what I like to call a “refinance paradox.” On one hand, more people are looking to refinance than last year, which sounds like good news. But here's the catch: most of us locked in mortgages with rates well below 5% in recent years. This means only a small fraction of homeowners can actually save money by refinancing their current rate and term.

What's Driving These Rate Changes?

Mortgage rates don't just change on a whim; they're deeply connected to the overall health of our economy. Think of them as a thermometer for broader economic conditions.

  • The 10-Year Treasury Yield: It's a common misconception that mortgage rates follow the Federal Reserve's short-term interest rate adjustments directly. In reality, mortgage rates are more closely tied to the yield on the 10-year U.S. Treasury bond. When economic news suggests growth, these bond yields tend to climb, pushing mortgage rates higher.
  • Stubborn Inflation: Inflation remains a persistent challenge. When prices are high, the long-term value of fixed-income investments, like mortgages, decreases. This forces investors to demand higher yields to compensate, which in turn pushes mortgage rates up. We're seeing this play out, keeping rates from dipping back into the 5% range.
  • Global Headwinds: Ongoing international conflicts, particularly in the Middle East, continue to affect oil prices. Higher energy costs ripple through the economy, increasing shipping and production expenses, which fuels inflation expectations and puts upward pressure on mortgage rates.

Refinance Rates at a Glance (as of June 9, 2026, per Zillow)

Here's a quick look at the national averages for refinance rates today:

Loan Type Current Average Rate Change from Previous Week
30-Year Fixed Refinance 6.85% +13 basis points
15-Year Fixed Refinance 5.87% +2 basis points
5-Year ARM Refinance 6.38% -100 basis points

Note: Rates are national averages provided by Zillow and may not reflect your specific loan offer.

Is Refinancing Right for You Today?

Given these shifting rates, it's crucial to be strategic if you're considering a refinance. Gone are the days when a 2% drop in rates was the magic number to trigger a refinance. In today's market, even a 1% reduction can translate into significant monthly savings, potentially hundreds of dollars.

Here’s what I always advise my clients to consider:

  • Your Credit Profile: The advertised rates, like the 6.85% for a 30-year fixed refinance, are typically reserved for borrowers with excellent credit. Before you even start shopping, take a close look at your credit report. Pay down credit card balances and address any recent inquiries. The cleaner your credit, the better your chances of securing the best rates.
  • The 1% Break-Even Rule: Don't dismiss refinancing if you only stand to save 1% on your rate. Calculate your closing costs and divide them by your monthly savings. This will tell you how long it takes to recoup your upfront expenses. If that timeline works for you, it's likely worth exploring.
  • Loan-to-Value (LTV) Ratio and Conforming Limits: Keep an eye on your home's value and your outstanding loan balance. If your loan amount exceeds conforming limits (which are $766,550 in most areas as of now), you'll be looking at “jumbo” loan rates, which are typically higher. Also, try to keep your loan balance below 80% of your home's appraised value to avoid paying for Private Mortgage Insurance (PMI).

My Take on the Current Market

From my perspective, this period of fluctuating but generally elevated rates requires patience and a sharp eye. The refinance market isn't as broad as it was a couple of years ago, but for those who can still benefit, acting with informed caution is key. It’s not about chasing the lowest possible rate, but about finding a rate that makes financial sense for your unique situation.

The 5-year Adjustable Rate Mortgage (ARM) refinance rate dropping a full percentage point to 6.38% is certainly noteworthy. This could be an attractive option for those who plan to sell or refinance again before the fixed period ends. However, it’s crucial to understand the risks associated with ARMs, as rates can increase after the initial fixed period.

Ultimately, the decision to refinance is deeply personal. It depends on your financial goals, your risk tolerance, and the specific numbers for your situation. Today's slight uptick in 30-year fixed rates is a reminder that the market is dynamic. Staying informed and working with a trusted advisor will be your best bet for navigating these waters successfully.

🏡 Out-of-state turnkey real estate investments

Helena, AL
🏠 Property: Village Pkwy
🛏️ Beds/Baths: 3 Bed • 2.5 Bath • 1500 sqft
💰 Price: $300,000 | Rent: $1,925
📊 Cap Rate: 6.4% | NOI: $1,608
📅 Year Built: 2025
📐 Price/Sq Ft: $200
🏙️ Neighborhood: B

VS

Nashville, TN
🏠 Property: Winton Dr
🛏️ Beds/Baths: 3 Bed • 2.5 Bath • 1688 sqft
💰 Price: $360,000 | Rent: $2,100
📊 Cap Rate: 5.5% | NOI: $1,662
📅 Year Built: 2001
📐 Price/Sq Ft: $214
🏙️ Neighborhood: A

Alabama’s newer rental with solid cap rate vs Tennessee’s established A‑rated property with stability. Which fits YOUR investment strategy?

We have much more inventory available than what you see on our website – Let us know about your requirement.

📈 Choose Your Winner & Contact Us Today!

Speak to a Norada Investment Counselor (No Obligation):

(800) 611-3060

View All Properties

Build Passive Income & Wealth with Turnkey Rentals in 2026

Mortgage rates remain high in 2026, but rental properties continue to deliver strong cash flow and appreciation. Savvy investors know that turnkey real estate is the path to passive income and long‑term wealth.

Norada Real Estate helps you secure turnkey rental properties designed for immediate cash flow and appreciation—so you can invest smartly regardless of interest rate trends.

🔥 HOT 2026 INVESTMENT LISTINGS JUST ADDED! 🔥
Request a Callback / Fill Out the Form Online

Contact Us

Also Read:

  • Mortgage Rates Predictions Backed by 7 Leading Experts: 2025–2026
  • Mortgage Rate Predictions for the Next 3 Years: 2026, 2027, 2028
  • 30-Year Fixed Mortgage Rate Forecast for the Next 5 Years
  • 15-Year Fixed Mortgage Rate Predictions for Next 5 Years: 2025-2029
  • Will Mortgage Rates Ever Be 3% Again in the Future?
  • Mortgage Rates Predictions for Next 2 Years
  • Mortgage Rate Predictions for Next 5 Years
  • Mortgage Rate Predictions: Why 2% and 3% Rates are Out of Reach
  • How Lower Mortgage Rates Can Save You Thousands?
  • How to Get a Low Mortgage Interest Rate?
  • Will Mortgage Rates Ever Be 4% Again?

Filed Under: Financing, Mortgage Tagged With: mortgage rates, Mortgage Rates Today, Refinance Rates

30-Year Fixed Mortgage Rate Drops by 37 Basis Points Year-Over-Year

June 9, 2026 by Marco Santarelli

30-Year Fixed Mortgage Rate Drops by 37 Basis Points Year-Over-Year

The latest numbers from Freddie Mac are certainly encouraging for anyone dreaming of homeownership. For the week ending June 4, 2026, the average rate for a 30-year fixed mortgage landed at 6.48%. This is a significant 37 basis point drop from where we were a year ago. And looking at the most immediate data, that rate also saw a slight dip of 0.05% just in the last week.

This combination of year-over-year and weekly improvement is more than just a number; it’s a tangible boost to affordability for many potential homeowners. This dip, while perhaps not a dramatic plunge, is a welcome breath of fresh air. It’s the kind of movement that can tip the scales for someone who’s been on the fence, or help make a move possible for those who thought they couldn't afford it.

30-Year Fixed Mortgage Rate is Down by 37 Basis Points Year-Over-Year

What Does This Rate Drop Really Mean for You?

Let’s break down what this 37 basis point (which is the same as 0.37%) drop actually signifies. Freddie Mac's Primary Mortgage Market Survey (PMMS) is the gold standard for tracking these rates, and their data shows that the average 30-year fixed-rate mortgage was at 6.85% for the same week in 2025. Fast forward a year, and we're now at 6.48%.

On the surface, that might not seem like a huge difference, but when you're talking about a loan that lasts 30 years, even small percentage points add up. My experience tells me that people often underestimate the power of these seemingly minor rate changes, especially when considering the long-term financial impact.

30-Year Fixed Mortgage Rate is Down by 37 Basis Points Year-Over-Year
Freddie Mac

Calculating the Savings: A Look at the Numbers

To really understand the impact, let's look at a common scenario. Imagine you're taking out a $400,000 mortgage.

  • Last Year (at 6.85%): Your monthly principal and interest payment would have been approximately $2,621.04.
  • This Year (at 6.48%): Your monthly payment drops to about $2,523.01.

That's a saving of nearly $98.03 per month. Now, $98 might not sound like life-changing money on its own, but over the course of a 30-year loan, that adds up to a staggering $35,290.80 in total savings on interest alone! That’s a significant chunk of change that can go towards other financial goals, home improvements, or simply provide a little more breathing room in your budget.

Here's a table showing how this savings plays out for different loan amounts:

Home Loan Amount 2025 Payment (6.85%) 2026 Payment (6.48%) Monthly Savings 30-Year Lifetime Savings
$300,000 $1,965.78 $1,892.26 $73.52 $26,467.20
$400,000 $2,621.04 $2,523.01 $98.03 $35,290.80
$500,000 $3,276.30 $3,153.77 $122.53 $44,110.80

As you can see, the larger your loan, the more significant the savings become.

Beyond the 30-Year Fixed: Other Rates to Consider

While the 30-year fixed is the most popular for its predictable payments, it's worth noting how other mortgage products are performing. The 15-year fixed-rate mortgage, a great option for those looking to pay off their home faster and save more on interest, has also seen a dip. For the week ending June 4, 2026, it averaged 5.79%, down from 5.87% the previous week. Year-over-year, this is a 20 basis point decrease from 5.99% in 2025.

Here’s a quick snapshot from Freddie Mac:

Mortgage Type Week Ending 06/04/2026 Previous Week Year-over-Year Change
30-Yr FRM 6.48% 6.53% -0.37%
15-Yr FRM 5.79% 5.87% -0.20%

This tells me that the broader trend is one of moderating interest rates, which is generally positive for the housing market.

Why Are Rates Moving Down? The Economic Picture

According to Sam Khater, Chief Economist at Freddie Mac, this slight drop into the mid-6% range is offering some much-needed breathing room for homebuyers. He points out that national income growth is currently outpacing home price appreciation. This is a critical factor for affordability. When your paycheck grows faster than the cost of the house, it makes buying a home feel more achievable.

It’s not just Freddie Mac's numbers telling this story. Broader affordability indexes, like the First American Real House Price Index (RHPI), are also showing that these lower year-over-year rates are contributing to modest affordability gains in major U.S. cities. This suggests a more widespread, albeit gradual, improvement in the housing market's accessibility.

Looking ahead, forecasts from organizations like the Mortgage Bankers Association (MBA) suggest that these 30-year rates are likely to fluctuate between 6.1% and 6.3% for the rest of 2026. This prediction is based on the expectation that inflation pressures will continue to stabilize, which is a good sign for borrowers.

My Take: A Balanced Outlook for Buyers

From my perspective, this is a really encouraging development for anyone considering buying a home. The combination of slightly lower mortgage rates and rising incomes creates a more favorable environment than we've seen in some time. It’s important to remember that the housing market is complex, and many factors influence prices and rates. However, this move downwards in mortgage rates is a significant positive signal.

It's not a time for wild speculation, but rather a moment for thoughtful consideration. If you've been waiting for a better opportunity to enter the housing market, now might be the time to start seriously exploring your options. Getting pre-approved for a mortgage and speaking with a trusted real estate agent can give you a clearer picture of what you can afford in today's market.

The fact that rates have decreased by 37 basis points year-over-year on the 30-year fixed mortgage is a clear indication that the market is responding to economic conditions in a way that benefits borrowers. It’s a gentle nudge in the right direction, making that dream home feel a little closer and a lot more affordable.

🏡 Rental Real Estate Investment: Indiana vs Florida

Indianapolis, IN
🏠 Property: Balboa Dr
🛏️ Beds/Baths: 4 Bed • 2 Bath • 1925 sqft
💰 Price: $190,000 | Rent: $1,600
📊 Cap Rate: 8.1% | NOI: $1,277
📅 Year Built: 1963
📐 Price/Sq Ft: $99
🏙️ Neighborhood: C+

VS

Port Charlotte, FL
🏠 Property: Tyler Ave
🛏️ Beds/Baths: 4 Bed • 2 Bath • 1617 sqft
💰 Price: $274,900 | Rent: $1,845
📊 Cap Rate: 5.4% | NOI: $1,231
📅 Year Built: 2023
📐 Price/Sq Ft: $171
🏙️ Neighborhood: A+

Out‑of‑State investors can compare Indiana’s affordable rental with higher cap rate vs Florida’s newer A+ property with stability. Which fits YOUR investment strategy?

We have much more inventory available than what you see on our website – Let us know about your requirement.

📈 Choose Your Winner & Contact Us Today!

Speak to a Norada Investment Counselor (No Obligation):

(800) 611-3060

View All Properties

Build Passive Income & Wealth with Turnkey Rentals

Mortgage rates remain near 6%, but rental properties continue to deliver strong cash flow and appreciation. Savvy investors know that turnkey real estate is the path to passive income and long‑term wealth.

Norada Real Estate helps you secure turnkey rental properties designed for immediate cash flow and appreciation—so you can invest smartly regardless of interest rate trends.

🔥 HOT INVESTMENT Properties JUST ADDED! 🔥
Request a Callback / Fill Out the Form Online

Contact Us

Also Read:

  • Will Mortgage Rates Drop to 5% in 2026: Expert Forecast
  • How to Get a 3% Mortgage Rate in 2026 With Assumable Mortgages?
  • How to Get a 4% Interest Rate on a Mortgage in 2026?
  • What Leading Housing Experts Predict for Mortgage Rates in 2026
  • Mortgage Rate Predictions for 2026: What Leading Forecasters Expect
  • Mortgage Rate Predictions for the Next 3 Years: 2026, 2027, 2028
  • 30-Year Fixed Mortgage Rate Forecast for the Next 5 Years
  • 15-Year Fixed Mortgage Rate Predictions for Next 5 Years: 2025-2029
  • Will Mortgage Rates Ever Be 3% Again in the Future?
  • Mortgage Rates Predictions for Next 2 Years
  • Mortgage Rate Predictions for Next 5 Years
  • Mortgage Rate Predictions: Why 2% and 3% Rates are Out of Reach
  • How Lower Mortgage Rates Can Save You Thousands?
  • How to Get a Low Mortgage Interest Rate?
  • Will Mortgage Rates Ever Be 4% Again?

Filed Under: Financing, Mortgage Tagged With: 30-Year Fixed Mortgage Rate, mortgage, mortgage rates

Today’s Mortgage Rates, June 8: 30‑Year Fixed 6.38%, Refinancing Becomes Tougher

June 8, 2026 by Marco Santarelli

Today's Mortgage Rates, July 21: Buyers Catch a Small Break as 30‑Year Fixed Dips to 6.40%

As of Monday, June 8, 2026, the average rate for a 30-year fixed-rate mortgage is hovering around 6.38%, according to Zillow's latest data. This means that securing a home loan today will likely cost you a bit more than it did just a few months ago, but it's still a far cry from the dizzying highs we saw previously. Understanding these numbers is crucial for anyone looking to buy a home or refinance their existing mortgage.

Today's Mortgage Rates, June 8: 30‑Year Fixed 6.38%, Refinancing Becomes Tougher

It's easy to get lost in the numbers, but I find it helpful to break down what these rates mean for different loan types. Zillow provides a clear picture of where things stand today:

Loan Type Today's Rate (June 8, 2026)
30-year fixed 6.38%
20-year fixed 6.39%
15-year fixed 5.74%
5/1 ARM 6.32%
7/1 ARM 6.25%
30-year VA 5.81%
15-year VA 5.38%
5/1 VA 5.63%

As you can see, the 30-year fixed rate is slightly higher than the weekly average, while the 15-year fixed rate is just a hair lower. For those considering Adjustable-Rate Mortgages (ARMs), the 5/1 ARM is at 6.32% and the 7/1 ARM is at 6.25%. And for our veterans, VA loan rates remain particularly attractive, with the 30-year VA at 5.81% and the 15-year VA at a very competitive 5.38%.

Why Are Rates Where They Are Today?

The mortgage rate you're offered isn't just a random number; it's a complex equation influenced by a multitude of factors. While national averages give us a general idea, your personal situation is key.

I've learned over the years that lenders look at several critical components of your financial health. First and foremost is your credit score. A score of 740 or higher is generally what you'll need to snag those advertised rock-bottom rates. Then there's your down payment. Putting down 20% or more not only reduces your loan amount but also signals to the lender that you're a lower risk, which can translate into a better rate. Your debt-to-income (DTI) ratio is also a big one. A lower DTI shows you can comfortably manage your mortgage payments. Lastly, geography plays a role; rates can vary by state, sometimes being higher in more expensive housing markets.

The Big Picture: What's Moving the Market?

Looking at the broader economic picture, average U.S. mortgage rates for a 30-year fixed loan are currently sitting between 6.35% and 6.55%. This is a moderate improvement from the nearly 7% peaks we saw in early 2025, but it's a significant jump from the three-year lows of around 5.98% we experienced in late February 2026.

What's causing this push and pull in the market? I see a few major forces at play:

  • Inflation Fears and Oil Prices: Geopolitical events, particularly the ongoing conflict involving Iran, have sent oil prices soaring. When energy costs rise, it ripples through the economy, increasing production and shipping expenses. This directly fuels inflation expectations. Investors, understandably, want higher long-term yields to protect their money from losing purchasing power.
  • Treasury Yields on the Move: Mortgage rates don't directly follow the Federal Reserve's short-term rates. Instead, they closely mirror the yield on the 10-year U.S. Treasury note. Recently, these yields have spiked, settling around 4.53% to 4.55%. When investors become wary of market risks, they tend to sell bonds. This drives down bond prices and, consequently, spikes their yields. Lenders quickly adjust mortgage rates upward to maintain attractive returns for investors.
  • The Federal Reserve's Tightrope Walk: Although the Fed did implement rate cuts throughout 2024 and 2025, they've held short-term rates steady for now. The market is understandably anxious, trying to predict the Fed's next move. With persistent inflation still above the 2% target and a recent leadership change at the central bank, signals suggest they might hold rates steady, but they've also kept the door open to potential rate hikes if consumer prices don't cool down.
  • Government Borrowing and Bond Supply: The national deficit is growing, and Congress has passed legislation that's expanding it further. To fund this deficit, the U.S. Treasury is releasing a huge supply of new government bonds. To attract buyers for this large volume of debt, they need to offer higher yields. This, in turn, pushes up borrowing costs across the entire housing sector.

My Take: What This Means for You

From my perspective, the current mortgage rate environment is a classic example of the market reacting to uncertainty. We're seeing a tug-of-war between the desire for lower borrowing costs and the realities of inflation and global economic pressures.

For potential homebuyers, it means being prepared. Your credit score, down payment, and DTI ratio are more important than ever. Getting pre-approved is your first and most crucial step, as it locks in a rate for a period and gives you a clear understanding of your borrowing power. Don't be afraid to shop around and compare offers from multiple lenders. Even a small difference in interest rate can save you tens of thousands of dollars over the life of your loan.

For those considering refinancing, it's a more nuanced decision. If you secured a rate significantly lower than today's offerings, refinancing might not make sense right now unless you plan to stay in your home for a very long time. However, if your current rate is higher, or if you need to tap into your home's equity, it's still worth exploring.

The key takeaway for me is that while we can't control the market, we can control our preparation. Understanding these factors will empower you to make the best decision for your financial future.

🏡 Real Estate Investment in Indiana and Florida

Indianapolis, IN
🏠 Property: Balboa Dr
🛏️ Beds/Baths: 4 Bed • 2 Bath • 1925 sqft
💰 Price: $190,000 | Rent: $1,600
📊 Cap Rate: 8.1% | NOI: $1,277
📅 Year Built: 1963
📐 Price/Sq Ft: $99
🏙️ Neighborhood: C+

VS

Port Charlotte, FL
🏠 Property: Tyler Ave
🛏️ Beds/Baths: 4 Bed • 2 Bath • 1617 sqft
💰 Price: $274,900 | Rent: $1,845
📊 Cap Rate: 5.4% | NOI: $1,231
📅 Year Built: 2023
📐 Price/Sq Ft: $171
🏙️ Neighborhood: A+

Out‑of‑State investors can compare Indiana’s affordable rental with higher cap rate vs Florida’s newer A+ property with stability. Which fits YOUR investment strategy?

We have much more inventory available than what you see on our website – Let us know about your requirement.

📈 Choose Your Winner & Contact Us Today!

Speak to a Norada Investment Counselor (No Obligation):

(800) 611-3060

View All Properties

Build Passive Income & Wealth with Turnkey Rentals in 2026

Mortgage rates remain high in 2026, but rental properties continue to deliver strong cash flow and appreciation. Savvy investors know that turnkey real estate is the path to passive income and long‑term wealth.

Norada Real Estate helps you secure turnkey rental properties designed for immediate cash flow and appreciation—so you can invest smartly regardless of interest rate trends.

🔥 HOT 2026 INVESTMENT LISTINGS JUST ADDED! 🔥
Request a Callback / Fill Out the Form Online

Contact Us

Also Read:

  • Mortgage Rates Predictions Backed by 7 Leading Experts: 2025–2026
  • Mortgage Rate Predictions for the Next 3 Years: 2026, 2027, 2028
  • 30-Year Fixed Mortgage Rate Forecast for the Next 5 Years
  • 15-Year Fixed Mortgage Rate Predictions for Next 5 Years: 2025-2029
  • Will Mortgage Rates Ever Be 3% Again in the Future?
  • Mortgage Rates Predictions for Next 2 Years
  • Mortgage Rate Predictions for Next 5 Years
  • Mortgage Rate Predictions: Why 2% and 3% Rates are Out of Reach
  • How Lower Mortgage Rates Can Save You Thousands?
  • How to Get a Low Mortgage Interest Rate?
  • Will Mortgage Rates Ever Be 4% Again?
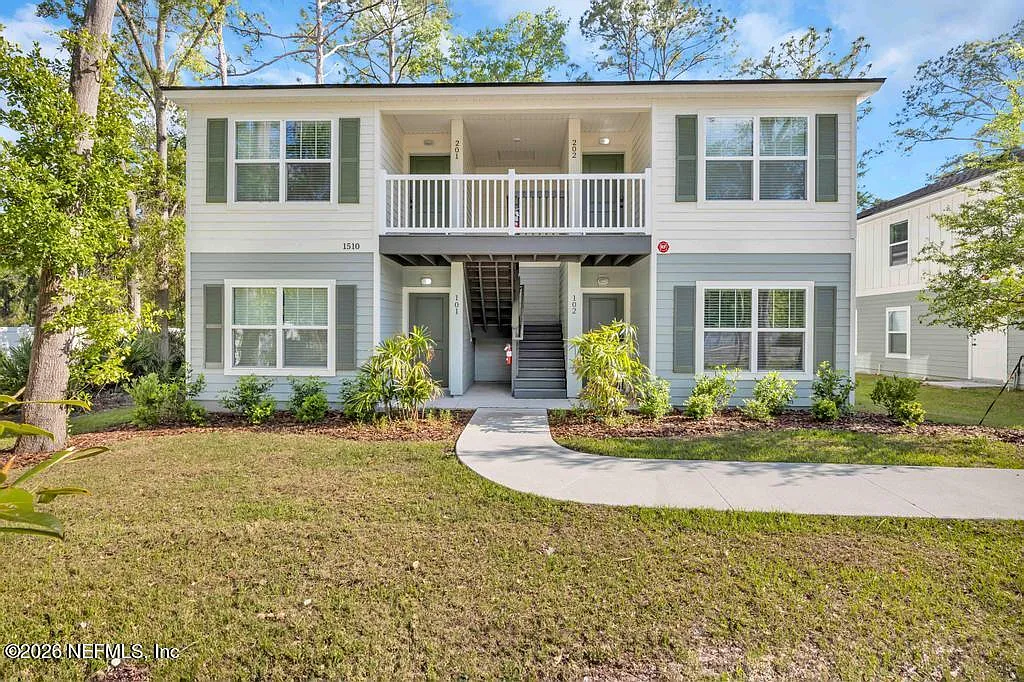
Filed Under: Financing, Mortgage Tagged With: mortgage, mortgage rates, Today’s Mortgage Rates

  • « Previous Page
  • 1
  • …
  • 12
  • 13
  • 14
  • 15
  • 16
  • …
  • 377
  • Next Page »

Real Estate

  • Birmingham
  • Cape Coral
  • Charlotte
  • Chicago

Quick Links

  • Markets
  • Membership
  • Notes
  • Contact Us

Blog Posts

  • Best Real Estate Markets for First-Time Investors in 2026
    July 21, 2026Marco Santarelli
  • Today’s Mortgage Rates, July 21: Buyers Catch a Small Break as 30‑Year Fixed Dips to 6.40%
    July 21, 2026Marco Santarelli
  • Best Places to Invest in Real Estate for the Next 5 Years (2026-2030)
    July 21, 2026Marco Santarelli

Contact

Norada Real Estate Investments 30251 Golden Lantern, Suite E-261 Laguna Niguel, CA 92677

(949) 218-6668
(800) 611-3060
BBB
  • Terms of Use
  • |
  • Privacy Policy
  • |
  • Testimonials
  • |
  • Suggestions?
  • |
  • Home

Copyright 2018 Norada Real Estate Investments

Loading...