Norada Real Estate Investments

  • Home
  • Markets
  • Properties
  • Membership
  • Podcast
  • Learn
  • About
  • Contact

Today’s Mortgage Rates Fall After Jobs Report – December 7, 2024

December 7, 2024 by Marco Santarelli

Today's Mortgage Rates Fall After Jobs Report December 7, 2024

In a significant development for the housing market, today's mortgage rates dopped after the jobs report, reflecting a pivotal shift in the borrowing landscape. For the second consecutive week, mortgage rates have decreased, reaching their lowest levels since October.

The average rate for a 30-year fixed mortgage has fallen to 6.69%, down from 6.81% last week and a stark contrast to the 7.03% recorded one year ago. This shift signals a responsive market reacting to economic data, potentially benefiting millions of homebuyers looking to navigate an increasingly complex housing environment.

Today's Mortgage Rates Drop After Jobs Report

Key Takeaways

  • Mortgage rates decreased to 6.69% for a 30-year fixed mortgage, marking the lowest levels since October.
  • Purchase applications have risen, suggesting improved demand due to lower rates amid a persistent affordability crisis.
  • The Federal Reserve's monetary policy plays a critical role in shaping future mortgage rates.
  • Job market data significantly impacts financial decisions for both lenders and borrowers.

Mortgage Rates Overview

Recent reports indicate a continued decline in mortgage rates, indicating a potential respite for homebuyers. According to the latest data from Freddie Mac's Primary Mortgage Market Survey, the average rate for a 30-year fixed mortgage fell to 6.69%, the lowest level observed in over a month. This decline follows a rate held for months over the 7% mark, which has significantly impacted borrower sentiment and housing market activity.

The data indicates other positive trends. The average rate on a 15-year fixed mortgage also dropped from 6.10% to 5.96%, further illustrating the overall downtrend in borrowing costs. Such reductions can make a substantial difference in monthly payments, resulting in significant savings for homeowners or potential buyers.

In the context of the broader housing crisis, these lower rates could motivate potential buyers who have been on the sidelines, awaiting more favorable borrowing conditions. Despite these improvements, the real estate landscape is still riddled with challenges, particularly concerning affordability in many markets.

The Impact of Labor Market Data

The recent jobs report, which indicated that employers added a substantial 227,000 jobs in November, provides a vital insight into the economy's health. The growth figures are impressive, but they come with mixed implications for mortgage rates. A strong job market typically raises inflation concerns, where increased consumer spending might prompt the Federal Reserve to consider interest rate hikes to manage economic growth.

As noted in a detailed report from Mortgage Rates Fall More Than Expected After Jobs Report, Sam Khater, Freddie Mac’s chief economist, highlights the critical relationship between job growth and housing demand. He remarked that “this week, mortgage rates decreased to their lowest level in over a month… the responsiveness of prospective homebuyers to even small changes in rates illustrates that affordability headwinds persist.”

Despite the healthy job additions, many households still face challenges, as a significant portion of current mortgage holders (around 80%) enjoy rates below 5%. This disparity complicates the decisions for would-be buyers and sellers, as many existing homeowners may be hesitant to move and lose their favorable rates.

Understanding the Factors Affecting Mortgage Rates

Several elements contribute to the fluctuations seen in mortgage rates. A primary driver is the bond market, particularly the yield on U.S. Treasury bonds. When investors expect increased economic activity, they may sell off bonds, leading to rising yields and higher mortgage rates. Conversely, if economic indicators show signs of weakness or uncertainty, rates can fall as investors seek safety in bonds, pushing yields down.

The interplay between job growth and the overall unemployment rate also plays a significant role. If the jobless rate decreases and wage growth occurs, it can boost consumer confidence, leading to increased spending on homes. However, a sudden spike in job creation, as reported, can also lead to speculation about future inflation. The Federal Reserve's anticipated responses to inflation reflect back on mortgage rates, as increased rates aim to curb inflationary pressures and stabilize the economy.

How the Change Affects Buyers and Sellers

The recent drop in mortgage rates provides a beacon of hope for many homebuyers, who have historically faced high borrowing costs. A 6.69% mortgage rate means that a $300,000 loan would result in approximately $1,934 per month in principal and interest payments compared to $1,967 per month with a previous 6.81% rate, allowing buyers to save about $33 monthly. While this may seem like a minor amount, over the longevity of a 30-year mortgage, the savings can accumulate significantly.

The interplay of rates and housing availability creates a unique environment for sellers as well. On one hand, homeowners who have secured lower rates might decide to stay put instead of selling, fearing they could miss out on favorable financing if they trade up. On the other hand, the hope of lower mortgage rates could entice homeowners to list their homes, potentially leading to increased market activity.

Future Expectations for Mortgage Rates

As we look ahead, the outlook for mortgage rates remains uncertain but intriguing. While the recent drop provides relief to buyers, ongoing fluctuations are expected as the economy reacts to both job growth and inflation concerns. Many analysts anticipate that the Federal Reserve may consider adjusting rates further based on economic conditions, which could lead to more changes in mortgage interest rates.

The Federal Reserve's upcoming meetings will be critical. Any signals indicating a change in monetary policy can influence market sentiment. If the Fed takes a more dovish stance, signaling a willingness to step back from aggressive rate increases, we could see continued dips in mortgage rates, encouraging higher demand for housing as well.

Recommended Read:

Mortgage Rates Predictions December 2024: Will Rates Fall? 

Mortgage Rates Predicted to Stay Above 6% in 2025: Realtor.com 

Reactions from the Real Estate Market

The housing market significantly reflects broader economic conditions. Responses from homebuyers suggest resilience, even amidst ongoing affordability challenges. Whether it is first-time buyers anxious to enter the market or existing homeowners looking to capitalize on favorable rates, the demand remains strong.

As observed, Sam Khater’s insights into homebuyer responsiveness highlight the urgent need for accessible and affordable housing solutions. In many areas, especially where demand outstrips supply, the challenges remain. The current economic signals suggest that while lower rates provide an opportunity, systemic issues in the housing market won’t be resolved swiftly.

Conclusion

The drop in today's mortgage rates marks a significant moment for both prospective homebuyers and the real estate market as a whole. As lower borrowing costs lure buyers, market dynamics will continue to shift, influenced heavily by ongoing economic indicators.

The resilience of the job market and its implications for inflation, alongside Federal Reserve policy, will play crucial roles in shaping future mortgage rates. Buyers should remain vigilant and up-to-date with both economic news and mortgage trends to make informed decisions in this ever-changing landscape.

Partner with Norada, Your Trusted Source for Turnkey Investment Properties

Discover high-quality, ready-to-rent properties designed to deliver consistent returns. Contact us today to expand your real estate portfolio with confidence.

Reach out to our investment counselors:

(949) 218-6668 | (800) 611-3060

Contact Us Today


Recommended Read:

  • Half of Recent Home Buyers Got Mortgage Rates Below 5%
  • Mortgage Rates Need to Drop by 2% Before Buying Spree Begins
  • Mortgage Rates Predictions for the Next Three Months Q4 2024
  • Mortgage Rates Predictions for 2025: Expert Forecast
  • Prediction: Why Mortgage Rates Won’t Go Below 6% in 2024?
  • Will Mortgage Rates Ever Be 3% Again: Future Outlook
  • Mortgage Rates Predictions for Next 2 Years
  • Mortgage Rate Predictions for Next 5 Years
  • Prediction: Interest Rates Falling Below 6% Will Explode the Housing Market
  • Mortgage Rate Predictions: Why 2% and 3% Rates are Out of Reach
  • How Lower Mortgage Rates Can Save You Thousands?
  • How to Get a Low Mortgage Interest Rate?
  • Will Mortgage Rates Ever Be 4% Again?
Filed Under: Financing, Mortgage Tagged With: Interest Rate, mortgage, mortgage rates, Mortgage Rates Predictions

Which Banks Are in Danger of Failing or Collapse (2024)

December 4, 2024 by Marco Santarelli

List of Bank Failures

The past year has seen a shakeup in the financial world, with several prominent bank failures raising concerns about the stability of the banking sector in 2024. There were 567 bank failures from 2001 through 2024. While predicting specific institutions in danger of collapse is difficult, we can explore the current climate and identify potential risk factors.

The collapses of Silicon Valley Bank, Signature Bank, and others in 2023 sent shockwaves through the industry. These failures were attributed to a combination of factors, including:

  • Unrealized Investment Losses: Banks hold investment securities, and significant drops in their value can erode a bank's capital base.
  • Overreliance on Uninsured Deposits: Deposits exceeding FDIC insurance limits leave banks more vulnerable if a crisis triggers a run on deposits.

The Federal Deposit Insurance Corporation (FDIC) maintains a list of failed banks [FDIC Failed Bank List], which serves as a reference point for past events.

186 Banks Are in Danger of Failing?

A report posted on the Social Science Research Network found that 186 banks in the United States are at risk of failure or collapse due to rising interest rates and a high proportion of uninsured deposits.

The report titled ‘Monetary Tightening and US Bank Fragility in 2023: Mark-to-Market Losses and Uninsured Depositor Runs?' estimated the market value loss of individual banks' assets during the Federal Reserve's rate-increasing campaign.

The study also examined the proportion of banks' funding that comes from uninsured depositors with accounts worth over $250,000. This blog post aims to explore the implications of the report and why it matters to buyers and sellers.

According to the report, if half of the uninsured depositors quickly withdrew their funds from these 186 banks, even insured depositors may face impairments as the banks would not have enough assets to make all depositors whole. This could potentially force the Federal Deposit Insurance Corporation (FDIC) to step in.

The failure of Silicon Valley Bank serves as an example of the risks posed by rising interest rates and uninsured deposits. The bank's assets lost value due to the rate increases and worried customers withdrew their uninsured deposits. As a result, the bank failed to meet its obligations to its depositors and was forced to close.

The report noted that “Even if only half of the uninsured depositors decide to withdraw, almost 190 banks are at potential risk of impairment to insured depositors, with potentially $300 billion of insured deposits at risk. If uninsured deposit withdrawals cause even small fire sales, substantially more banks are at risk.” The economists who conducted the study warned that these 186 banks are at risk of a similar fate without government intervention or recapitalization.

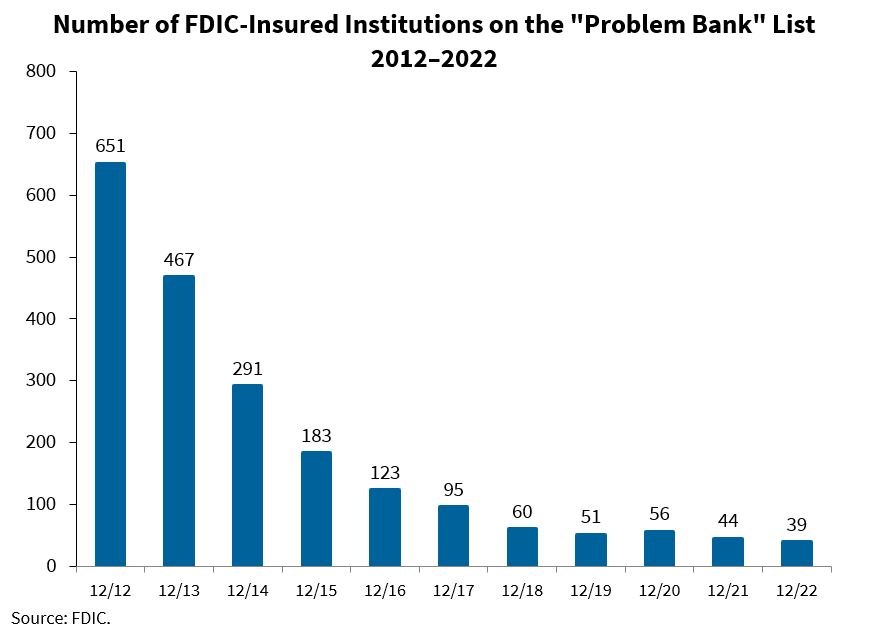
Number of FDIC-Insured Institutions on the “Problem Bank” List

The number of FDIC-insured institutions on the “Problem Bank” list has continued to decline over the years. In 2012, there were 651 problem banks, which decreased to 467 in 2013, 291 in 2014, and 183 in 2015. The trend continued with 123 problem banks in 2016, 95 in 2017, and 60 in 2018. By the end of 2019, there were 51 problem banks, and the number slightly increased to 56 in 2020. However, in 2021, the number dropped to 44. Looking ahead to 2022, the number of problem banks continued to decline, reaching 39 by the end of the year. This decline in problem banks is a positive trend for the banking industry and the economy as a whole.

Month/Year  Number of Problem Banks
12/12 651
12/13 467
12/14 291
12/15 183
12/16 123
12/17 95
12/18 60
12/19 51
12/20 56
12/21 44
12/22 39

As of 2023, the latest available data on the number of FDIC-insured institutions on the “Problem Bank” list is for the year-end 2022. According to the FDIC's reports, the number of problem banks continued to decline, reaching 39 by the end of 2022. This is a positive trend for the banking industry, indicating its stability and resilience amidst various economic challenges. The banking industry will continue to face risks and uncertainties, but the decreasing trend in problem banks demonstrates the effectiveness of the regulatory framework in ensuring the safety and soundness of the financial system.

Number of FDIC-Insured Institutions on the "Problem Bank" List

Monthly List of Banks Examined for CRA Compliance – June 2024

The Monthly List of Banks Examined for CRA Compliance is a list issued by the Federal Deposit Insurance Corporation (FDIC) that provides information on state nonmember banks that have been recently evaluated for compliance with the Community Reinvestment Act (CRA). The list is issued monthly and includes the names of banks that have been examined for CRA compliance, along with the date of the examination.

The list is used by regulators, community organizations, and the public to monitor the performance of banks in meeting the credit needs of their communities. The list is also used by banks to assess their own performance and to identify areas where they need to improve. The list is available on the FDIC website and can be accessed by the public.

You can access the list here – Monthly List of Banks Examined for CRA Compliance

Banks are examined for CRA compliance every 12 to 36 months, depending on their asset size and rating. The examination frequency schedule used by the FDIC incorporates changes required by the Gramm-Leach-Bliley Act of 1999 (GLBA). Banks with assets greater than or equal to $250 million may be examined in advance of the examination mandate date since the GLBA frequency requirements do not apply to them.

Banks with assets of $250 million or less and a “Satisfactory” CRA rating are subject to a CRA examination no more than once every 48 months, while those with a “Needs to Improve” or “Substantial Noncompliance” rating are examined every 12 months. Banks with an “Outstanding” or “Satisfactory” rating of 1 or 2 are examined every 36 months, while those with a rating of 3, 4, or 5 are examined every 12 months.

The OCC conducts a CRA examination of a national bank every three years. The FDIC issues a Monthly List of Banks Examined for CRA Compliance, which includes the names of banks that have been examined for CRA compliance, along with the date of the examination.

Potential Impact of Such Bank Failures

The findings of the report highlight the importance of careful risk management and diversification of funding sources for banks to ensure their stability in the face of market fluctuations. Buyers and sellers of banking assets should carefully evaluate the risks associated with uninsured deposits and the potential impact of rising interest rates on bank assets.

The failure of Silicon Valley Bank serves as a cautionary tale for the banking industry, and it is essential to take proactive steps to mitigate the risks posed by these factors. The government may also need to step in to prevent a similar fate for the 186 banks identified in the report.

The potential impact of nearly 200 banks being at risk for the same fate as Silicon Valley Bank could be significant for the banking sector and the broader economy. If a large number of these banks were to fail, it could lead to a domino effect, causing other banks to fail as well. This could lead to a credit crunch, making it difficult for businesses and consumers to access credit and slowing economic growth.

In addition, a bank run on one of these vulnerable institutions could cause a ripple effect, causing depositors to withdraw funds from other banks as well. This could lead to a broader panic and a loss of confidence in the banking system as a whole, potentially leading to a recession or even a financial crisis. The federal government's promise to back all depositors in these banks is a step in the right direction to help prevent a wider panic.

However, this may not be enough to prevent a bank run if customers believe that the bank is insolvent. It is important for regulators and policymakers to monitor the situation closely and take action to prevent further bank failures. This could include recapitalizing vulnerable banks or providing government guarantees to support their operations. Overall, the situation highlights the importance of a stable banking system and the need for effective risk management practices in the financial sector.

ALSO READ:

Bank Failures: Why it Can’t Crash Real Estate?

Is Bank of America Safe From Collapse or Trouble?

Signature Bank Failure 2023: FDIC Plans to Sell its Housing Loans

List of Failed Banks in the United States 

Banking Crisis Explained: Causes of Bank Collapse & its Prevention


Sources:

  • https://papers.ssrn.com/sol3/papers.cfm?abstract_id=4387676
  • https://www.fdic.gov/analysis/quarterly-banking-profile/qbp/2022dec/chartdif2.xlsx
  • https://www.businesstoday.in/industry/banks/story/186-us-banks-at-risk-of-failure-similar-to-silicon-valley-bank-says-research-heres-why-373895-2023-03-18

Filed Under: Banking, Economy, Financing Tagged With: Bank Failures, Banking Collapse, Banks in Trouble

List of Recent Failed Banks in the United States (2023-2024)

December 4, 2024 by Marco Santarelli

List of Bank Failures

Uncertain if recent bank failures have impacted you? This list details US banks closed by regulators in 2023 and 2024. It's never good news when we hear about a bank failure, and unfortunately, there have been quite a few in the United States over the years.

The Federal Deposit Insurance Corporation (FDIC) tracks bank failures in the United States. The most recent bank failure occurred on April 26, 2024, when Republic First Bank was closed by regulators. This incident marked the only bank failure so far in 2024, following a series of five closures in 2023, including some major institutions.

From Washington Mutual and IndyMac in 2008 to Guaranty Bank and First NBC Bank in 2017, these failures can have a big impact on customers, employees, and the economy as a whole. While there are often warning signs leading up to a bank failure, it can still be a shock and a disappointment to those affected.2

It's important to remember, though, that the government has systems in place to help protect customers' deposits and ensure that the banking industry remains stable overall. Banks are an important part of our financial system, but unfortunately, they can fail from time to time. There are a few reasons why this might happen.

One common cause is undercapitalization, which means that the bank doesn't have enough money to cover its obligations. Another factor is loan quality – if a bank makes too many bad loans, it can end up losing a lot of money. Additionally, losses on investment securities can also contribute to a bank's failure.

When a bank fails, it can have a ripple effect on the economy and on the people who have accounts with that bank. That's why it's important for regulators to keep a close eye on banks and step in when necessary to prevent failures from happening.

The last bank failure in Iowa was Polk County Bank in Johnston, which occurred on November 18, 2011, highlighting the rarity of s

List of Banks Examined for CRA Compliance – June 2024

The Federal Deposit Insurance Corporation (FDIC) recently released its list of state nonmember banks that were evaluated for compliance with the Community Reinvestment Act (CRA). This list, which covers evaluation ratings assigned by the FDIC plays a crucial role in promoting responsible banking practices and community development.

Understanding the Community Reinvestment Act (CRA)

The CRA, enacted in 1977, serves as a cornerstone of ensuring that insured banks and thrifts contribute to the betterment of their communities. This law encourages financial institutions to meet the credit needs of local communities, particularly those in low- and moderate-income neighborhoods, all while maintaining safe and sound operations.

Mandatory Public Disclosure

In 1989, as part of the Financial Institutions Reform, Recovery, and Enforcement Act (FIRREA), the Congress mandated the public disclosure of evaluation and rating reports for each bank or thrift that undergoes a CRA examination on or after July 1, 1990. This transparency ensures that banks are held accountable for their community reinvestment efforts.

Accessing the Evaluation Results

If you're interested in obtaining information about state nonmember banks' CRA evaluations, the FDIC provides a consolidated list that has been publicly available since July 1, 1990. This list includes the rating for each bank. You can access this information online or obtain a hard copy from the FDIC's Public Information Center at 3501 Fairfax Drive, Room E-1002, Arlington, VA 22226. For inquiries, you can contact them at 877-275-3342 or 703-562-2200.

Requesting Individual Bank Evaluations

If you need the CRA evaluation for a specific bank, it's good to know that these reports are available directly from the bank itself. The law requires banks to make this information available upon request. You can also request these evaluations from the FDIC's Public Information Center, ensuring transparency and accessibility for the public.

The release of the FDIC's list of banks evaluated for CRA compliance underscores the importance of transparency and accountability in the banking industry. The Community Reinvestment Act continues to be a vital tool in promoting responsible banking practices and ensuring that financial institutions are actively contributing to the well-being of their local communities.

With public access to these evaluation reports, consumers and communities can make informed decisions about their banking relationships and hold banks accountable for their community reinvestment efforts. It's a step towards a more equitable and responsible banking sector.

List of Recent Failed Banks [2023 – 2024]

Bank Name City State Cert Acquiring Institution Closing Date Fund
Republic First Bank Philadelphia PA 27332 Fulton Bank, National Association April 26, 2024 10546
Citizens Bank Sac City IA 8758 Iowa Trust & Savings Bank November 3, 2023 10545
Heartland Tri-State Bank Elkhart KS 25851 Dream First Bank, N.A. July 28, 2023 10544
First Republic Bank San Francisco CA 59017 JPMorgan Chase Bank, N.A. May 1, 2023 10543
Signature Bank New York NY 57053 Flagstar Bank, N.A. March 12, 2023 10540
Silicon Valley Bank Santa Clara CA 24735 First–Citizens Bank & Trust Company March 10, 2023 10539

List of Failed Banks [2015 – 2020]

Bank Name City State Acquiring Institution Closing Date
Almena State Bank Almena KS Equity Bank October 23, 2020
First City Bank of Florida Fort Walton Beach FL United Fidelity Bank, fsb October 16, 2020
The First State Bank Barboursville WV MVB Bank, Inc. April 3, 2020
Ericson State Bank Ericson NE Farmers and Merchants Bank February 14, 2020
City National Bank of New Jersey Newark NJ Industrial Bank November 1, 2019
Resolute Bank Maumee OH Buckeye State Bank October 25, 2019
Louisa Community Bank Louisa KY Kentucky Farmers Bank Corporation October 25, 2019
The Enloe State Bank Cooper TX Legend Bank, N. A. May 31, 2019
Washington Federal Bank for Savings Chicago IL Royal Savings Bank December 15, 2017
The Farmers and Merchants State Bank of Argonia Argonia KS Conway Bank October 13, 2017
Fayette County Bank Saint Elmo IL United Fidelity Bank, fsb May 26, 2017
Guaranty Bank, (d/b/a BestBank in Georgia & Michigan) Milwaukee WI First-Citizens Bank & Trust Company May 5, 2017
First NBC Bank New Orleans LA Whitney Bank April 28, 2017
Proficio Bank Cottonwood Heights UT Cache Valley Bank March 3, 2017
Seaway Bank and Trust Company Chicago IL State Bank of Texas January 27, 2017
Harvest Community Bank Pennsville NJ First-Citizens Bank & Trust Company January 13, 2017
Allied Bank Mulberry AR Today's Bank September 23, 2016
The Woodbury Banking Company Woodbury GA United Bank August 19, 2016
First CornerStone Bank King of Prussia PA First-Citizens Bank & Trust Company May 6, 2016
Trust Company Bank Memphis TN The Bank of Fayette County April 29, 2016
North Milwaukee State Bank Milwaukee WI First-Citizens Bank & Trust Company March 11, 2016
Hometown National Bank Longview WA Twin City Bank October 2, 2015
The Bank of Georgia Peachtree City GA Fidelity Bank October 2, 2015
Premier Bank Denver CO United Fidelity Bank, fsb July 10, 2015
Edgebrook Bank Chicago IL Republic Bank of Chicago May 8, 2015
Doral Bank San Juan PR Banco Popular de Puerto Rico February 27, 2015
En Español
Capitol City Bank & Trust Company Atlanta GA First-Citizens Bank & Trust Company February 13, 2015
Highland Community Bank Chicago IL United Fidelity Bank, fsb January 23, 2015
First National Bank of Crestview Crestview FL First NBC Bank January 16, 2015

List of Failed Banks [2013 – 2014]

Bank Name  City  State  Acquiring Institution  Closing Date 
Northern Star Bank Mankato MN BankVista 19-Dec-14
Frontier Bank, FSB D/B/A El Paseo Bank Palm Desert CA Bank of Southern California, N.A. 07-Nov-14
The National Republic Bank of Chicago Chicago IL State Bank of Texas 24-Oct-14
NBRS Financial Rising Sun MD Howard Bank 17-Oct-14
GreenChoice Bank, fsb Chicago IL Providence Bank, LLC 25-Jul-14
Eastside Commercial Bank Conyers GA Community & Southern Bank 18-Jul-14
The Freedom State Bank Freedom OK Alva State Bank & Trust Company 27-Jun-14
Valley Bank Fort Lauderdale FL Landmark Bank, National Association 20-Jun-14
Valley Bank Moline IL Great Southern Bank 20-Jun-14
Slavie Federal Savings Bank Bel Air MD Bay Bank, FSB 30-May-14
Columbia Savings Bank Cincinnati OH United Fidelity Bank, fsb 23-May-14
AztecAmerica Bank Berwyn IL Republic Bank of Chicago 16-May-14
Allendale County Bank Fairfax SC Palmetto State Bank 25-Apr-14
Vantage Point Bank Horsham PA First Choice Bank 28-Feb-14
Millennium Bank, National Association Sterling VA WashingtonFirst Bank 28-Feb-14
Syringa Bank Boise ID Sunwest Bank 31-Jan-14
The Bank of Union El Reno OK BancFirst 24-Jan-14
DuPage National Bank West Chicago IL Republic Bank of Chicago 17-Jan-14
Texas Community Bank, National Association The Woodlands TX Spirit of Texas Bank, SSB 13-Dec-13
Bank of Jackson County Graceville FL First Federal Bank of Florida 30-Oct-13
First National Bank also operating as The National Bank of El Paso Edinburg TX PlainsCapital Bank 13-Sep-13
The Community's Bank Bridgeport CT No Acquirer 13-Sep-13
Sunrise Bank of Arizona Phoenix AZ First Fidelity Bank, National Association 23-Aug-13
Community South Bank Parsons TN CB&S Bank, Inc. 23-Aug-13
Bank of Wausau Wausau WI Nicolet National Bank 09-Aug-13
First Community Bank of Southwest Florida (also operating as Community Bank of Cape Coral) Fort Myers FL C1 Bank 02-Aug-13
Mountain National Bank Sevierville TN First Tennessee Bank, National Association 07-Jun-13
1st Commerce Bank North Las Vegas NV Plaza Bank 06-Jun-13
Banks of Wisconsin d/b/a Bank of Kenosha Kenosha WI North Shore Bank, FSB 31-May-13
Central Arizona Bank Scottsdale AZ Western State Bank 14-May-13
Sunrise Bank Valdosta GA Synovus Bank 10-May-13
Pisgah Community Bank Asheville NC Capital Bank, N.A. 10-May-13
Douglas County Bank Douglasville GA Hamilton State Bank 26-Apr-13
Parkway Bank Lenoir NC CertusBank, National Association 26-Apr-13
Chipola Community Bank Marianna FL First Federal Bank of Florida 19-Apr-13
Heritage Bank of North Florida Orange Park FL FirstAtlantic Bank 19-Apr-13
First Federal Bank Lexington KY Your Community Bank 19-Apr-13
Gold Canyon Bank Gold Canyon AZ First Scottsdale Bank, National Association 05-Apr-13
Frontier Bank LaGrange GA HeritageBank of the South 08-Mar-13
Covenant Bank Chicago IL Liberty Bank and Trust Company 15-Feb-13
1st Regents Bank Andover MN First Minnesota Bank 18-Jan-13
Westside Community Bank University Place WA Sunwest Bank 11-Jan-13

List of Failed Banks [2011 – 2012]

Bank Name  City  State  Acquiring Institution  Closing Date 
Community Bank of the Ozarks Sunrise Beach MO Bank of Sullivan 14-Dec-12
Hometown Community Bank Braselton GA CertusBank, National Association 16-Nov-12
Citizens First National Bank Princeton IL Heartland Bank and Trust Company 02-Nov-12
Heritage Bank of Florida Lutz FL Centennial Bank 02-Nov-12
NOVA Bank Berwyn PA No Acquirer 26-Oct-12
Excel Bank Sedalia MO Simmons First National Bank 19-Oct-12
First East Side Savings Bank Tamarac FL Stearns Bank N.A. 19-Oct-12
GulfSouth Private Bank Destin FL SmartBank 19-Oct-12
First United Bank Crete IL Old Plank Trail Community Bank, National Association 28-Sep-12
Truman Bank St. Louis MO Simmons First National Bank 14-Sep-12
First Commercial Bank Bloomington MN Republic Bank & Trust Company 07-Sep-12
Waukegan Savings Bank Waukegan IL First Midwest Bank 03-Aug-12
Jasper Banking Company Jasper GA Stearns Bank N.A. 27-Jul-12
Second Federal Savings and Loan Association of Chicago Chicago IL Hinsdale Bank & Trust Company 20-Jul-12
Heartland Bank Leawood KS Metcalf Bank 20-Jul-12
First Cherokee State Bank Woodstock GA Community & Southern Bank 20-Jul-12
Georgia Trust Bank Buford GA Community & Southern Bank 20-Jul-12
The Royal Palm Bank of Florida Naples FL First National Bank of the Gulf Coast 20-Jul-12
Glasgow Savings Bank Glasgow MO Regional Missouri Bank 13-Jul-12
Montgomery Bank & Trust Ailey GA Ameris Bank 06-Jul-12
The Farmers Bank of Lynchburg Lynchburg TN Clayton Bank and Trust 15-Jun-12
Security Exchange Bank Marietta GA Fidelity Bank 15-Jun-12
Putnam State Bank Palatka FL Harbor Community Bank 15-Jun-12
Waccamaw Bank Whiteville NC First Community Bank 08-Jun-12
Farmers' and Traders' State Bank Shabbona IL First State Bank 08-Jun-12
Carolina Federal Savings Bank Charleston SC Bank of North Carolina 08-Jun-12
First Capital Bank Kingfisher OK F & M Bank 08-Jun-12
Alabama Trust Bank, National Association Sylacauga AL Southern States Bank 18-May-12
Security Bank, National Association North Lauderdale FL Banesco USA 04-May-12
Palm Desert National Bank Palm Desert CA Pacific Premier Bank 27-Apr-12
Plantation Federal Bank Pawleys Island SC First Federal Bank 27-Apr-12
Inter Savings Bank, fsb D/B/A InterBank, fsb Maple Grove MN Great Southern Bank 27-Apr-12
HarVest Bank of Maryland Gaithersburg MD Sonabank 27-Apr-12
Bank of the Eastern Shore Cambridge MD No Acquirer 27-Apr-12
Fort Lee Federal Savings Bank, FSB Fort Lee NJ Alma Bank 20-Apr-12
Fidelity Bank Dearborn MI The Huntington National Bank 30-Mar-12
Premier Bank Wilmette IL International Bank of Chicago 23-Mar-12
Covenant Bank & Trust Rock Spring GA Stearns Bank, N.A. 23-Mar-12
New City Bank Chicago IL No Acquirer 09-Mar-12
Global Commerce Bank Doraville GA Metro City Bank 02-Mar-12
Home Savings of America Little Falls MN No Acquirer 24-Feb-12
Central Bank of Georgia Ellaville GA Ameris Bank 24-Feb-12
SCB Bank Shelbyville IN First Merchants Bank, National Association 10-Feb-12
Charter National Bank and Trust Hoffman Estates IL Barrington Bank & Trust Company, National Association 10-Feb-12
BankEast Knoxville TN U.S. Bank, N.A. 27-Jan-12
Patriot Bank Minnesota Forest Lake MN First Resource Bank 27-Jan-12
Tennessee Commerce Bank Franklin TN Republic Bank & Trust Company 27-Jan-12
First Guaranty Bank and Trust Company of Jacksonville Jacksonville FL CenterState Bank of Florida, N.A. 27-Jan-12
American Eagle Savings Bank Boothwyn PA Capital Bank, N.A. 20-Jan-12
The First State Bank Stockbridge GA Hamilton State Bank 20-Jan-12
Central Florida State Bank Belleview FL CenterState Bank of Florida, N.A. 20-Jan-12
Western National Bank Phoenix AZ Washington Federal 16-Dec-11
Premier Community Bank of the Emerald Coast Crestview FL Summit Bank 16-Dec-11
Central Progressive Bank Lacombe LA First NBC Bank 18-Nov-11
Polk County Bank Johnston IA Grinnell State Bank 18-Nov-11
Community Bank of Rockmart Rockmart GA Century Bank of Georgia 10-Nov-11
SunFirst Bank Saint George UT Cache Valley Bank 04-Nov-11
Mid City Bank, Inc. Omaha NE Premier Bank 04-Nov-11
All American Bank Des Plaines IL International Bank of Chicago 28-Oct-11
Community Banks of Colorado Greenwood Village CO Bank Midwest, N.A. 21-Oct-11
Community Capital Bank Jonesboro GA State Bank and Trust Company 21-Oct-11
Decatur First Bank Decatur GA Fidelity Bank 21-Oct-11
Old Harbor Bank Clearwater FL 1st United Bank 21-Oct-11
Country Bank Aledo IL Blackhawk Bank & Trust 14-Oct-11
First State Bank Cranford NJ Northfield Bank 14-Oct-11
Blue Ridge Savings Bank, Inc. Asheville NC Bank of North Carolina 14-Oct-11
Piedmont Community Bank Gray GA State Bank and Trust Company 14-Oct-11
Sun Security Bank Ellington MO Great Southern Bank 07-Oct-11
The RiverBank Wyoming MN Central Bank 07-Oct-11
First International Bank Plano TX American First National Bank 30-Sep-11
Citizens Bank of Northern California Nevada City CA Tri Counties Bank 23-Sep-11
Bank of the Commonwealth Norfolk VA Southern Bank and Trust Company 23-Sep-11
The First National Bank of Florida Milton FL CharterBank 09-Sep-11
CreekSide Bank Woodstock GA Georgia Commerce Bank 02-Sep-11
Patriot Bank of Georgia Cumming GA Georgia Commerce Bank 02-Sep-11
First Choice Bank Geneva IL Inland Bank & Trust 19-Aug-11
First Southern National Bank Statesboro GA Heritage Bank of the South 19-Aug-11
Lydian Private Bank Palm Beach FL Sabadell United Bank, N.A. 19-Aug-11
Public Savings Bank Huntingdon Valley PA Capital Bank, N.A. 18-Aug-11
The First National Bank of Olathe Olathe KS Enterprise Bank & Trust 12-Aug-11
Bank of Whitman Colfax WA Columbia State Bank 05-Aug-11
Bank of Shorewood Shorewood IL Heartland Bank and Trust Company 05-Aug-11
Integra Bank National Association Evansville IN Old National Bank 29-Jul-11
BankMeridian, N.A. Columbia SC SCBT National Association 29-Jul-11
Virginia Business Bank Richmond VA Xenith Bank 29-Jul-11
Bank of Choice Greeley CO Bank Midwest, N.A. 22-Jul-11
LandMark Bank of Florida Sarasota FL American Momentum Bank 22-Jul-11
Southshore Community Bank Apollo Beach FL American Momentum Bank 22-Jul-11
Summit Bank Prescott AZ The Foothills Bank 15-Jul-11
First Peoples Bank Port St. Lucie FL Premier American Bank, N.A. 15-Jul-11
High Trust Bank Stockbridge GA Ameris Bank 15-Jul-11
One Georgia Bank Atlanta GA Ameris Bank 15-Jul-11
Signature Bank Windsor CO Points West Community Bank 08-Jul-11
Colorado Capital Bank Castle Rock CO First-Citizens Bank & Trust Company 08-Jul-11
First Chicago Bank & Trust Chicago IL Northbrook Bank & Trust Company 08-Jul-11
Mountain Heritage Bank Clayton GA First American Bank and Trust Company 24-Jun-11
First Commercial Bank of Tampa Bay Tampa FL Stonegate Bank 17-Jun-11
McIntosh State Bank Jackson GA Hamilton State Bank 17-Jun-11
Atlantic Bank and Trust Charleston SC First Citizens Bank and Trust Company, Inc. 03-Jun-11
First Heritage Bank Snohomish WA Columbia State Bank 27-May-11
Summit Bank Burlington WA Columbia State Bank 20-May-11
First Georgia Banking Company Franklin GA CertusBank, National Association 20-May-11
Atlantic Southern Bank Macon GA CertusBank, National Association 20-May-11
Coastal Bank Cocoa Beach FL Florida Community Bank, a division of Premier American Bank, N.A. 06-May-11
Community Central Bank Mount Clemens MI Talmer Bank & Trust 29-Apr-11
The Park Avenue Bank Valdosta GA Bank of the Ozarks 29-Apr-11
First Choice Community Bank Dallas GA Bank of the Ozarks 29-Apr-11
Cortez Community Bank Brooksville FL Florida Community Bank, a division of Premier American Bank, N.A. 29-Apr-11
First National Bank of Central Florida Winter Park FL Florida Community Bank, a division of Premier American Bank, N.A. 29-Apr-11
Heritage Banking Group Carthage MS Trustmark National Bank 15-Apr-11
Rosemount National Bank Rosemount MN Central Bank 15-Apr-11
Superior Bank Birmingham AL Superior Bank, National Association 15-Apr-11
Nexity Bank Birmingham AL AloStar Bank of Commerce 15-Apr-11
New Horizons Bank East Ellijay GA Citizens South Bank 15-Apr-11
Bartow County Bank Cartersville GA Hamilton State Bank 15-Apr-11
Nevada Commerce Bank Las Vegas NV City National Bank 08-Apr-11
Western Springs National Bank and Trust Western Springs IL Heartland Bank and Trust Company 08-Apr-11
The Bank of Commerce Wood Dale IL Advantage National Bank Group 25-Mar-11
Legacy Bank Milwaukee WI Seaway Bank and Trust Company 11-Mar-11
First National Bank of Davis Davis OK The Pauls Valley National Bank 11-Mar-11
Valley Community Bank St. Charles IL First State Bank 25-Feb-11
San Luis Trust Bank, FSB San Luis Obispo CA First California Bank 18-Feb-11
Charter Oak Bank Napa CA Bank of Marin 18-Feb-11
Citizens Bank of Effingham Springfield GA Heritage Bank of the South 18-Feb-11
Habersham Bank Clarkesville GA SCBT National Association 18-Feb-11
Canyon National Bank Palm Springs CA Pacific Premier Bank 11-Feb-11
Badger State Bank Cassville WI Royal Bank 11-Feb-11
Peoples State Bank Hamtramck MI First Michigan Bank 11-Feb-11
Sunshine State Community Bank Port Orange FL Premier American Bank, N.A. 11-Feb-11
Community First Bank Chicago Chicago IL Northbrook Bank & Trust Company 04-Feb-11
North Georgia Bank Watkinsville GA BankSouth 04-Feb-11
American Trust Bank Roswell GA Renasant Bank 04-Feb-11
First Community Bank Taos NM U.S. Bank, N.A. 28-Jan-11
FirsTier Bank Louisville CO No Acquirer 28-Jan-11
Evergreen State Bank Stoughton WI McFarland State Bank 28-Jan-11
The First State Bank Camargo OK Bank 7 28-Jan-11
United Western Bank Denver CO First-Citizens Bank & Trust Company 21-Jan-11
The Bank of Asheville Asheville NC First Bank 21-Jan-11
CommunitySouth Bank & Trust Easley SC CertusBank, National Association 21-Jan-11
Enterprise Banking Company McDonough GA No Acquirer 21-Jan-11
Oglethorpe Bank Brunswick GA Bank of the Ozarks 14-Jan-11
Legacy Bank Scottsdale AZ Enterprise Bank & Trust 07-Jan-11
First Commercial Bank of Florida Orlando FL First Southern Bank 07-Jan-11

ALSO READ:

Which Banks Are in Danger of Failing or Collapse? 

Banking Crisis Explained: Causes of Bank Collapse & its Prevention

Filed Under: Banking, Economy, Financing Tagged With: List of Failed Banks

When Did Real Estate Market Crash in the Past?

December 4, 2024 by Marco Santarelli

When Did Real Estate Market Crash?

If you are wondering when did the real estate market crash in the U.S., the answer is not so simple. The real estate market crash was not a single event, but a series of events that unfolded over several years, starting from 2007 and lasting until 2010. The housing market bubble burst in 2008.

On a fateful day, December 30, 2008, the Case–Shiller home price index documented a historic nosedive in home prices. It marked a shocking turn of events as the median price for a U.S. home that was sold in the fourth quarter of 2008 plummeted to $180,100.

This sharp drop starkly contrasted with the $205,700 median price recorded during the final quarter of the preceding year, 2007. The year 2008 witnessed an unparalleled decline, with home prices experiencing a staggering 9.5% drop.

The real estate market crash was triggered by the subprime mortgage crisis, which was a result of predatory lending practices by banks and other financial institutions. Subprime mortgages are loans given to borrowers who have low credit scores and a higher risk of defaulting on their payments.

These borrowers were lured by low introductory interest rates that would later increase significantly, making their monthly payments unaffordable. Many of these borrowers also took out adjustable-rate mortgages (ARMs), which had variable interest rates that depended on the market conditions.

These subprime mortgages were then packaged and sold to investors as mortgage-backed securities (MBS), which are bonds that are backed by a pool of mortgages. The investors who bought these MBS expected to receive regular payments from the borrowers and also hoped to profit from the rising value of the underlying properties.

However, as the housing bubble burst in 2007, the value of these properties plummeted, and many borrowers began to default on their mortgages. This caused the value of the MBS to collapse, and many investors suffered huge losses.

Effects of the Real Estate Market Crash

The subprime mortgage crisis also affected the financial sector, which had borrowed heavily to invest in MBS and other risky assets. When these assets lost their value, many financial institutions faced insolvency and liquidity problems and were unable to meet their obligations.

This led to a credit crunch, which is a situation where banks and other lenders stop lending money or charge very high-interest rates. The credit crunch affected businesses and consumers alike, who found it harder to get loans or refinance their existing debts.

The real estate market crash also had a severe impact on the economy and society. Millions of Americans lost their homes to foreclosure, and many more lost their jobs as businesses struggled to survive. The unemployment rate rose from 4.6% in 2007 to 10% in 2009, and the poverty rate increased from 12.5% in 2007 to 14.3% in 2009.

Global Repercussions

The real estate market crash also had global repercussions, as it triggered a financial crisis that affected many countries around the world. The US was not the only country that experienced a housing bubble and a subsequent collapse.

Countries like Spain, Ireland, Greece, and China also saw their property prices soar and then crash, leading to similar problems of defaults, losses, and bailouts. The US was also a major exporter of MBS and other financial products that were linked to its housing market.

When these products lost their value, many foreign investors and banks suffered as well. The US dollar also weakened as a result of the crisis, affecting trade and exchange rates globally. The real estate market crash contributed to a sharp decline in economic growth, trade, and investment worldwide, leading to what is known as the Great Recession of 2008-2009.

Filed Under: Housing Market, Real Estate, Real Estate Market Tagged With: Real Estate Crash, When Did Real Estate Market Crash

How Long Will It Take to Make a Profit on a Home Purchase?

December 4, 2024 by Marco Santarelli

How Long Does It Take to Make a Profit on a Home

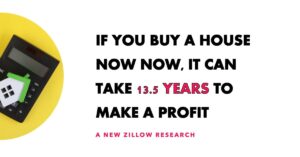
It's a question that's been on the minds of many prospective home buyers: How long will it take to make a profit on your home purchase? The answer, according to Zillow, might surprise you. If you buy now, it can take 13.5 years to make a profit on your home sale.
The current state of the housing market has led to an affordability crisis that could extend the time it takes to break even on a home purchase.

How Long Will It Take to Make a Profit on a Home Purchase?

The Housing Market Affordability Challenge

The cost of buying a home has skyrocketed in recent years, with home values reaching record highs and mortgage rates at their highest in two decades. For new home buyers, this means a longer wait to see a profit on their investment. Zillow's analysis takes into account various factors, including typical home values, forecasted home value increases, closing costs, agent fees, maintenance costs, and interest payments. All of these factors contribute to the time it takes to make a profit on a home purchase.

Estimates are based on the current market conditions as of July 2023, and different down payment percentages and maintenance costs lead to varying profit timelines. Here's a breakdown:

  • 3% down payment: 13 years and six months to make a profit.
  • 5% down payment: 13 years and three months to make a profit.
  • 10% down payment: 12 years and seven months to make a profit.
  • 20% down payment: 11 years and three months to make a profit.

Location Matters

Location plays a significant role in the timeline to make a profit on a home purchase. In high-value metro areas like San Jose and San Francisco, California, the timeline is considerably shorter, with homeowners recouping their investment in around 7 years. These areas have a history of consistent growth, allowing homeowners to build equity relatively quickly.

On the other hand, more affordable markets, such as Cleveland, Baton Rouge, El Paso, Akron, and Indianapolis, require a longer wait. It can take at least 20 years for new home buyers in these areas to reach the profit point. Slower historical growth rates in these regions indicate that it will take more time for home values to increase significantly.

The Impact of Mortgage Rates

Mortgage rates are another factor affecting the time it takes to make a profit on a home purchase. As rates near 8%, and home prices level off, it takes longer to recover the initial investment due to interest costs. However, homeownership offers lasting financial benefits, including the ability to lock in a fixed mortgage payment, unlike renting, where costs typically rise each year.

The decision of when to buy or sell a home is a personal one and involves assessing long-term financial goals, property value potential, and your ability to manage mortgage payments.

Financing and Affordability

Getting financing for your home is a crucial step in the home buying process. Even small fluctuations in interest rates can significantly impact affordability. For example, a $400,000 loan with a 5% mortgage rate compared to a 7% mortgage rate can lead to a $500 monthly difference. Zillow Home Loans provides tools to assess affordability, explore financing options, and connect with qualified loan officers to identify the best loan for your financial situation.

The Bottom Line

In a housing market marked by soaring prices and rising mortgage rates, the time it takes to make a profit on a home purchase is extending. Zillow's analysis shows that it can take more than a decade for some buyers to break even. Location, down payment percentage, and maintenance costs are all factors that influence this timeline. While mortgage rates impact affordability, homeownership still offers long-term financial benefits.

So, if you're considering a home purchase, be prepared for a potentially extended wait to see a profit. It's a personal decision that involves evaluating your financial goals and the real estate market's current conditions.

The housing market is in a state of flux, and it's important to make informed decisions when it comes to buying a home. For more information, you can visit Zillow's research on housing market trends.

Filed Under: Housing Market, Real Estate, Trending News Tagged With: How Long Does It Take to Make a Profit on a Home

Housing Market 2024: 10 Hotspots Where You Need $500K+ to Buy

December 4, 2024 by Marco Santarelli

Housing Market 2024: 10 Hotspots Where You Need $500K+ to Buy

The American dream of homeownership has become increasingly challenging in recent years. Forget the 20% down payment! In this post, we will discuss about 10 sizzling housing markets in 2024 that demand a whopping $500K+ just to enter.

The National Association of Realtors paints a sobering picture, highlighting how affordability has reached historic lows. This situation stems from a complex interplay between rising home prices and stagnant wages. According to their definition, a house is considered “unaffordable” if it consumes more than 28% of a household's annual income.

Let's face it, real estate is a local market. Prices can vary dramatically across the country. GOBankingRates took a deep dive into this disparity, specifically focusing on the ZIP code level. They analyzed data from Zillow (November 2023) for the 2,500 largest ZIP codes in the United States. Here's how they approached it:

  1. Home Values: They determined the average home value for each ZIP code in 2023.
  2. Down Payment Calculation: Assuming a traditional 20% down payment, they calculated the amount required for each property.
  3. Monthly Mortgage Payment: Using a 6.62% interest rate for a fixed 30-year mortgage (data sourced from Federal Reserve Bank of St. Louis, January 4, 2024), they estimated the monthly mortgage payment for each scenario.

The results are eye-opening, revealing the top 10 places where a whopping $500,000 down payment is the bare minimum to enter the housing market.

Housing Market 2024: Top 10 Places Where a $500,000 Down Payment is a Must

10. Cupertino, California (95014)

  • 2023 average home value: $2,617,860
  • 20% down: $523,572
  • Monthly mortgage payment: $13,403

Cupertino, home to tech giant Apple Inc., has become synonymous with innovation and affluence. This Silicon Valley city offers top-tier schools, a thriving job market, and a high quality of life. However, these benefits come with a hefty price tag. The demand for housing in Cupertino is driven by well-paid tech professionals, contributing to its sky-high home prices. Despite the high costs, the area continues to attract families and individuals seeking proximity to major tech companies and the amenities that come with this vibrant community.

9. Menlo Park, California (94025)

  • 2023 average home value: $2,648,721
  • 20% down: $529,744
  • Monthly mortgage payment: $13,561

Menlo Park is another Silicon Valley hotspot, hosting numerous venture capital firms and tech startups. The presence of Facebook's headquarters (now Meta Platforms) and other influential companies has significantly boosted the local economy. This influx of high-income earners has driven up housing demand and prices. Menlo Park combines suburban tranquility with urban convenience, making it a desirable location for those working in the tech industry. The city's excellent public services, parks, and educational institutions add to its appeal, but also to its real estate costs.

8. Los Angeles, California (90024)

  • 2023 average home value: $2,717,587
  • 20% down: $543,517
  • Monthly mortgage payment: $13,914

Located in the heart of Westwood, near UCLA and Beverly Hills, this part of Los Angeles is known for luxury living. The area's combination of high-end shopping, dining, and cultural institutions attracts affluent buyers. The prestigious nature of the neighborhood, along with its proximity to some of the city's most iconic landmarks, keeps demand and prices high. Despite its urban setting, Westwood offers a community feel with tree-lined streets and historic architecture, making it one of the most sought-after areas in Los Angeles.

7. New York, New York (11217)

  • 2023 average home value: $2,808,731
  • 20% down: $561,746
  • Monthly mortgage payment: $14,380

This Brooklyn ZIP code encompasses neighborhoods like Park Slope, which is renowned for its historic brownstones and family-friendly atmosphere. The area's excellent schools, parks, and local businesses make it a desirable location for families and professionals alike. The ongoing gentrification and development projects have further increased property values. The blend of old-world charm and modern amenities ensures that 11217 remains one of the most expensive and attractive areas in Brooklyn.

6. New York, New York (11231)

  • 2023 average home value: $2,850,216
  • 20% down: $570,043
  • Monthly mortgage payment: $14,593

This ZIP code includes parts of Carroll Gardens and Red Hook, areas that have seen significant gentrification. Carroll Gardens is known for its tree-lined streets, historic brownstones, and vibrant community, while Red Hook offers a more industrial charm with waterfront views. The combination of these unique characteristics, along with new developments and improved amenities, has driven up home prices. The area's appeal to young professionals and families ensures its real estate market remains competitive and expensive.

5. New York, New York (10024)

  • 2023 average home value: $2,929,695
  • 20% down: $585,939
  • Monthly mortgage payment: $15,000

Spanning the Upper West Side, this ZIP code offers proximity to Central Park and Riverside Park, making it one of the most coveted locations in Manhattan. The area's historic pre-war buildings, luxury high-rises, and cultural institutions attract a diverse and affluent population. The Upper West Side is also known for its excellent schools, vibrant arts scene, and numerous dining and shopping options. These factors contribute to its high real estate values and the substantial down payments required to purchase a home here.

4. New York, New York (10011)

  • 2023 average home value: $2,940,281
  • 20% down: $588,056
  • Monthly mortgage payment: $15,054

This ZIP code covers parts of Chelsea and the West Village, areas known for their trendy boutiques, art galleries, and vibrant nightlife. Chelsea's transformation from an industrial area to a hub of modern luxury has significantly increased property values. The West Village, with its historic charm and bohemian vibe, remains one of Manhattan's most desirable neighborhoods. The area's unique blend of history and modernity, along with its cultural and culinary offerings, ensures its real estate market remains highly competitive and expensive.

3. New York, New York (11201)

  • 2023 average home value: $3,178,598
  • 20% down: $635,720
  • Monthly mortgage payment: $16,274

This Brooklyn ZIP code includes Brooklyn Heights and DUMBO, both of which offer stunning views of Manhattan and have become some of the most coveted addresses in New York City. Brooklyn Heights, with its historic brownstones and peaceful streets, attracts families and professionals seeking a quiet yet convenient lifestyle. DUMBO, known for its artistic vibe and waterfront parks, appeals to young professionals and creative types. The area's prime location and high-end amenities contribute to its high property values and significant down payments.

2. Hillsborough, California (94010)

  • 2023 average home value: $3,263,479
  • 20% down: $652,696
  • Monthly mortgage payment: $16,709

Hillsborough, a suburban haven near San Francisco, is known for its large estates and excellent schools, making it a prime location for wealthy families. The town's exclusivity and low population density contribute to its high home prices. Hillsborough offers a serene environment with easy access to the city, making it an ideal location for those who value privacy and convenience. The area's lush landscapes, upscale amenities, and top-notch public services further enhance its appeal and real estate costs.

1. New York, New York (10021)

  • 2023 average home value: $3,289,757
  • 20% down: $657,951
  • Monthly mortgage payment: $16,843

Located on the Upper East Side, this ZIP code includes some of the most luxurious and iconic residences in Manhattan. Known for its upscale boutiques, world-class restaurants, and proximity to Central Park, the Upper East Side attracts affluent buyers from around the globe. The area's historic mansions and modern high-rises offer unparalleled luxury and exclusivity. The combination of prime location, high-end amenities, and prestigious addresses ensures that home prices and down payments remain exceptionally high.

Keeping the American Dream Alive

These top 10 ZIP codes highlight the most expensive areas in the U.S. housing market, where a down payment alone requires $500K or more. The high home values and substantial mortgage payments in these locations are driven by factors such as proximity to major tech hubs, prestigious educational institutions, historic charm, and luxury amenities.

For those considering purchasing a home in these areas, it is essential to prepare for significant financial commitments. Understanding the local market dynamics and aligning your budget accordingly can help you navigate the challenges of buying in these high-cost regions.

So, what does this mean for aspiring homeowners in these areas? The reality is, coming up with a $500,000 down payment is a significant hurdle for most people. However, there are still ways to navigate this challenging market. Here are a few options to consider:

  • Save Aggressively: Building a substantial down payment takes time and discipline. Explore high-yield savings accounts and budget diligently to maximize your savings potential.
  • Explore Loan Options: Government-backed loans, such as FHA loans, may offer lower down payment requirements. However, be sure to weigh the pros and cons of each option.
  • Consider Location: If these ultra-expensive areas are outside your budget, consider exploring more affordable suburbs or neighboring towns.

The American dream of homeownership may require some adjustments in today's market. By being strategic and realistic about your budget and location preferences, you can still achieve your goal. Remember, a smaller starter home can be a stepping stone to your dream home in the future.


ALSO READ:

  • Top 10 Hottest Real Estate Markets in the World
  • Hottest Housing Markets Predicted for 2024
  • Housing Market Predictions for Next 5 Years (2024-2028)
  • Housing Market Predictions for the Next 2 Years
  • Housing Market Predictions: 8 of Next 10 Years Poised for Gains
  • Housing Market Predictions: Top 5 Most Priciest Markets of 2024

Filed Under: Housing Market, Real Estate Market Tagged With: Housing Market

US Banking System Insolvency: Is a Crisis Coming Up?

December 4, 2024 by Marco Santarelli

US Banking System Insolvency

The year is 2024. Whispers of a looming financial crisis have begun to circulate, casting a shadow over the once-assured stability of the US banking system. Headlines raise questions about bank insolvency, sparking anxieties among consumers and businesses alike. But is this fear warranted?

This article delves into the current state of the US banking system in 2024. We'll explore factors contributing to concerns about insolvency, analyze the regulatory framework designed to safeguard the system, and ultimately assess the likelihood of a widespread bank failure.

US Banking System Insolvency

First, let's acknowledge the elephant in the room: memories of the 2008 financial crisis still linger. The collapse of major financial institutions and the subsequent recession left a deep scar on the American psyche. This historical context fuels anxieties whenever economic uncertainties arise.

However, it's crucial to recognize the significant post-crisis reforms implemented to strengthen the banking system. The Dodd-Frank Wall Street Reform and Consumer Protection Act, passed in 2010, aimed to prevent future meltdowns by increasing capital requirements for banks, restricting risky lending practices, and creating new regulatory bodies.

The effectiveness of these reforms remains a point of debate. Some argue they've successfully bolstered bank resilience, while others express concerns about unintended consequences, such as reduced lending to small businesses.

In the next part, we'll delve deeper into the specific factors currently causing unease within the banking sector. We'll analyze trends in lending practices, the impact of potential economic downturns, and the role of international financial markets.

Examining Threats to US Banking System Stability

As we move through 2024, the U.S. banking system faces significant challenges. Reports indicate a staggering $517 billion in unrealized losses threatening the stability of 63 banks, according to an analysis by the FDIC. This situation has brought the health of the entire system under intense scrutiny, raising concerns about potential insolvency and the broader implications for the economy.

The Federal Deposit Insurance Corporation (FDIC) has placed 63 lenders on its “Problem Bank List,” signaling financial, operational, or managerial weaknesses that could lead to insolvency.

These banks hold a combined total of $82.1 billion in assets, marking a concerning trend in the financial sector. The rise in unrealized losses—primarily from residential mortgage-backed securities—reflects the impact of higher mortgage rates and persistent inflation, which erode the value of these assets.

1. The Shadow of Rising Loan Defaults:

A critical factor raising red flags is the potential for an increase in loan defaults. Economic turbulence, including rising interest rates and potential recessions, could lead businesses and individuals to struggle with repayments.

For example, if a significant portion of commercial real estate loans defaults due to declining property values, banks that heavily invested in this sector could face substantial losses. Similarly, a rise in consumer loan delinquencies, such as credit card debt, could erode bank profitability.

2. The Ripple Effect of Global Turmoil:

The US banking system doesn't operate in isolation. Events in global financial markets can have a profound impact. A financial crisis in a major European or Asian economy could trigger a domino effect, leading to instability in the US. Additionally, interconnectedness through international trade and investment exposes US banks to potential losses if trading partners experience economic difficulties.

3. The Fintech Factor: Friend or Foe?

The rise of financial technology (Fintech) companies has disrupted the traditional banking landscape. While Fintech offers innovative solutions, it also presents potential risks. Some argue that Fintech startups, lacking long-established risk management practices, could be more vulnerable to financial shocks.

Furthermore, increased reliance on technology introduces new threats like cyberattacks. A major security breach at a key financial institution could disrupt operations and erode public trust in the banking system.

4. Regulatory Tightrope Walk:

Finding the right balance between promoting economic growth and safeguarding against excessive risk is a constant challenge for regulators. Stringent regulations could stifle lending and dampen economic activity. Conversely, overly lenient regulations could leave the system vulnerable to future crises.

Here, the effectiveness of the post-crisis reforms comes under scrutiny. Have they adequately addressed previous vulnerabilities, or are there gaps that need to be addressed?

In the next part, we'll explore the safeguards in place to prevent bank failures and how the government and regulators are responding to current challenges.

Safeguards, Responses, and the Future of US Banking

The potential for bank insolvency in the US banking system raises serious concerns. However, it's important to acknowledge the existing safeguards and ongoing efforts to maintain stability.

1. The Safety Net: Deposit Insurance and the FDIC

A cornerstone of confidence in the US banking system is deposit insurance, guaranteed by the Federal Deposit Insurance Corporation (FDIC). This program protects depositors' money (up to a certain limit) in the event of a bank failure. The FDIC also has a resolution process for failed banks, ensuring a smooth transition and minimizing disruption for depositors and borrowers.

2. The Role of the Federal Reserve

The Federal Reserve plays a crucial role in maintaining financial stability. It utilizes various tools, including setting interest rates and managing the money supply, to promote economic growth and prevent financial crises. In times of stress, the Fed can provide liquidity to banks and intervene to maintain orderly markets.

3. The Need for Transparency and Communication

Maintaining public trust in the banking system is critical. Regulators and policymakers must be transparent about potential risks and communicate proactive measures being taken to address them.

4. Continuous Improvement: Learning from the Past

The financial crisis of 2008 serves as a stark reminder of the consequences of a fragile banking system. Regulators continuously adapt and refine regulations based on lessons learned from past crises.

So, is a widespread bank failure likely in 2024?

The answer is complex. While the current economic climate presents challenges, the US banking system is demonstrably stronger than it was in 2008. The FDIC's safety net, the Federal Reserve's intervention capabilities, and ongoing regulatory reforms provide a foundation for stability.

However, vigilance remains crucial. Addressing weaknesses in loan portfolios, diversifying risk exposure, and adapting regulations remain key priorities. Additionally, fostering a culture of responsible lending and borrowing is vital to long-term stability.

The future of the US banking system hinges on proactive measures taken by regulators, banks themselves, and a well-informed public. By learning from past mistakes and taking preventive action, the financial sector can navigate current challenges and ensure a more secure future for all stakeholders.

Recommended Read:

  • Which Banks Are in Danger of Failing or Collapse (2024)
  • List of FDIC-Insured Banks in 2024: Is Your Bank Insured?
  • 10 Ways to Insure Deposits Beyond the FDIC Limit of $250,000
  • Bank Insurance: How Does FDIC Deposit Insurance Work?
  • List of Recent Failed Banks in the United States (2023-2024)
  • Is My Money Safe in the Bank in 2024?

Filed Under: Banking, Economy, Financing Tagged With: Banking, Finance

Top 10 Safest Cities in Georgia to Raise a Family (2025)

December 4, 2024 by Marco Santarelli

Top 10 Safest Cities in Georgia to Raise a Family (2024)

Georgia, with its vibrant cities and rich cultural history, also faces challenges in crime rates. However, there are cities in the state where residents can enjoy a sense of security and peace. In this article, we'll explore the top 10 safest cities in Georgia, where you can find peace of mind alongside a wonderful place to live with your family.

Understanding Crime Statistics in Georgia

Georgia's annual crime report paints a picture of the state's safety landscape. According to the data gathered by Neighborhoodscout, the state experiences a total of 224,561 crimes annually, divided into violent and property crimes. Violent crimes, including murder, rape, robbery, and assault, account for 40,048 incidents. Property crimes, such as burglary, theft, and motor vehicle theft, make up the remaining 184,513 incidents.

Crime Rates in Georgia

The overall crime rate in Georgia stands at 20.58 per 1,000 residents. This figure includes both violent and property crimes. Breaking it down further, the violent crime rate is 3.67 per 1,000 residents, while property crimes occur at a rate of 16.91 per 1,000 residents. Understanding these numbers is crucial for anyone considering a move within the state.

Violent Crime Breakdown

Violent crimes in Georgia include:

  • Murder: 0.08 per 1,000 residents
  • Rape: 0.36 per 1,000 residents
  • Robbery: 0.44 per 1,000 residents
  • Assault: 2.79 per 1,000 residents

Property Crime Breakdown

Property crimes are more prevalent, with rates of:

  • Burglary: 2.18 per 1,000 residents
  • Theft: 12.66 per 1,000 residents
  • Motor Vehicle Theft: 2.06 per 1,000 residents

Given these statistics, the chances of becoming a victim of a property crime in Georgia are approximately 1 in 59. Despite these figures, there are cities within the state that boast significantly lower crime rates, offering safer environments for their residents.

Top 10 Safest Cities in Georgia

Let's delve into the ten cities in Georgia that have earned their reputation for safety (Neighborhoodscout). These cities are:

1. Jakin

Nestled in Early County, Jakin consistently ranks as the most safe city in Georgia. Celebrated for its tight-knit community and exceptionally low crime rates, this charming city boasts a serene atmosphere. Jakin's peaceful environment makes it an ideal place for families and retirees seeking a relaxed and worry-free lifestyle.

The collaborative efforts of local law enforcement and active community members contribute significantly to Jakin's well-deserved reputation. Imagine evenings spent on porches, catching up with friendly residents, and feeling secure in your surroundings. This close-knit community fosters a strong sense of neighborliness, evident in its impressively low crime rates.

What Makes Jakin The Safest City in Georgia: Jakin's residents are deeply invested in maintaining their city's tranquility. Neighborhood watch programs and community events foster a sense of unity and vigilance, effectively deterring criminal activities.

2. Manor

Manor, located in Ware County, is another gem when it comes to safety. With a population that values peace and security, Manor has implemented various measures to ensure residents feel protected. It is a tranquil haven in Charlton County.

This charming town embodies a peaceful and secure atmosphere, ideal for those seeking a respite from the hustle and bustle. Manor's low crime rates contribute to a sense of security, making it a desirable location for families and retirees alike. Imagine raising a family in a community where safety is a top priority, or enjoying your golden years without worry.

What Makes Manor a Safe City: The local police force in Manor is proactive and engages regularly with the community. This relationship builds trust and ensures quick responses to any potential threats, further enhancing the city's safety profile.

3. Howard

Situated in Taylor County, Howard is known for its low crime rates and strong community bonds. The city’s residents and local authorities work hand in hand to maintain a safe environment. Located in west-central Georgia, it is a quaint community that stands out for its remarkable safety record.

This hidden gem fosters a sense of security, making it a desirable location for families and retirees. Imagine evenings spent strolling down quiet streets, greeting neighbors, and feeling confident in your surroundings. Howard's peaceful atmosphere and low crime rates provide the perfect environment to raise a family or enjoy a relaxed retirement.

What Makes Howard a Safe City: Howard's community-driven approach includes frequent town meetings and collaborative safety programs. These initiatives ensure that everyone is involved in keeping the city safe.

4. Ideal

Ideal, a small city in Macon County, truly lives up to its name as one of the safest cities in Georgia. The city's dedication to maintaining a secure environment is evident in its crime statistics. A haven for peace and security, this hidden gem boasts an impressively low crime rate, allowing residents to enjoy a relaxed and worry-free lifestyle.

Ideal truly lives up to its name, offering a perfect environment for those seeking a tranquil escape. Imagine waking up to fresh air, knowing your neighborhood prioritizes safety, and spending your days basking in the serenity of Ideal.

What Makes Ideal a Safe City: Ideal's focus on preventive measures, such as community policing and regular safety audits, helps in identifying and addressing potential issues before they escalate.

5. Brinson

Located in Decatur County, Brinson completes the top 5. It offers a peaceful lifestyle with its low crime rates. The city's strategic safety measures and community involvement play a crucial role in its safety. This friendly town offers a strong sense of community, reflected in its exceptional safety record.

Residents enjoy low crime rates, making Brinson a perfect fit for those seeking a secure and welcoming place to call home. Imagine evenings spent at community gatherings, feeling a sense of belonging, and knowing your neighbors have your back. Brinson's charm extends beyond its safety, offering a warm and welcoming atmosphere for all.

What Makes Brinson a Safe City: Brinson's local government collaborates with residents through safety workshops and neighborhood watch programs, fostering a community that prioritizes security.

6. Andersonville

Andersonville, in Sumter County, is renowned for its historic significance and safety. The city's commitment to preserving its heritage is matched by its dedication to maintaining a safe environment. The city offers a peaceful escape with a strong sense of community. This charming town boasts a remarkably low crime rate, particularly regarding violent crimes. Imagine evenings spent enjoying the tranquility of Andersonville, knowing your neighborhood prioritizes safety.

What Makes Andersonville a Safe City: Andersonville combines historic preservation efforts with modern safety strategies. This unique approach not only enhances the city's charm but also ensures a secure living space for its residents.

7. Bristol

Bristol, a serene city in Pierce County, stands out for its low crime rates and community-oriented living. The city's proactive approach to safety has earned it a spot among Georgia's safest cities. Bristol is hidden gem known for its friendly atmosphere and exceptional safety record. Residents enjoy low crime rates, making Bristol a desirable location for families and retirees alike. Imagine raising a family in a community where safety is a top concern, or enjoying your retirement years without worry.

What Makes Bristol a Safe City: Bristol's safety measures include regular patrols and community safety workshops. These efforts help in keeping crime at bay and fostering a secure environment for all residents.

8. Denton

In Jeff Davis County, Denton is celebrated for its peaceful living conditions and low crime statistics. The city's focus on community welfare and safety makes it a desirable place to live. Located in south-central Georgia, Denton is a quaint town in Jeff Davis County.

This close-knit community fosters a strong sense of neighborliness, evident in its low crime rates. Imagine evenings spent socializing with friendly residents and feeling secure in your surroundings. Denton's peaceful atmosphere makes it a perfect fit for those seeking a relaxed and worry-free lifestyle.

What Makes Denton a Safe City: Denton invests in community welfare programs that promote safety and well-being. These programs are instrumental in building a strong, vigilant, and cohesive community.

9. Dixie

Dixie, located in Brooks County, is a small city with a big focus on safety. The city's low crime rates reflect the effectiveness of its safety strategies and community involvement. Dixie is a haven for those seeking a secure and welcoming environment making it one of the safest cities in Georgia.

This charming town boasts an impressively low crime rate, allowing residents to enjoy a relaxed and worry-free lifestyle. Imagine waking up to fresh air, knowing your neighborhood prioritizes safety, and spending your days basking in the serenity of Dixie.

What Makes Dixie a Safe City: Dixie's safety strategies include neighborhood patrols and community engagement initiatives. These efforts ensure that residents feel secure and supported.

10. Midville

Midville in Burke County rounds out the top 10 safest cities in Gerogia. Known for its low crime rates and strong community ties, Midville is a shining example of safety in Georgia. This friendly town fosters a strong sense of community, reflected in its exceptional safety record.

Residents enjoy low crime rates, making Midville a perfect fit for those seeking a secure and welcoming place to call home. Imagine evenings spent enjoying community events, feeling a sense of belonging, and knowing your neighbors have your back. Midville's charm extends beyond its safety, offering a warm and inviting atmosphere.

What Makes Midville a Safe City: Midville's residents are deeply connected, and this sense of community plays a significant role in maintaining the city's safety. Regular community events and neighborhood watches help keep crime at bay.

Resources to Enhance Your Security in Georgia

Finding a safe haven and implementing personal security measures are crucial steps. But security is often a collaborative effort. Here, we explore valuable resources available to residents throughout Georgia:

  1. Local Law Enforcement: Your local police department is a primary resource for safety concerns. Familiarize yourself with their non-emergency number for reporting suspicious activity or requesting assistance. Many departments also offer crime prevention resources and community outreach programs.
  2. Neighborhood Watch Programs: Many Georgia communities have established Neighborhood Watch programs. These initiatives encourage residents to look out for each other and report suspicious activity. Participating in or starting a Neighborhood Watch program can significantly strengthen your community's security.
  3. State of Georgia Crime Prevention Resources: The Georgia Department of Public Safety offers a wealth of information on their website. You'll find crime prevention tips, resources on specific safety topics like identity theft, and links to local law enforcement agencies.
  4. Community Safety Initiatives: Many Georgia cities and counties have implemented community safety initiatives. These programs may address issues like gang prevention, drug abuse education, or victim support services. Explore your community's resources to see what programs can benefit you and your family.
  5. National Crime Prevention Council: This national organization provides a comprehensive library of crime prevention resources online. Their website covers topics like personal safety, home security, and protecting your children.

By utilizing these resources and fostering a collaborative approach to safety, Georgia residents can work together to create even stronger, more secure communities.

Remember, choosing a safe place to live and taking personal precautions are important. However, leveraging available resources and partnering with your community empowers everyone to create a more peaceful environment for all.

Recommended Read:

  • 10 Cheapest Cities to Live in Georgia
  • 20 Most Affordable Places to Live in Georgia
  • Best Places to Live in Georgia for Families

Filed Under: Best Places Tagged With: Best Places to Live, Georgia

Worcester, MA Housing Market Forecast 2025-2026

December 4, 2024 by Marco Santarelli

Worcester, MA Housing Market Trends & Predictions for 2024

Are you curious about the current state of the Worcester housing market? The good news is that while the market is seeing some changes from the recent past, it remains a relatively competitive for buyers. Worcester housing market trends show a slight softening with home prices dipping slightly year-over-year, but homes are still selling relatively quickly, and there's a decent level of demand. Let's explore the key factors shaping the market and what it means for both buyers and sellers.

Worcester Housing Market Trends

Worcester, Massachusetts, is a city buzzing with growth. From its revitalized downtown scene to its burgeoning bioscience industry, the “Heart of the Commonwealth” is attracting new residents at a steady clip. And what does this influx of interest mean? An exciting housing market with unique trends to explore.

Home Sales

Based on Redfin's data for October 2024, the number of homes sold in Worcester saw an increase compared to the same time last year. There were 144 homes sold in October 2024, marking a 13.4% year-over-year increase. This indicates that despite the slight dip in prices, people are still actively buying homes in Worcester. While a 13% increase might seem like a big jump, it's important to consider that the market was affected by the pandemic, and the numbers are recovering as compared to previous years.

From a personal perspective, I've noticed that the types of homes selling have also been impacted by the current economic conditions. Buyers are still interested in Worcester, but they are being more selective. Properties needing extensive renovations are often taking longer to sell, while those with updated interiors and exteriors continue to attract plenty of attention.

Home Prices

While the number of home sales in Worcester has increased, the median sale price has shown a slight decline. The median sale price in October 2024 was $443K, which is a 5.8% decrease compared to the same time in 2023. The median price per square foot, however, is up, sitting at $269 and a 12.8% increase since last year.

In my opinion, the current decline in median sale price might be due to a combination of factors including increasing mortgage rates and a slight increase in housing inventory. However, the fact that the price per square foot is still growing indicates that buyers are willing to pay for value.

Are Home Prices Dropping?

Yes, the median home price in Worcester has dropped by 5.8% year-over-year in October 2024. This does suggest a slight cooling down of the market. However, it's crucial to avoid jumping to conclusions that we are in a “crash” scenario. A slight drop doesn't necessarily equate to a market crash. The market remains competitive, with buyers still vying for properties, and in some cases, homes are still selling above the asking price.

Housing Supply

While I don't have access to exact inventory numbers for Worcester, we can infer some trends from the data available. The fact that the median days on the market have slightly increased from 20 days to 21 days suggests that the supply of homes for sale may be creeping up. This also potentially contributes to the slight decline in the median sales price. Buyers have slightly more options, giving them more negotiation power compared to the past few years when the market was highly competitive and properties were selling extremely quickly.

It's important to remember that housing inventory and supply can fluctuate throughout the year based on the seasons. Spring and summer are usually busier seasons for the real estate market, while the inventory may be a little lower during the winter.

Market Trends

  • Increased Days on Market: Homes are taking a slightly longer time to sell, rising from 20 days in 2023 to 21 days in 2024.
  • Slight Decrease in Median Sale Price: The median sale price of homes in Worcester has dropped by 5.8% year-over-year.
  • Higher Percentage of Homes Selling Above List Price: Despite the slight price decline, 66% of homes are still selling above the listing price.
  • Increased Competition: The Redfin Compete Score of 85 suggests that the Worcester market is still very competitive, although it might not be as frenzied as it was in recent past years.

Is Worcester a Buyer's or Seller's Housing Market?

The Worcester housing market in 2024 presents a relatively balanced landscape. While it leans more towards a buyer's market compared to the very hot seller's market of the past few years, it's still a relatively competitive environment.

Here's a breakdown:

Buyer's Advantages:

  • Slightly increased inventory leading to more options and potentially a better ability to negotiate.
  • Slightly decreased median sale prices giving buyers a potential edge in securing a better deal.
  • Homes might not receive as many offers as they did in the past, giving buyers more time to make a decision.

Seller's Advantages:

  • Homes are still selling, which is a good sign of a healthy market.
  • Demand remains present, suggesting that well-maintained, desirable homes will still attract buyers.
  • The market is still competitive, and many homes are still selling above list price, signifying that it's not a buyers' free-for-all.

In Central Massachusetts, I've noticed a shift in the mindset of both buyers and sellers. Buyers are more prepared, doing research beforehand and being more selective. Sellers are also adjusting their expectations, understanding that the market is not as intense as it was during the pandemic.

Migration and Relocation Trends

Redfin's data also provides insights into migration patterns in and out of Worcester.

Where are people moving to Worcester from?

  • New York is the top source of people moving to Worcester, followed by Hartford and Philadelphia.

Where are people from Worcester moving to?

  • A large majority (82%) of Worcester homebuyers searched to stay within the Worcester metropolitan area.
  • Portland, ME was the most popular destination for those moving outside the metro area, followed by Lebanon, NH and Miami, FL.

These trends suggest that many people who are moving to Worcester are coming from larger metropolitan areas and are looking for a more affordable and potentially slower-paced lifestyle. And many who are leaving Worcester are also looking for a similar lifestyle in smaller coastal communities.

Worcester's Climate and Its Impact on the Housing Market

Worcester's climate and environment also play a role in the real estate market. It's essential to consider these factors when making any real estate decisions. Here's a brief overview from the Redfin data:

  • Flood Risk: Moderate. Approximately 15% of properties face a risk of severe flooding in the next 30 years.
  • Fire Risk: Moderate. About 3% of properties face wildfire risk in the next 30 years.
  • Wind Risk: Major. All properties are at major risk of a severe wind event in the next 30 years.
  • Heat Risk: Moderate. 99% of properties face a moderate risk of heat waves in the next 30 years.

Buyers and sellers need to be aware of these risks, and it's important to have a proper home inspection to assess potential damage related to these factors.

Table: Worcester Housing Market Key Statistics (October 2024)

Metric Value Year-Over-Year Change
Median Sale Price $443,000 -5.8%
Homes Sold 144 +13.4%
Median Days on Market 21 +1
Sale-to-List Price Ratio 102.8% -0.89%
Homes Sold Above List Price 66% +4.6%
Homes with Price Drops 27.1% -0.95%

The Worcester housing market is evolving, transitioning from a super-heated seller's market to a more balanced environment. While there's a slight decrease in home prices and an increase in days on the market, it's not indicative of a crash. Homes are still selling, and the market remains competitive.

Worcester Housing Market Forecast 2025-2026

The local economy in Worcester is somewhat diverse with a mix of manufacturing, healthcare, and educational institutions. A stable job market in Worcester generally tends to lead to a more stable real estate market, whereas a shaky economy might result in some uncertainty.

Several factors influence the Worcester housing market, in addition to those we've already discussed:

  • Interest Rates: Fluctuations in interest rates directly impact affordability and demand for housing.
  • Economic Conditions: The overall health of the economy in Massachusetts and the broader US influences job security, consumer confidence, and purchasing power.
  • Local Job Market: The strength of the local job market in Worcester and the surrounding areas can impact the number of people moving to the area and the demand for housing.
  • Inventory Levels: The balance between supply and demand plays a crucial role.
  • School Districts: The quality of school districts in Worcester and the surrounding areas can influence buyer preferences and home values.

Home Price Forecast

Based on current Zillow data, the Worcester housing market is projected to experience a modest growth in home values over the next year. By October 2025, home values are expected to rise by about 3.9% compared to October 2024. However, the short-term forecast shows a slower rise with a predicted 0.2% rise in November 2024 and a 0.7% increase by January 2025.

Let's dive deeper into the specifics and what this means for you.

I've been closely monitoring the real estate market in the area, and Zillow's forecast provides some interesting insights. I've taken the liberty to rephrase the column headers for better understanding:

Region State Forecast – Nov 2024 Forecast – Jan 2025 Forecast – Oct 2025
Worcester, MA MA 0.2% 0.7% 3.9%

This table displays the predicted home value appreciation in Worcester, MA. It shows the percentage change in home values compared to the previous month, with November 2024 as the base for the near-term forecasts. The 3.9% forecast by October 2025 means that, compared to October 2024, home prices are predicted to be around 3.9% higher.

Worcester Compared to Other Massachusetts Regions

It's important to consider the Worcester housing market within the broader context of the Massachusetts real estate scene. Based on Zillow's data, here's how Worcester stacks up:

Region State Forecast – Oct 2025
Boston, MA MA 2%
Worcester, MA MA 3.9%
Springfield, MA MA 3.4%
Barnstable Town, MA MA 4.1%
Pittsfield, MA MA 4.4%
Vineyard Haven, MA MA 5%

As you can see, Worcester's projected growth rate is healthy and, in comparison with Boston, shows it to be a more favorable place for investors. However, the other areas of the state are predicted to fare better in terms of home value appreciation, with Vineyard Haven showing the highest increase.

Will Home Prices Drop in Worcester?

Given the current forecast, a significant price drop in Worcester doesn't seem likely in the immediate future. However, market conditions can change quickly. Interest rates, economic conditions, and local factors can impact the market. While a crash seems unlikely, a moderation or slowing down of the price increases is possible.

Based on the data available and my understanding of the Worcester housing market, I believe we will see a continued growth in the next few years.

Possible Forecast for 2026

Predicting further out into the future becomes more challenging, but I would anticipate a moderate growth rate to continue into 2026, likely similar to the 2025 forecast. It's important to keep an eye on economic trends, but for the moment it does look like the market has stabilized.

Disclaimer: Please remember that any market forecast is based on current data and assumptions, and unforeseen events can significantly impact future market trends.

Is Worcester, MA Expensive to Buy a House?

Whether Worcester, MA is expensive to buy a house in depends on your perspective and what you're comparing it to. Here's a breakdown to help you decide:

Nationally: Compared to the national average, Worcester is still considered relatively expensive. The median sale price in Worcester sits around $443,000 (as of Oct 2024), which is higher than the national median.

Massachusetts: Within Massachusetts, Worcester offers significantly more affordable options compared to pricier areas like Boston and Cambridge. Homes in these cities can easily double or triple the price of a Worcester home.

Locally: Affordability within Worcester itself can vary depending on the neighborhood. More established areas with historic charm might be pricier than newer developments.

Here are some additional factors/tips to consider:

  • Your income: Can you comfortably afford the monthly mortgage payment, property taxes, and other housing costs?
  • Your down payment: A larger down payment reduces your loan amount and monthly payment, making the house more affordable.
  • Mortgage calculators: These tools estimate your monthly payment based on loan amount, interest rate, and other factors.
  • Local real estate websites: These sites often list homes with estimated monthly payments.
  • Real estate agents: A local agent can provide personalized advice on affordability based on your income and desired location.

Overall, Worcester offers a good balance between affordability and a vibrant city experience. While prices are on the rise, they remain more accessible compared to neighboring areas.

Recommended Read:

  • Massachusetts Housing Market Forecast 2025-2026: Insights for Buyers
  • Massachusetts Housing Market: Trends and Forecast 2024-2025
  • Massachusetts First-Time Home Buyer Grants: Your Complete Guide
  • Guide to Average Down Payment on a House in Massachusetts
  • Boston Housing Market: Trends and Forecast 2024-2025

Filed Under: Housing Market, Real Estate Market Tagged With: Housing Market, Worcester

Long Beach CA Housing Market: Trends & Forecast 2025-2026

December 4, 2024 by Marco Santarelli

Long Beach CA Housing Market Trends & Forecast 2024

Living in Long Beach offers a quintessential California dream – sun-soaked beaches, a vibrant pier scene, and proximity to the bustling heart of Los Angeles. Naturally, this idyllic lifestyle translates to a dynamic housing market. So, if you're considering buying a piece of the Long Beach dream in 2025, here's a breakdown of the key trends to help you catch the perfect wave.

Long Beach CA Housing Market Trends: What You Need to Know

The Long Beach housing market remains somewhat competitive, with homes typically selling in around 46 days. However, there are some shifts in the market compared to last year, indicating that the market may be cooling slightly. While home prices are still on the rise, the pace of growth is slowing.

Home Sales

The number of homes sold in Long Beach in October 2024 has increased compared to the previous year. According to Redfin, a total of 241 homes were sold in October 2024, a notable 33.1% increase from the 181 homes sold in October 2023. This increase in sales volume suggests that there's still a healthy level of activity in the Long Beach housing market, even with the slight shift toward a more balanced market.

From my personal experience, having lived and worked in the Long Beach area for over a decade, I've noticed that buyers are becoming a bit more cautious in their approach. They are taking their time to find the right home and are not rushing into decisions like they were in the past couple of years. This could be due to the rising interest rates that we've seen nationwide, causing many buyers to adjust their budgets and search for more affordable options.

Home Prices

While sales volume has increased, the growth in median home prices has slowed. The median sale price of a home in Long Beach was $815,000 last month, which represents a 0.6% increase compared to last year. This is a significant slowdown from the double-digit percentage increases we saw in the past couple of years. Although prices are still going up, the slower pace of growth suggests that the market is becoming more balanced, which can be advantageous for both buyers and sellers.

The median sale price per square foot in Long Beach has also increased, currently at $642. This signifies a 4.1% year-over-year growth. This metric reflects the price appreciation trends in Long Beach, showcasing the steady price increases in the market. Based on my observation, this increase is likely influenced by the factors that keep driving demand for housing in the city, like the desirable weather, job opportunities, and strong community spirit.

Housing Supply

I believe that the housing supply in Long Beach is still relatively tight. While there are more homes available in 2024 than there were in 2023, the number is not enough to balance the market completely. This continues to place upward pressure on home prices, albeit at a slower rate than before.

According to Redfin data, the average time it takes for a home to sell in Long Beach is 46 days, which is slightly longer than the 37 days recorded last year. This increase in the days on the market indicates a slight cooling in the buying frenzy, allowing buyers more time to consider their options. While it still takes a relatively short time for homes to sell, this increase signifies a more balanced market.

Market Trends

The Long Beach housing market is experiencing a shift from a highly competitive seller's market to a more balanced state. While still competitive, buyers now have slightly more negotiating power. The days on the market are increasing, and the rate of price growth has slowed down. It's important to keep in mind that the market can change very quickly, so keeping an eye on the trends is crucial.

Here's a quick snapshot of the current market trends:

  • Increase in home sales: This signals a healthy housing market.
  • Slower growth in home prices: A sign of a more balanced market.
  • Increased days on market: This offers buyers more time to negotiate.
  • Slightly more negotiating power for buyers: The market is becoming less frantic.

In my experience, these market trends indicate that the market is likely to continue moving towards a more balanced state in the coming months. This doesn't mean that home prices will fall dramatically, but it does suggest a more sustainable and healthy rate of growth.

Is Long Beach a Buyer's or Seller's Housing Market?

The Long Beach housing market currently leans towards a more balanced state, although it retains elements of a competitive market.

Buyer's Perspective:

  • While still a competitive market, buyers have slightly more room to negotiate than in previous years.
  • The increased days on the market allow for more time to explore available options and make informed decisions.
  • Interest rates play a significant role in influencing buyer affordability.

Seller's Perspective:

  • While the market is cooling, sellers can still expect a good return on their property investment.
  • It's crucial to price homes strategically, considering the current market conditions.
  • Working with a knowledgeable and experienced real estate agent is vital for maximizing your selling potential.

Overall, it's a good time to be both a buyer and a seller in Long Beach. Buyers have more room to breathe and can leverage the slowing price growth, while sellers can still benefit from the desirable location and strong local economy.

Are Home Prices Dropping?

No, home prices in Long Beach are not dropping drastically. They are still increasing but at a slower rate. The year-over-year growth in median home prices is only 0.6%, which is significantly lower than what we've seen in the past couple of years. This slowdown can be attributed to several factors, including rising interest rates and a more balanced market.

However, it's important to note that a slower rate of price growth is not the same as a price decline. The market is still experiencing price appreciation, just at a more sustainable pace. This is good news for buyers as it reduces some pressure on affordability, but it also means that sellers need to be more strategic in pricing their properties to attract buyers in the current environment.

Long Beach CA Housing Forecast 2025-2026

Predictions for the Future

Based on the current market trends, I anticipate that the Long Beach housing market will continue to move towards a more balanced state in the coming months. While prices are not expected to fall drastically, I predict that the pace of price growth will moderate.

Here are some specific predictions:

  • Home prices will continue to increase, but at a slower rate. This moderation in price growth is likely to continue as the market adjusts to higher interest rates and a more balanced supply and demand dynamic.
  • The inventory of homes for sale will gradually increase. However, this increase will likely be slow and may not be enough to dramatically reduce home prices.
  • The days on market will continue to increase slightly. This will continue to give buyers more time to make informed decisions and potentially negotiate better prices.
  • The competition for homes will remain but will become less fierce. While the market is still competitive, the pressure will ease as the market becomes more balanced.

Factors Influencing the Long Beach CA Housing Market

Several factors influence the Long Beach CA housing market, and it's important to be aware of them when making decisions about buying or selling a home.

1. Interest Rates: Interest rates have a huge impact on the affordability of buying a home. Higher interest rates make it more expensive to borrow money, which can reduce the number of people who can afford to buy a home. As of October 2024, we've seen a rise in interest rates, which has caused a slight slowdown in the pace of home price growth in Long Beach.

2. Job Market: The Long Beach job market is diverse and relatively strong, with industries such as aerospace, healthcare, and tourism. The strong job market attracts people to the area, which creates demand for housing. A strong job market can make the housing market more competitive, and we've seen that continue to be the case in Long Beach.

3. Economy: The overall health of the national and regional economy can influence the housing market. Economic downturns can lead to job losses and reduced consumer confidence, which can cause a decrease in home sales and potentially price reductions. The Long Beach economy has shown resilience in the face of recent economic challenges, leading to continued demand for housing.

4. Demographics: The demographics of an area can also influence the housing market. The population of Long Beach is diverse, with a mix of young professionals, families, and retirees. The diverse population creates a variety of housing demands, contributing to the sustained activity in the market.

5. Lifestyle and Amenities: Long Beach offers a unique blend of urban amenities and beachside relaxation. The city has a vibrant arts and culture scene, along with a wide range of recreational opportunities. This desirable lifestyle attracts people to the area, creating continuous demand for housing and contributing to the competitive nature of the market.

6. Inventory: As I mentioned earlier, the housing inventory in Long Beach is still relatively tight. This shortage of homes for sale continues to create upward pressure on prices. The inventory levels are closely linked to the construction and development activities in the area and the overall economic health of the region.

Conclusion

The Long Beach CA housing market presents a unique opportunity for both buyers and sellers. While the market is still competitive, it is shifting toward a more balanced state with a slower rate of price growth. Buyers have more opportunities to negotiate, and sellers need to be strategic with their pricing.

Recommended Read:

  • 10 Best Beach Towns for Short-Term Rental Investment
  • Anaheim, California Joins Trillion-Dollar Club of Housing Markets
  • Real Estate Forecast Next 5 Years California: Crash or Boom?
  • Will Housing Prices Drop in 2025 in California: The Forecast
  • Los Angeles Housing Market: Prices, Trends, Forecast 2024-2025
  • Anaheim Housing Market Forecast for the Next 2 Years: 2025-2026

Filed Under: Housing Market, Real Estate Market Tagged With: Housing Market, Long Beach

  • « Previous Page
  • 1
  • …
  • 242
  • 243
  • 244
  • 245
  • 246
  • …
  • 379
  • Next Page »

Real Estate

  • Birmingham
  • Cape Coral
  • Charlotte
  • Chicago

Quick Links

  • Markets
  • Membership
  • Notes
  • Contact Us

Blog Posts

  • 20 Best U.S. Cities to Invest in Real Estate in 2026
    July 27, 2026Marco Santarelli
  • Today’s Mortgage Rates, July 27: 30-Year Fixed Jumps to 6.70%, Even VA Loans Climb
    July 27, 2026Marco Santarelli
  • Interest Rate Predictions for the Next 5 Years: 2026-2030
    July 27, 2026Marco Santarelli

Contact

Norada Real Estate Investments 30251 Golden Lantern, Suite E-261 Laguna Niguel, CA 92677

(949) 218-6668
(800) 611-3060
BBB
  • Terms of Use
  • |
  • Privacy Policy
  • |
  • Testimonials
  • |
  • Suggestions?
  • |
  • Home

Copyright 2018 Norada Real Estate Investments

Loading...