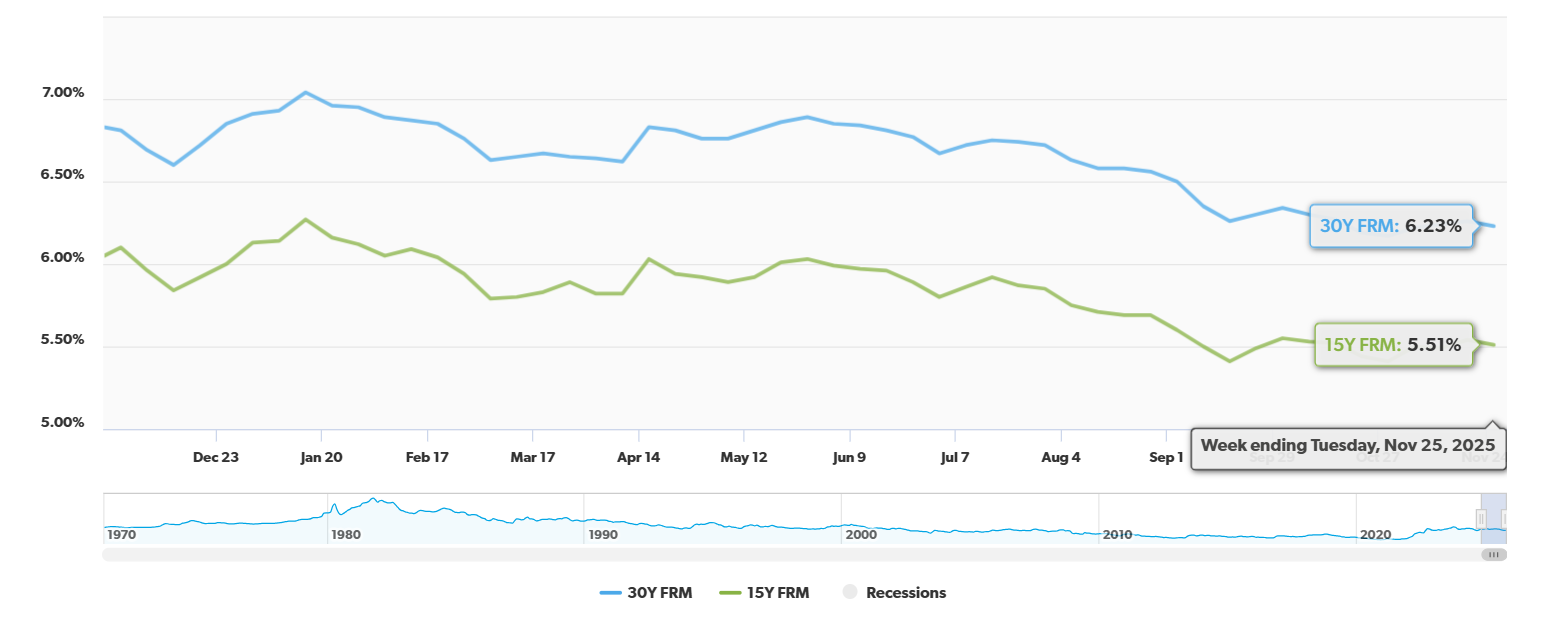
Finally, we're seeing some encouraging movement in the mortgage market. Today's mortgage rates, November 28th, are showing a welcome dip, with some lenders now offering deals on 30-year fixed loans at or even below 6%. This is a significant moment for anyone looking to buy a home or refinance their existing mortgage, offering a real chance to secure more favorable financing. I’ve been watching these numbers closely, and this trend is the most competitive we’ve seen in months.
Today's Mortgage Rates, Nov 28: 30-Year FRM Drops to 6% as Lenders Roll Out Lowest Offers
What the Numbers Look Like Today
Let’s break down the current situation based on the latest data from Zillow. These are the national averages, so keep in mind your specific offer might be a little different depending on your credit score, down payment, and the lender you choose.
Here's a snapshot of the current mortgage rates:
| Loan Type | Average Rate |
|---|---|
| 30-year fixed | 6.00% |
| 20-year fixed | 5.86% |
| 15-year fixed | 5.50% |
| 5/1 ARM | 6.11% |
| 7/1 ARM | 6.15% |
| 30-year VA | 5.44% |
| 15-year VA | 5.10% |
| 5/1 VA | 5.11% |
It’s important to note that these are averages. They’re rounded to the nearest hundredth, giving us a clear picture of the market's general direction.
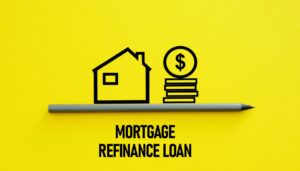
Refinancing Opportunities: A Smart Move for Many
If you already own a home, this shift in rates might present a golden opportunity to refinance. Lowering your interest rate can mean more money in your pocket each month, which can be used for anything from paying down debt to saving for a future goal.
Here are the national averages for mortgage refinance rates, according to Zillow:
| Loan Type | Average Rate |
|---|---|
| 30-year fixed | 6.14% |
| 20-year fixed | 6.05% |
| 15-year fixed | 5.60% |
| 5/1 ARM | 6.55% |
| 7/1 ARM | 6.72% |
| 30-year VA | 5.57% |
| 15-year VA | 5.18% |
| 5/1 VA | 5.04% |
As you can see, the refinance rates are generally a touch higher than the purchase rates, which is typical. However, the gap has narrowed considerably, making refinancing a very attractive option right now.
Why Shopping Multiple Lenders Really Matters
I can’t stress this enough: your experience shopping for a mortgage is not guaranteed to be the same as your neighbor's. Lenders have different algorithms, risk assessments, and profit margins. What one lender offers you could be significantly different from what another offers. For example, one lender might offer you a 6.00% rate on a 30-year fixed loan, while another, on the very same day, might offer you 5.875%. Over the life of a 30-year mortgage, that seemingly small difference can add up to tens of thousands of dollars in savings.
Think of it like getting quotes for car insurance. You wouldn't just go with the first company you call, right? You shop around to find the best coverage at the best price. A mortgage is one of the biggest financial decisions you'll make, so applying that same diligence is essential. I always tell people to pull quotes from at least three different types of lenders: a large national bank, a local credit union, and an online mortgage lender. This broad approach often captures the best possible rate.
The Impact of Sub-6% Rates on Buyer Affordability
The return of rates dipping below the 6% mark is a breath of fresh air for potential homebuyers. For many years, we weren't even close to these numbers, and the ultra-low rates of the pandemic era (think 2-3%) feel like a distant memory. However, a rate in the 5-6% range can make a tangible difference in monthly payments compared to rates in the 7% range.
Let's do a quick, simplified comparison:
- Scenario 1 (Hypothetical Buyer): A $400,000 loan at 7.0% (30-year fixed) results in a principal and interest payment of approximately $2,661.
- Scenario 2 (Same Buyer): A $400,000 loan at 6.0% (30-year fixed) results in a principal and interest payment of approximately $2,398.
That's a difference of roughly $263 per month, or nearly $9,500 over three years. This extra cash can help offset other rising costs or allow a buyer to afford a slightly more expensive home, moving them closer to their ideal property.
However, it's crucial to acknowledge that while rates are easing, the overall housing market affordability remains a challenge. Home prices, in many areas, are still significantly elevated from pre-pandemic levels. So, while lower rates help, they don't entirely solve the affordability puzzle for everyone.
Comparing 30-Year vs. 15-Year Fixed Loans in Today's Market
When you're looking at mortgages, you often hear about the 30-year fixed and the 15-year fixed options. Each has its pros and cons, and the “best” choice really depends on your financial goals and circumstances.
- 30-Year Fixed: Features lower monthly payments, making it more accessible for a wider range of buyers. However, you'll pay more interest over the life of the loan. With current rates around 6.00%, it's a solid option for those who need a more manageable monthly budget.
- 15-Year Fixed: Offers a lower interest rate (currently 5.50%) and you'll pay off your mortgage much faster. This means you save a significant amount on interest over time. The trade-off is higher monthly payments. This is a great choice if you have the financial capacity to handle the increased payments and want to build equity quicker.
Personally, I often lean towards advising clients who can manage it to consider the 15-year fixed, even if it means stretching their budget a bit. The long-term interest savings are substantial. But if the monthly payment on a 15-year loan is simply too high, the 30-year option at these improved rates is still a very good deal compared to what we've seen recently.
Key News and Trends Shaping Today's Rates
So, what's causing these rates to move in a favorable direction? It’s a combination of factors, with the Federal Reserve's actions and the market's reaction playing a big role.
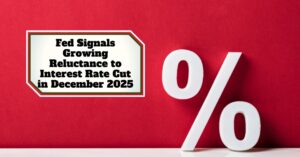
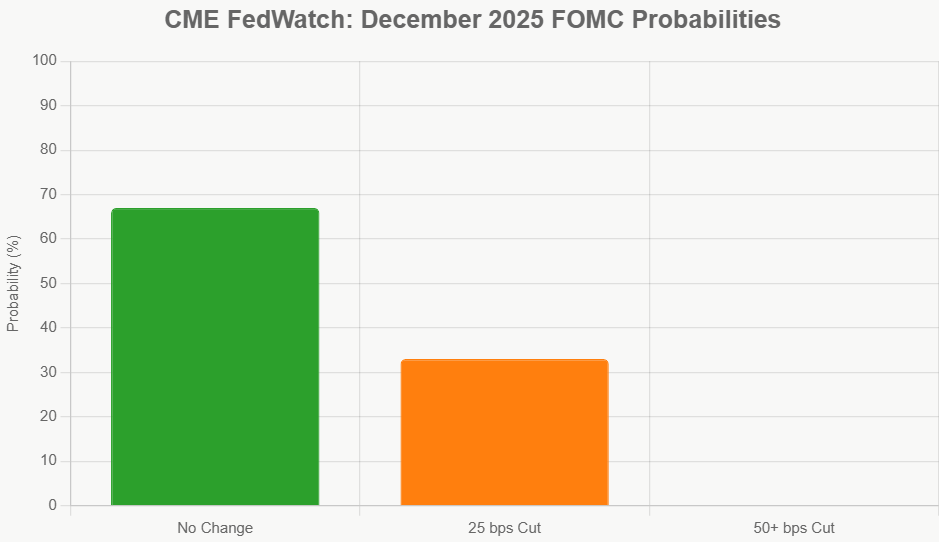
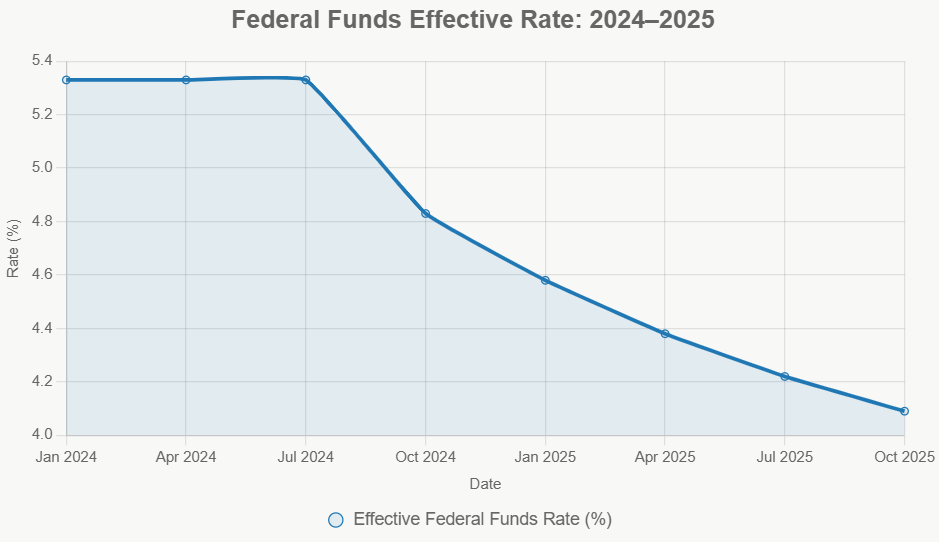
- Recent Fed Action: The Federal Reserve has made some moves, with two quarter-point rate cuts in September and October of next year (2025). This might seem far off, but the market is forward-looking. There's growing confidence about a third rate cut happening at the December meeting of next year (2025), which is a significant driver pushing mortgage rates downward.
- Market Anticipation: Mortgage rates aren't directly set by the Fed, but they are heavily influenced by what the Fed might do. Lenders are already pricing in the expectation of these rate cuts. However, some financial analysts are warning that rates might not continuously fall forever. There could be a point where they stabilize or even tick up slightly if economic conditions change.
- Housing Market Impact: This downward trend in rates is certainly providing some much-needed relief for potential homebuyers. It helps to counteract some of the sticker shock from higher home prices. But, as I mentioned, affordability remains a central issue for many.
- Historic Context: It's worth remembering that even with rates around 6%, we're still in a much better position than we were for much of the past 40 years. The era of incredibly low rates between the pandemic's start and late 2021 was an anomaly. Experts widely agree that those super-low 2-3% rates are highly unlikely to return in the foreseeable future.
- Analyst Outlook: Looking ahead, forecasts for 2026 and 2027 are varied. Some economists predict that mortgage rates could stabilize in the mid-6% range. Others are cautiously optimistic that rates might even dip a bit further, perhaps into the low 6% range. It's a dynamic situation, and keeping an eye on economic indicators will be key.
What This Means for You
As we wrap up November, the mortgage market is offering a more welcoming environment for buyers and refinancers. The rates we're seeing today, especially on fixed-rate loans, are a good sign.
My perspective is that if you've been on the fence about buying or refinancing, now is a prime time to start seriously exploring your options. Get pre-approved, talk to multiple lenders, and understand exactly what you can afford. Locking in a rate in the 5-6% range now, rather than waiting for potentially unstable future conditions, could be a very smart financial move. The “perfect” time to buy or refinance is often the time that works best for your personal financial situation, and right now, it looks pretty good.
Invest Smartly in Turnkey Rental Properties
With rates dipping to their lowest levels, investors are locking in financing to maximize cash flow and long-term returns.
Norada Real Estate helps you seize this rare opportunity with turnkey rental properties in strong markets—so you can build passive income while borrowing costs remain historically low.
🔥 HOT NEW LISTINGS JUST ADDED! 🔥
Talk to a Norada investment counselor today (No Obligation):
(800) 611-3060
Also Read:
- Mortgage Rates Predictions Backed by 7 Leading Experts: 2025–2026
- Mortgage Rate Predictions for the Next 3 Years: 2026, 2027, 2028
- 30-Year Fixed Mortgage Rate Forecast for the Next 5 Years
- 15-Year Fixed Mortgage Rate Predictions for Next 5 Years: 2025-2029
- Will Mortgage Rates Ever Be 3% Again in the Future?
- Mortgage Rates Predictions for Next 2 Years
- Mortgage Rate Predictions for Next 5 Years
- Mortgage Rate Predictions: Why 2% and 3% Rates are Out of Reach
- How Lower Mortgage Rates Can Save You Thousands?
- How to Get a Low Mortgage Interest Rate?
- Will Mortgage Rates Ever Be 4% Again?