Norada Real Estate Investments

  • Home
  • Markets
  • Properties
  • Membership
  • Podcast
  • Learn
  • About
  • Contact

Boston Housing Market: Trends and Forecast 2025-2026

August 3, 2025 by Marco Santarelli

Boston Housing Market

The current Boston housing market trends are definitely something to talk about, especially if you're thinking about buying or selling a home in the area. Here's the deal: If you're looking at single-family homes, be prepared for some sticker shock. The median price just hit over $1 million for the first time ever! Condos, on the other hand, are holding pretty steady. Let's dive into the specifics to give you a clear picture.

Current Boston Housing Market Trends: What's Happening Right Now?

Home Sales

Okay, so let's break down what's been happening with home sales. Overall, sales are up compared to last year and the previous month. People are still buying, even with those high prices!

  • Single-Family Homes: According to the Greater Boston Association of Realtors® (GBAR), in June, 1,292 homes were sold. That's a 19.6% increase from May and a 5.8% bump from June of last year.
  • Condos: 986 condos found new owners, which is a 2.8% rise from May and a 1.8% increase from June 2024.

So, what does this tell us? People are still interested in buying, but perhaps with varying preferences for property types.

Home Prices

This is where things get interesting, especially for single-family homes. Buckle up!

  • Single-Family Homes: The median price hit $1,003,250. That's a 2.4% increase from May's $980,000 and a 4.5% jump from last June's $960,000.
  • Condos: The median price landed at $725,000. Interestingly, that's down 3.3% from both May and June of the previous year (which were both at $750,000).

I think we can see a distinct trend here: single-family homes are skyrocketing, while condos are being more stable. If you're thinking of buying, you should consider that.

Are Home Prices Dropping in Boston?

Not exactly, especially not for single-family homes. While some folks might hope for a price drop, the data doesn't really show that happening right now. Condo prices have experienced a small dip. According to Mark Triglione, President of the Greater Boston Association of REALTORS, folks have seen inventory rise in some markets, leading buyers to believe they may see some relief on prices, but the data and buying behavior continues to defy that notion.
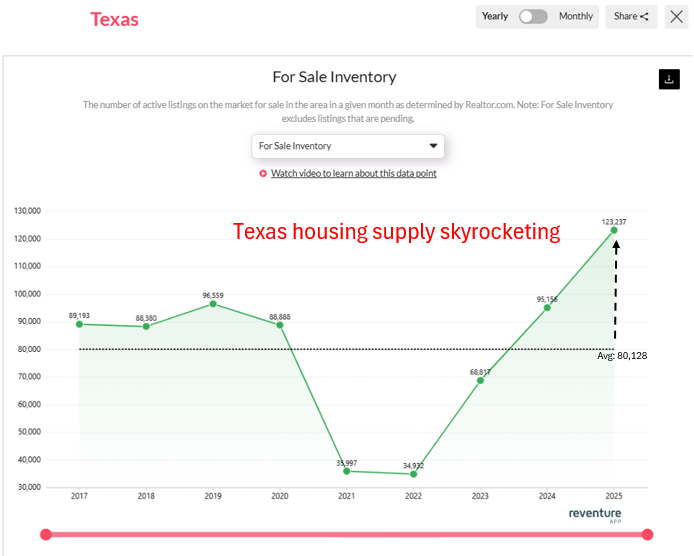
Housing Supply

Supply is super important because it influences prices. When there are more homes available, buyers have more choices, and prices tend to stabilize or even go down. Let's see what's happening in Boston.

  • Single-Family Homes: 1,528 new single-family homes hit the market. That's down 13.4% from May but up 8.9% from June of last year.
  • Condos: 1,437 new condos became available. That's a decrease of 8.1% from May, but a pretty significant increase of 19.4% compared to last June.

The supply of single-family homes is struggling to keep pace with demand, which is likely contributing to those high prices.

Is Bostona Buyer's or Seller's Housing Market?

Generally, a “seller's market” means there are more buyers than homes available, giving sellers the upper hand. A “buyer's market” is the opposite. Based on the data, Boston is more of a seller's market for single-family homes. The demand is high, the supply is struggling to keep up, and prices are rising. Condos seem to be more balanced.

One way to tell is how long homes stay on the market:

  • Single-Family Homes: The median number of days on the market is 19, up 18.8% from May and 11.8% from June 2024.
  • Condos: The median number of days on the market is 23, increasing 9.5% from May and 15% from June 2024.

Market Trends

So, what are some overall trends we can see in the Boston housing market?

  • High Demand for Single-Family Homes: The desire to own a single-family home in Boston is still strong, even with those high prices.
  • Condo Stability: Condo prices are more stable, which could make them an attractive option for some buyers.
  • Slightly Increasing Inventory: While still tight, there's been a small increase in the number of homes for sale compared to last year.
  • Homes Selling Quickly: When priced right, homes are still flying off the market, especially single-family homes.

I'm seeing that location, location, location still holds true. Certain neighborhoods will always be in high demand, which keeps the pressure on prices.

Impact of High Mortgage Rates

Let's not forget about mortgage rates. They play a huge role in the housing market. Right now, the average 30-year fixed mortgage rate is around 6.72%, and the 15-year is about 5.85% (as of 07/31/2025).

These rates are high compared to recent years, which definitely impacts affordability. It means buyers have to pay more each month, even if the price of the home stays the same. Despite these high rates, the Boston housing market has remained resilient. Some economists predict these rates may fall to around 6.0% – 6.5% by the end of 2025, but who really knows?

Mortgage Rate Comparison (as of 07/31/2025)

Mortgage Type Interest Rate
30-Year Fixed Rate 6.72%
15-Year Fixed Rate 5.85%

These rates have largely stayed in this range since mid-April, which gives borrowers some stability to work with. Continued economic growth, along with moderating home prices and rising inventory, should be a good sign for buyers and sellers alike.

In Conclusion

The current Boston housing market trends show a tale of two cities (sort of!). Single-family homes are experiencing record-high prices and high demand, while the condo market is a bit more stable. High mortgage rates are a factor, but haven't stopped the market completely. As someone who has lived in the Boston area for 20 years and watched how the market has changed, I can tell you that Boston real estate has always been competitive.

Boston Housing Market Forecast 2025-2026: Will Prices Drop?

You're probably wondering what's going to happen with home prices. So, what's the scoop on the Boston housing market forecast? According to Zillow’s latest projections, the Boston housing market isn't headed for a crash, but a slight cooling is expected. Let's dive into what these forecasts actually mean for you.

Is Boston's Housing Market Cooling Down?

The Boston-Cambridge-Newton area has seen a 2.3% increase in home values over the past year, with an average home value of $733,270. Homes are moving quickly, typically going pending in around 7 days. However, recent forecasts suggest a bit of a shift. Here's a breakdown of what analysts predict:

  • July 2025: Zillow forecasts a 0.4% decrease in home values for the Boston metro area.
  • September 2025: The forecast anticipates a further dip of 1.3%.
  • Year-End (June 2026): Looking at a one-year projection, from June 2025 to June 2026, the prediction is a 1.6% decrease.

What Does This Mean for Homeowners and Buyers?

While these numbers might seem small, they suggest a slight softening in the market. For homeowners, it means that the rapid price growth we've seen in recent years might be slowing down. It's still a solid market, but pricing your home competitively will be crucial.

For buyers, this could be welcome news. A slight dip in prices could offer more opportunities and potentially ease some of the pressure in the market. Keep a close eye on interest rates, as they play a huge role in affordability.

Across Massachusetts: How Does Boston Compare?

Let's see how Boston's forecast stacks up against other areas in Massachusetts:

Region July 2025 Change September 2025 Change June 2026 Change
Boston, MA -0.4% -1.3% -1.6%
Springfield, MA -0.3% -1.0% -0.6%
Worcester, MA -0.3% -1.0% 0.1%
Pittsfield, MA -0.1% -0.8% 0.9%
Vineyard Haven, MA -0.4% -0.9% 1.1%
Barnstable Town, MA -0.3% -0.7% 1.4%

As you can see, most areas in Massachusetts are expected to see at least a short term decline, but some like Barnstable Town are expected to actually see growth in the longer one year timeframe.

National Trends and Expert Opinions

Lawrence Yun, Chief Economist for the National Association of Realtors (NAR), believes things are looking up nationally. He forecasts:

  • Existing home sales to rise by 6% in 2025 and 11% in 2026.
  • New home sales to increase by 10% in 2025 and 5% in 2026.
  • Median home prices to continue increasing modestly, with a projected rise of 3% in 2025 and 4% in 2026.
  • Mortgage rates to average 6.4% in the second half of 2025 and dip to 6.1% in 2026.

A Possible Boston Housing Market Forecast for 2026 and Beyond

Based on these trends, I believe the Boston real estate market will likely stabilize after the slight dip predicted for 2025. The demand for housing in Boston remains strong due to its universities, healthcare, and job market. If mortgage rates continue to fall as predicted by experts, the market may shift once again.

Will the Boston Housing Market Crash?

No, a crash is unlikely. A slight price decrease is not the same as a collapse. Several factors support Boston's housing market: a strong local economy, limited housing supply, and continued demand. While there might be some bumps in the road, a full-blown crash is not on the horizon.

I've seen markets go up and down over the years. Based on my experience I believe taking a long-term approach to real estate ownership is the best way to think about it. Over time real estate values tend to increase, even when there are times when we wonder if it's all going to come crashing down.

Should You Invest in the Boston Real Estate Market?

Boston, a city steeped in history, academic prestige, and a booming job market, has long been a magnet for residents and investors alike. But with a reputation for high property values, is the Boston real estate market the right fit for you? Let's delve into the pros and cons to help you make an informed decision.

Pros: A Perfect Storm for Investors

  • Steady Rental Demand: Fueled by a large student population, young professionals, and a growing population, Boston boasts a remarkably strong rental market. This translates to consistent income for investors, making it a great option for those seeking reliable cash flow. Boston's population grew 9.4% from 2010 to 2020, reaching 675,647 people, making it the 24th largest city in the United States. Boston's population is projected to grow to 710,000–724,000 by 2030, and 801,000 by 2050. More than a third of this growth is expected to occur in the South End, Downtown, East Boston, Dorchester, and the Seaport. This rising population, coupled with a limited supply of housing units, creates a situation where rental demand is likely to stay strong, benefitting investors.
  • Appreciation Potential: Historically, Boston has seen significant property value appreciation. This trend, coupled with a limited supply of housing units, suggests that investments here have the potential for high returns in the long run.
  • Rock-Solid Economy: Boston's economy has grown significantly since 2001, with the Greater Boston metro area's GDP increasing from $284.1 billion in 2001 to $504.1 billion in 2022. In 2020, per capita personal income in Metro Boston was $89,568, which is 24% higher than 2010 and 34% higher than 2000. This economic strength translates to a stable job market, which fuels rental demand and property value appreciation. With a diversified economy spanning world-renowned universities, healthcare institutions, a thriving tech sector, and a financial hub, Boston is well-positioned to weather economic downturns, minimizing risk for investors.
  • Future-Proof Growth: It's important to note that while Boston's population has seen a slight decline since the 2020 census, reaching 629,842 in 2024, this is projected to be a temporary dip. Long-term projections still suggest continued population growth, fueled by the city's strong job market and attractive qualities for young professionals and families. As the city grows, the demand for housing is likely to rise, further bolstering property values and rental rates.
  • Favorable Financing: Boston's robust financial sector translates to a wide range of lenders and banks competing for your business. This competition translates into favorable loan terms and rates for qualified investors. Additionally, many lenders in Boston specialize in real estate financing, and have a deep understanding of the local market. This expertise can be invaluable for investors, as lenders can provide guidance on property selection, financing options, and current market trends. Having access to a pool of lenders with experience in the Boston real estate market allows investors to shop around and secure the most competitive financing package for their investment property.

Cons: Challenges to Consider

  • High Entry Point: Let's be honest, Boston isn't cheap. The high cost of living translates to a high barrier to entry for real estate investors. A sizable down payment is often required, and investors need to be prepared for potentially competitive bidding situations.
  • Management Considerations: Managing a rental property can be time-consuming, especially for those unfamiliar with the process. Investors should factor in property management fees or be prepared to manage the property themselves.
  • Market Fluctuations: While historically stable, no real estate market is immune to fluctuations. Investors should have a long-term outlook and be prepared to weather any potential dips in the market.

Beyond the Numbers: Finding the Right Fit

While the data paints a promising picture, there's more to consider than just market trends. Here are some additional factors to weigh:

  • Investment Goals: Are you seeking steady rental income or long-term appreciation? Understanding your goals will help you choose the right property type and investment strategy.
  • Risk Tolerance: Real estate, like any investment, carries inherent risks. Be honest with yourself about your comfort level with market fluctuations and potential vacancies.
  • Location, Location, Location: Boston offers a diverse range of neighborhoods, each with its own unique character and market dynamics. Research different areas to find one that aligns with your investment goals and budget.

Investing in Boston Real Estate: The Final Verdict

Boston's real estate market presents a compelling opportunity for investors with a long-term perspective and a healthy risk tolerance. The strong rental market, potential for appreciation, and diversified economy make it a solid choice for those seeking a stable investment. However, the high entry cost and management considerations should be carefully evaluated before diving in.

By carefully considering your financial goals and risk tolerance, combined with thorough research into specific neighborhoods, you can make an informed decision about whether the Boston real estate market is the right fit for your investment portfolio.

Boston's Booming Neighborhoods: Top Spots for Recent Real Estate Growth

The Boston housing market continues to be a force, with property values steadily rising across the city. However, some neighborhoods have witnessed particularly impressive growth over the past five years. Let's dive into the hottest neighborhoods that have seen significant real estate appreciation (Neighborhoodscout).

  • Seaport District North: This waterfront neighborhood has seen explosive growth in recent years, with new luxury condos, offices, and shops popping up all over the place. It's a great place to live if you're looking for a trendy, walkable neighborhood with stunning views of the harbor.
  • Beacon Hill East: This historic neighborhood is known for its cobblestone streets, gaslit lamps, and charming brick row houses. It's a great place to live if you're looking for a quiet, upscale neighborhood with a strong sense of community.
  • Leather District / Downtown Crossing: This area has undergone a major transformation in recent years, from a gritty industrial district to a trendy hub of shops, restaurants, and lofts. It's a great place to live if you're looking for a lively, central neighborhood with plenty of character.
  • Shawmut East: This up-and-coming neighborhood is located just south of downtown Boston and is home to a mix of historic brownstones, new construction condos, and hip restaurants. It's a great place to live if you're looking for a vibrant, affordable neighborhood with a lot of potential.
  • Seaport District: This waterfront neighborhood is home to the Boston Convention Center, the Boston Harbor Hotel, and a number of luxury condos. It's a great place to live if you're looking for a modern, amenity-rich neighborhood with stunning views of the harbor.
  • Brighton East: This neighborhood is located just west of Boston and is home to a mix of students, young professionals, and families. It's a great place to live if you're looking for an affordable, diverse neighborhood with a lively bar scene.
  • Boston University: This neighborhood is home to Boston University and a number of other colleges and universities. It's a great place to live if you're looking for a vibrant, youthful neighborhood with plenty of bars and restaurants.
  • South End: This historic neighborhood is known for its Victorian brownstones, tree-lined streets, and diverse population. It's a great place to live if you're looking for a charming, walkable neighborhood with a strong sense of community.
  • North Allston: This neighborhood is located just west of Boston and is home to a mix of students, young professionals, and families. It's a great place to live if you're looking for an affordable, diverse neighborhood with a close-knit community.
  • Back Bay West / Berklee College of Music: This neighborhood is home to Berklee College of Music and a number of other arts institutions. It's a great place to live if you're looking for a vibrant, creative neighborhood with plenty of bars and restaurants.

These are just a few of the many great neighborhoods in Boston. When choosing a neighborhood to live in, it's important to consider your own needs and preferences. Think about how close you want to be to work or school, what kind of amenities are important to you, and what kind of atmosphere you're looking for.

Recommended Read:

  • Massachusetts Housing Market Forecast 2025-2026: Insights for Buyers
  • Massachusetts Housing Market: Trends and Forecast 2024-2025
  • Massachusetts First-Time Home Buyer Grants: Your Complete Guide
  • Guide to Average Down Payment on a House in Massachusetts
  • Top 10 Priciest States to Buy a House by 2030: Expert Predictions
  • Average House Prices by State in USA

Filed Under: Housing Market, Real Estate Investing Tagged With: Boston, Housing Market

20 Worst Housing Markets Facing Biggest Price Crash or Correction by 2026

August 2, 2025 by Marco Santarelli

20 Worst Housing Markets Bracing for the Biggest Price Crash by 2026

Worried about where the housing market might tank next? You’re in the right spot. The numbers don’t lie – home values in the United States are forecast to dip 1.4% nationwide, and some cities? They’re staring down steeper drops. While the national average shows a modest cooling, these 20 regions are flashing red flags. We dug into the latest forecasts to spotlight the 20 riskiest or worst housing markets where prices could tumble or crash between now and May 2026.

20 Worst Housing Markets Facing Biggest Price Crash or Correction by 2026 🏠💸

📉 What’s Going Down (and Why) Between Now and 2026

Before we jump into the list, let's talk about why some housing markets might be heading for a correction. Several factors are at play:

  • Rising Inventory: More homes on the market mean buyers have more choices, giving them leverage to negotiate lower prices. I’ve seen this firsthand in my own neighborhood – when several similar homes hit the market, prices softened quickly.
  • Elevated Mortgage Rates: High mortgage rates in 2025 are primarily driven by the Federal Reserve's efforts to combat inflation, which has led to higher borrowing costs across the board, alongside factors like ongoing economic uncertainty influenced by potential trade measures and government spending, and strong demand in the housing market coupled with limited supply. Higher rates make buying a home more expensive, sidelining some potential buyers. This reduced demand can lead to price drops, especially in areas where affordability is already stretched thin.
  • Labor Market Concerns: Economic uncertainty and potential job losses can make people hesitant to make big purchases like homes. Factors like trade policy changes, reciprocal tariffs, fluctuating interest rates, and evolving immigration policies are creating uncertainty for businesses, potentially impacting hiring and investment decisions
  • Rental Market Shifts: New construction is impacting the rental market, driving up vacancy rates and slowing rent growth. This can indirectly affect the housing market, as some potential buyers may opt to rent for longer.

Understanding the Data

The following analysis is based on Zillow's projections and focuses on Metropolitan Statistical Areas (MSAs). These are regions consisting of at least one urbanized area with a population of 50,000 or more, plus adjacent counties that have a high degree of social and economic integration with the core.

Here's a breakdown of the data used in this analysis:

  • Market: The specific Metropolitan Statistical Area (MSA).
  • Area Type: Metropolitan Statistical Area.
  • State: The state where the MSA is located.
  • Base Date: Represents the starting month for price level change.
  • Price Change Projection as of June 30, 2025: Projected price change.
  • Price Change Projection as of August 31, 2025: Projected price change.
  • Price Change Projection as of May 31, 2026: Projected price change.

Now, let's dive into the list. Remember, these are projections, and things can change. However, these areas are currently identified as being at higher risk of price declines.

Here is the list of the 20 Worst Housing Markets on the Verge of a Big Price Decline in one year from now:

Housing Markets Facing Price Declines

The 20 Housing Markets Facing the Biggest Price Declines

Price projections from May 2025 to May 2026

Rank Market State Jun 30, 2025 Aug 31, 2025 May 31, 2026
1 Greenville, MS MS -2.6% -5.5% -15.0%
2 Pecos, TX TX -1.5% -3.8% -14.2%
3 Clarksdale, MS MS -3.1% -7.3% -13.6%
4 Cleveland, MS MS -2.0% -5.1% -13.4%
5 Bennettsville, SC SC -3.0% -6.0% -12.9%
6 Raymondville, TX TX -2.1% -4.9% -12.1%
7 Opelousas, LA LA -1.9% -4.6% -11.6%
8 Morgan City, LA LA -2.6% -5.7% -10.6%
9 Big Spring, TX TX -0.4% -2.2% -10.5%
10 Natchez, MS LA -2.6% -5.3% -10.3%
11 Zapata, TX TX -1.8% -3.5% -10.3%
12 Helena, AR AR -1.0% -2.1% -10.2%
13 Indianola, MS MS -2.6% -4.9% -10.1%
14 Johnstown, PA PA -1.6% -4.5% -10.0%
15 Hobbs, NM NM -0.5% -1.7% -10.0%
16 Alice, TX TX -0.5% -2.0% -9.6%
17 Beeville, TX TX -1.3% -3.2% -9.6%
18 DeRidder, LA LA -0.6% -2.0% -9.5%
19 Houma, LA LA -0.9% -2.7% -9.4%
20 Bogalusa, LA LA -1.5% -3.6% -9.4%

A Closer Look at Some of These Markets

Let's take a moment to examine some of these markets more closely and understand some of the factors that might be contributing to the projected declines.

  • Greenville, MS: Located in the Mississippi Delta, Greenville's economy has historically been tied to agriculture. Declining agricultural opportunities and population shifts could be contributing to housing market weakness.
  • Pecos, TX: Pecos has seen significant growth due to the oil and gas industry. However, fluctuations in energy prices can lead to booms and busts, impacting housing demand. A sustained downturn in the energy sector could explain the projected decline.
  • Clarksdale, MS: Famous for its blues music heritage, Clarksdale faces economic challenges similar to other parts of the Mississippi Delta. Limited job opportunities and population loss are likely factors.
  • Johnstown, PA: Once a major steel production center, Johnstown has struggled with economic diversification. The decline of the steel industry has had a lasting impact on the area's economic prospects and housing market.

Why Are These Markets Particularly Vulnerable?

Several factors might make these markets more susceptible to housing price declines:

  • Economic Dependence on a Single Industry: Many of these areas rely heavily on one or two industries (like agriculture, oil and gas, or manufacturing). If those industries suffer, the entire local economy can take a hit.
  • Population Decline: Some of these areas have been losing population for years. Fewer residents mean less demand for housing.
  • Limited Job Opportunities: Lack of diverse job opportunities can make it difficult to attract and retain residents, impacting the housing market.
  • Affordability Issues: While prices might be lower compared to national averages, affordability can still be a problem for many residents in these areas, especially if wages are stagnant.

What Does This Mean for Buyers and Sellers?

If you're thinking of buying or selling in one of these markets, here's what you should keep in mind:

  • For Sellers: Be realistic about pricing. Overpricing your home could mean it sits on the market for longer, and you might eventually have to lower the price anyway. Consider making improvements to make your home more attractive to buyers.
  • For Buyers: You might have more negotiating power. Take your time, do your research, and don't be afraid to make a lower offer. However, be mindful of the risks involved in buying in a declining market.

National Trends in Home Values and Sales

Even though some markets are expected to decline, it's important to look at the bigger picture. Here's what Zillow projects for the national housing market:

  • Home Values: A nationwide decline of 1.4% is projected. However, this varies significantly by region.
  • Existing Home Sales: The projection is around 4.14 million sales, a 1.9% increase from 2024. Increased inventory is expected to drive sales.

The Rental Market Outlook

The rental market is also seeing some changes:

  • Single-Family Rents: Expected to rise by 2.8% in 2025.
  • Multi-Family Rents: Expected to increase by 1.6% in 2025.

These forecasts have been revised downward due to increased construction and higher vacancy rates. This suggests that renters might have more options and less pressure from rising rents in some areas.

Final Thoughts

The housing market is always changing. While these projections offer valuable insights, it's important to remember that they are not guarantees. Economic conditions, local developments, and other unforeseen events can all impact housing prices.

If you're considering making a move, do your homework, consult with real estate professionals, and make informed decisions based on your individual circumstances.

Invest in Real Estate in the Booming Markets of the U.S.

Discover high-quality, ready-to-rent properties designed to deliver consistent returns.

Contact us today to expand your real estate portfolio with confidence.

Contact our investment counselors (No Obligation):

(800) 611-3060

Get Started Now 

Recommended Read:

  • 10 Housing Markets Predicted to Boom Amid Economic Uncertainty in 2025
  • Top 10 Housing Markets Seeing Incredible Double-Digit Growth in 2025
  • Top 10 Housing Markets Attracting Foreign Homebuyers in 2025
  • Top 15 Real Estate Markets to Buy Investment Properties in 2025
  • 20 Best Places to Buy a House in the US
  • Best Places to Invest in Single-Family Rental Properties
  • 5 Best Places to Buy and Sell a House in Spring 2025
  • 10 Best States to Buy a House in 2025
  • Top 10 Least Expensive Places to Buy a House in 2025
  • Top 10 Housing Markets Where Gen Zs Are Buying Homes
  • Top 20 Hottest Housing Markets Predicted for 2025
  • 10 Hottest Housing Markets Predicted for 2025: Sun Belt Boom
  • 5 Hottest Real Estate Markets for Buyers & Investors in 2025

Filed Under: Housing Market, Real Estate Market Tagged With: Housing Market, housing market crash, housing market predictions, Worst Housing Markets

Pending Home Sales: Trends and Forecast 2025-2026

August 1, 2025 by Marco Santarelli

The latest news on the housing market is that the pending home sales dropped in June, signaling that the housing market isn't exactly booming right now. Specifically, the Pending Home Sales Index fell 0.8% from May and 2.8% year-over-year, according to the National Association of Realtors®. This means fewer people are signing contracts to buy homes, and that has a ripple effect on the entire market.

Pending Home Sales: Trends and Forecast 2025-2026

The biggest culprit behind this decline in pending home sales is affordability. And honestly, I'm not surprised. I've been watching these trends for a while, and it’s clear that rising home prices combined with stubbornly high mortgage rates are squeezing many potential buyers out of the market. It's a double whammy that makes it hard to jump into homeownership.

Think about this:

  • The national median sales price for existing homes hit an all-time high of $435,300 in June 2025.
  • While average 30-year mortgage rates eased slightly to 6.77% at the end of June, they're still high.

This combination makes it challenging for many, especially first-time buyers, to afford a home. We have also seen sentiment decline in surveys, with only 28% saying it is a good time to buy.

What's Driving This Affordability Crisis?

Several factors contribute to the lack of affordability:

  • High Home Prices: Years of low interest rates and high demand drove home prices to record levels. Even though we're seeing some price softening in some areas, prices are still elevated.
  • Elevated Mortgage Rates: The Federal Reserve's efforts to combat inflation have resulted in higher mortgage rates, making borrowing more expensive.
  • Economic Uncertainty: With inflation still a concern and fears of a potential recession lingering, many buyers are hesitant to make a big financial commitment.

Regional Differences: A Patchwork Market

While the national numbers paint a clear picture of a slowing market, it's important to remember that real estate is local. The Northeast was the only region to see an increase in contract signings from May, up 2.1%. Meanwhile, the Midwest, South, and West all experienced declines on both a monthly and annual basis.

Region Monthly Change Yearly Change
Northeast 2.1% 0.0%
Midwest Declined Declined
South Declined Declined
West Declined Declined

This regional variation highlights the importance of working with a local real estate agent who understands the specific dynamics of your market.

Hope on the Horizon? Don't Hold Your Breath

If you're hoping for a dramatic turnaround in the housing market soon, you might be disappointed. As Realtor.com points out, many sellers are simply choosing to wait out the market rather than lower their prices.

Realtor.com reported that delistings surged 47% in May compared with a year earlier, suggesting that sellers increasingly prefer to wait rather than negotiate.

Will the Fed Offer Relief?

Unfortunately, even if the Fed decides to cut interest rates, it might not have a huge impact on mortgage rates right away. Inflation remains a concern, and that could keep long-term bond prices high, which in turn affects mortgage rates.

What Does This Mean for Buyers and Sellers?

  • For Buyers: Be patient and realistic about what you can afford. Shop around for the best mortgage rates and consider exploring different neighborhoods or property types.
  • For Sellers: Be prepared to be flexible on price and consider making upgrades to your home to make it more appealing to buyers. Understand that the market may not move as quickly as it did in recent years.

My Take: A “Stuck” Market

I agree with Bright MLS Chief Economist Lisa Sturtevant's assessment that the market is likely to remain “stuck” for the remainder of the year. Both buyers and sellers are facing uncertainty and are hesitant to make big moves. We might not see major changes until 2026.

The recent drop in pending home sales is a sign that the housing market is still adjusting to higher interest rates and affordability challenges. While there are regional variations, the overall picture is one of a slowing market. While it pays to keep a close eye on the market, I think it's a sign that you must not take on more than you are able to handle.

My Expectations for 2025:

Given the current situation, I anticipate a somewhat moderate pace for the remainder of 2025. The initial enthusiasm we might typically see in the spring buying season appears to be tempered by the prevailing mortgage rate environment. I wouldn't be surprised to see continued regional variations, with more affordable markets potentially showing more resilience. The increased inventory could prevent significant price drops in most areas, but it also means sellers might need to be more realistic in their pricing expectations.

Potential Scenarios for 2026:

Looking further into 2026, several scenarios could play out:

  • Scenario 1: Gradual Rate Reduction: If the Federal Reserve begins to lower interest rates in response to easing inflation, we could see a gradual decrease in mortgage rates. This would likely stimulate buyer demand, leading to an increase in pending home sales.
  • Scenario 2: Sticking with Higher Rates: If inflation proves to be more persistent and interest rates remain elevated, the housing market could continue to experience a slowdown. Affordability challenges would persist, and sales volume might remain subdued.
  • Scenario 3: Economic Uncertainty: An unexpected economic downturn or a significant rise in unemployment could further dampen buyer confidence and put downward pressure on the housing market, regardless of mortgage rate movements.

The Bottom Line

The recent dip in pending home sales underscores the significant impact of mortgage rates on the housing market. As we look towards the Pending Home Sales Forecast, the trajectory will heavily depend on how these rates evolve, along with broader economic conditions and regional nuances. While the increased housing inventory offers some positives for buyers, the affordability challenge remains a key hurdle. Staying informed, understanding local market dynamics, and working with experienced real estate professionals will be essential for navigating the market successfully in the coming years.

Pending Home Sales Trends for the Last 12-Months

The table shows data from regarding pending home sales in four regions of the United States – Northeast, Midwest, South, and West. The data reveals interesting trends in pending home sales across the regions. The National Association of Realtors (NAR) publishes monthly data on pending home sales, which is seasonally adjusted and presented in the form of a seasonally adjusted annual rate (SAAR) in thousands.

Here is the tabular data of pending home sales from May 2024 to May 2025. The units displayed are in thousands and are the seasonally adjusted annual rate.

Month Northeast Midwest South West Total
May 2025 63.4 73.7 86.7 56.5 72.6
Change Month over Month 2.09 % 0.27 % 0.93 % 6.00 % 1.82 %
Change Year over Year -0.31 % 4.69 % 3.58 % -0.35 % 2.54 %
Previous
April 2025 62.1 73.5 85.9 53.3 71.3
March 2025 62.5 77.7 94.1 58.6 76.5
February 2025 62.8 73.3 86.0 55.9 72.0
January 2025 63.4 72.8 81.0 57.6 70.6
December 2024 62.3 74.3 90.6 57.7 74.2
November 2024 67.8 78.1 93.1 64.3 78.5
October 2024 68.7 77.8 89.8 64.0 77.3
September 2024 65.6 75.0 89.0 64.0 75.8
August 2024 61.6 70.0 83.4 58.3 70.6
July 2024 64.6 67.8 83.5 56.2 70.2
June 2024 65.5 73.5 89.3 58.4 74.3
May 2024 63.6 70.4 83.7 56.7 70.8

The Pending Home Sales Index Explained

The Pending Home Sales Index is a leading indicator for the housing sector, based on pending sales of existing homes. A sale is listed as pending when the contract has been signed but the transaction has not closed, though the sale usually is finalized within one or two months of signing. Pending contracts are good early indicators of upcoming sales closings. However, the amount of time between pending contracts and completed sales is not identical for all home sales.

Variations in the length of the process from pending contract to closed sale can be caused by issues such as buyer difficulties with obtaining mortgage financing, home inspection problems, or appraisal issues. According to the National Association of REALTORS®, the index is based on a sample that covers about 40% of multiple listing service data each month.

In developing the model for the index, it was demonstrated that the level of monthly sales-contract activity parallels the level of closed existing-home sales in the following two months. An index of 100 equals the average level of contract activity during 2001, which was the first year to be examined. By coincidence, the volume of existing home sales in 2001 fell within the range of 5.0 to 5.5 million, which is considered normal for the current U.S. population.

Recommended Read:

  • United States Existing Home Sales Trends
  • Will the Housing Market Crash Again?
  • Housing Market Trends: Historic Low Pending Sales
  • Household Spending Expectations Plunge to Lowest Level Since 2021
  • New Home Sales Trends and Forecast

Filed Under: Housing Market Tagged With: Housing Market

Billionaire Landlords Are Worsening the Housing Crisis in America

July 29, 2025 by Marco Santarelli

Billionaire Landlords Are Worsening the Housing Crisis in America

Are you struggling to find an affordable place to live? You're not alone. Billionaire investors are supercharging the housing crisis, making it even harder for regular people to find decent, affordable homes. This isn't just a feeling; it's backed up by serious research.

This isn't some abstract economic theory; it's affecting real people's lives, right here, right now. Millions are struggling with skyrocketing rents, and finding a home to buy feels more like winning the lottery than a simple life goal. This article will explore how billionaire investors are impacting the housing market and what we can do about it.

Billionaire Investors Are Worsening the Housing Crisis

How Billionaires Are Fueling the Housing Crisis

A recent report from the Institute for Policy Studies (IPS) and Popular Democracy shines a light on how wealthy investors are making the housing crisis worse. Their 71-page report, Billionaire Blowback on Housing, shows that billionaires aren't just passively involved; they are actively driving up prices and squeezing out everyday people. They're treating housing as a commodity, not as a human right. This is not a new issue. This has been going on for years, and it’s only getting worse.

The report highlights several key ways billionaires worsen the housing crisis:

  • Buying up massive amounts of housing: Think of Blackstone, the world’s biggest corporate landlord. They own hundreds of thousands of homes and apartments. This kind of concentrated ownership removes housing units from the regular market, decreasing supply and boosting prices.
  • Leaving units vacant: In some areas, the number of vacant homes owned by investors exceeds the number of homeless people. This isn't an accident; it's a deliberate strategy to drive up value. Imagine the impact: empty homes sitting while people sleep on the streets.
  • Raising rents: These massive corporations don't often have the same concern about providing affordable, well-maintained housing as smaller landlords. They often increase rents far beyond what is affordable. This tactic pushes even more people into financial instability.
  • Neglecting maintenance: There are reports of corporate landlords neglecting repairs and property upkeep, leaving tenants in unsafe or uncomfortable living conditions, while focusing purely on maximizing profits.
  • Targeting low-income communities: The report states that corporate landlords tend to focus their investment in lower-income neighborhoods and communities of color, which already face significant challenges. This concentrates problems and prevents diversification.

Recommended Read:

Housing Crisis Explained: Will Gen Z Ever Afford to Move Out?

The Numbers Don't Lie: The Impact of Billionaire Investment

Let's look at some of the stark realities that the report presents:

  • Record Homelessness: In 2023, over 653,000 people were experiencing homelessness in the US. This is a record high and a humanitarian crisis.
  • High Rent Burden: Half of renters spend over 30% of their income on rent. This is unsustainable for many, and just a slight rent increase can become an immediate crisis.
  • Huge Gap Between Income and Housing Costs: The difference between what people earn and what it costs to buy a home has drastically widened. Homeownership is simply out of reach for most people.
  • Millions of Vacant Homes: The report highlights the irony of 16 million vacant homes in the U.S. – enough for every single homeless person to have a home and still have millions left.

More Than Just Supply and Demand

The real estate industry often blames the housing crisis on a simple supply-and-demand issue, suggesting that building more housing will solve the problem. But the IPS/Popular Democracy report strongly argues that this is only a part of the picture. The vast number of vacant properties shows that simple supply alone doesn't define the problem. Billionaire investment is a crucial factor driving up prices and making housing unaffordable. This isn’t just about supply; it's about who controls the supply.

The Report's Main Argument: A Broken System

The authors of the report argue that the current system allows billionaires to profit from housing scarcity, creating a crisis that hurts everyone but themselves. They see the market as rigged against regular people, prioritizing wealth accumulation over community wellbeing.

What Can Be Done? Solutions for the Crisis

The report suggests several potential solutions, addressing both the national and local levels:

National-Level Solutions:

  • Expand Social Housing: This means creating more government-funded or non-profit-run housing, ensuring affordable housing options for everyone, regardless of income.
  • Tax Billionaires and Luxury Properties: The report recommends imposing taxes on the ultra-wealthy and high-value properties to fund social housing. This would shift the burden of funding affordable housing from those who need it most to those who can most afford it.
  • Regulate Predatory Real Estate Practices: Stronger regulations are needed to prevent rent gouging, evictions, and other exploitative practices.

Local-Level Solutions:

  • “Housing First” Programs: These programs prioritize providing permanent housing to the homeless, rather than focusing on addressing the causes of homelessness first. This can get people off the streets quickly.
  • Limit Corporate Ownership of Housing: Local governments could restrict the amount of housing that corporations can own, or require transparency, making it harder for them to secretly buy up large areas.
  • “First Option to Buy” Ordinances: This would give current renters the right to purchase their homes if their building or community goes up for sale.
  • Prohibiting Long-Term Vacancies: Local ordinances could fine property owners who leave units vacant for extended periods, encouraging them to rent out available properties.
  • Establish Local Social Housing Offices: Dedicated offices could focus on developing affordable housing options with input from communities and tenant groups.

Personal Thoughts and Conclusion

Having followed this issue for some time, I firmly believe that the report’s findings are accurate and deeply troubling. The concentration of wealth in the hands of a few is creating a humanitarian crisis. We need systemic changes, not just band-aid solutions.

We're not just talking about economics; we're talking about basic human rights – the right to a safe, decent, and affordable place to live. Ignoring the problem only benefits the ultra-wealthy. The time to act is now, and we all have a role to play. We need to speak up, demand change from our leaders, and support organizations working to combat this injustice.

Recommended Read:

  • Will Federal Cap on Rent Hikes Solve or Worsen Housing Affordability?
  • Will Housing Affordability Improve in 2024?
  • Biden's 5% Rent Cap Plan Will Provide Relief for Renters Amid Housing Crisis
  • Best Time to Buy a Home in 2024 is From Sept 29 to Oct 5
  • Best Time to Buy a House in the US: Timing Your Purchase
  • Should I Buy A House Now Or Wait Until Later 2024? It a Good Time?
  • Is Now a Good Time to Buy a House with Cash
  • Is It a Bad Time to Buy a House?
  • Is it a Good Time to Buy a House in California in 2024?
  • Is It a Good Time to Sell a House or Should I Wait in 2024?
  • Is Now a Good Time to Invest in Rental Property (2024)?
  • Is 2024 a Good Time to Buy an Investment Property?

Filed Under: Housing Market, Real Estate Market Tagged With: Gen Z, Homeownership, Housing Affordabilty, Housing Crisis, Housing Market, Renting

Blackstone’s Housing Empire: A Giant in the US Rental Market?

July 29, 2025 by Marco Santarelli

Blackstone's Housing Empire: A Giant in the US Rental Market?

Are you surprised to learn that Blackstone's dominance in the US single-family rental market is shaping how millions of Americans find housing? This isn't just about a big company; it's about the impact on your neighborhood, your community, and potentially, your ability to find affordable housing. Let's dive into the details of Blackstone's massive footprint and explore the implications for the future of the American rental market.

Blackstone's Dominance in the US Single-Family Rental Market: A Deep Dive

Blackstone: A Colossus in the Housing World

The Institute for Policy Studies (IPS) along with Popular Democracy published a report, Billionaire Blowback on Housing, which details how Wall Street's influence is affecting housing affordability. The report highlights how corporate landlords like Blackstone are concentrating their investments in lower-income communities of color, sometimes leading to concerns about practices like rent gouging and evictions.

Blackstone, the world's largest private equity firm, isn't just investing in stocks and bonds. They've become a major player in the US single-family rental market, owning an estimated over 63,000 single-family homes. That's a lot of houses! This massive portfolio, acquired through companies like Tricon Residential and Home Partners of America (HPA), positions Blackstone as a significant force shaping rental trends across the nation. But how did they get here, and what does it all mean?

The Rise of Blackstone in Single-Family Rentals: A Timeline

Blackstone's expansion into the single-family rental market wasn't an overnight phenomenon. They strategically built their portfolio through acquisitions and shrewd investments. A key moment was the purchase of Home Partners of America and Tricon Residential during the COVID-19 pandemic. These acquisitions added hundreds of thousands of residential units to their already impressive holdings, solidifying their position as the largest corporate landlord globally.

This growth is part of a larger trend. Wall Street, as a whole, is increasingly investing in residential real estate, fueled by low interest rates and the desire for steady rental income. But Blackstone's scale sets them apart. They are not just a player; they're a heavyweight champion in a game impacting millions.

As of June 30th, 2024, Blackstone boasted over $1 trillion in assets under management, highlighting their enormous financial power and influence within the market. This isn’t just theoretical; this translates to tangible control over a substantial portion of the nation's housing stock.

Blackstone's Portfolio: Beyond Single-Family Homes

While their single-family rental holdings are staggering, Blackstone’s real estate empire extends far beyond just houses. They own:

  • Multifamily apartment units: An estimated 149,000 units are under their control, further expanding their reach in the rental market.
  • Mobile home parks: Through Treehouse Communities, Blackstone owns 70 parks with 13,000 lots, representing another segment of the affordable housing market.
  • Student housing: American Campus Communities, a Blackstone subsidiary, owned 144,300 beds in 205 properties in 2022.
  • Affordable Housing: Blackstone also claims to have a significant presence in affordable housing, citing over 95,000 units, mainly leveraging the Low-Income Housing Tax Credit. However, critics question the sincerity of their commitment to affordable housing, citing their actions against rent control measures.

Table 1: Breakdown of Blackstone's Real Estate Holdings (Approximate Figures)

Property Type Number of Units/Lots/Beds
Single-Family Homes >63,000
Multifamily Apartments 149,000
Mobile Home Park Lots 13,000
Student Housing Beds 144,300
Total Residential Units >369,300

(Note: These figures are based on publicly available data and may not be entirely precise.)

The Impacts of Blackstone's Dominance

Blackstone's massive holdings have sparked considerable debate and concern. While they argue that they provide needed housing and generate jobs, critics point to several potential downsides:

  • Increased rents: The sheer scale of Blackstone's ownership might influence market pricing, potentially pushing rents upward, especially in already-expensive areas. This is something I've personally seen impacting communities, pushing out families who simply can no longer afford the rising costs.
  • Evictions: Reports from organizations like the Institute for Policy Studies have raised concerns about higher eviction rates within properties owned by Blackstone subsidiaries like HPA. They highlight a pattern of aggressive eviction practices, particularly in lower-income communities of color.
  • Lack of affordable housing: While Blackstone invests in some affordable housing projects, critics argue that their overall impact on the market contributes to a shortage of affordable options. The company's opposition to rent control initiatives further fuels these concerns.
  • Reduced local control: A large corporate landlord like Blackstone might have less concern for the specific needs of a particular community, compared to smaller, local landlords. This can lead to a sense of disconnect between residents and property management.

Blackstone's Response and Counterarguments

Blackstone defends its practices by pointing to their investments in various types of housing, including affordable units. They also highlight the jobs they create and the capital they inject into the housing market. Furthermore, they argue that they’re providing needed housing and improving properties through renovations.

However, these counterarguments don't fully address the concerns about rising rents, evictions, and the lack of truly affordable housing options. The scale of their holdings, combined with documented incidents of aggressive business practices, raises legitimate questions about the long-term effects on communities across the nation.

The Future of Blackstone and the Single-Family Rental Market

The future of Blackstone’s role in the single-family rental market is uncertain, but several factors will likely play a key role:

  • Interest rate fluctuations: Changes in interest rates will undoubtedly affect Blackstone’s investment strategies and could impact their expansion or contraction in the rental market.
  • Regulatory changes: Government regulations and policies on housing, rent control, and tenant rights will influence how Blackstone operates and invests in the future.
  • Public pressure: Public outcry and ongoing scrutiny of large corporate landlords will continue to shape the narrative around Blackstone’s practices.
  • Economic conditions: Broad economic shifts, such as recessions or booms, will have major implications on both the rental market and Blackstone’s ability to maintain and expand its portfolio.

Partner with Norada, Your Trusted Source for Turnkey Investment Properties

Discover high-quality, ready-to-rent properties designed to deliver consistent returns. Contact us today to expand your real estate portfolio with confidence.

Reach out to our investment counselors:

(949) 218-6668 | (800) 611-3060

Contact Us Today


Conclusion: A Complex Issue with No Easy Answers

Blackstone's dominance in the US single-family rental market is a complex issue with significant implications for millions of Americans. While they provide a necessary function in the housing sector, their influence raises concerns about affordability, evictions, and community impact.

The ongoing debate highlights the need for a deeper understanding of the interplay between private equity, affordable housing, and the well-being of our communities. The conversation needs to continue, with greater transparency and accountability from major players like Blackstone, and stronger protection for tenants’ rights.

Recommended Read:

  • Billionaire Landlords Are Worsening the Housing Crisis in America
  • Will Federal Cap on Rent Hikes Solve or Worsen Housing Affordability?
  • Will Housing Affordability Improve in 2024?
  • Biden's 5% Rent Cap Plan Will Provide Relief for Renters Amid Housing Crisis
  • Best Time to Buy a Home in 2024 is From Sept 29 to Oct 5
  • Best Time to Buy a House in the US: Timing Your Purchase
  • Should I Buy A House Now Or Wait Until Later 2024? It a Good Time?
  • Is Now a Good Time to Buy a House with Cash
  • Is It a Bad Time to Buy a House?
  • Is it a Good Time to Buy a House in California in 2024?
  • Is It a Good Time to Sell a House or Should I Wait in 2024?
  • Is Now a Good Time to Invest in Rental Property (2024)?
  • Is 2024 a Good Time to Buy an Investment Property?

Filed Under: Housing Market, Real Estate Market Tagged With: Gen Z, Homeownership, Housing Affordabilty, Housing Crisis, Housing Market, Renting

San Diego Housing Market Predictions for the Next 2 Years

July 28, 2025 by Marco Santarelli

San Diego Housing Market Forecast for the Next 2 Years: 2025-2026

Thinking about buying or selling a home in sunny San Diego? Understanding where the market is headed is crucial, right? So, here’s the lowdown: The San Diego housing market forecast for the next 2 years suggests a slight cooling. While a crash isn’t expected, modest price decreases are anticipated throughout 2025 and into 2026, although gains can occur from 2025 before a fall. This is according to the latest data and forecasts from real estate experts. Let’s dive into the numbers and see what they really mean for you.

San Diego Housing Market Forecast for the Next 2 Years – What's Ahead?

Key Takeaways

🏠💰
Current Home Value: The average home value in San Diego-Carlsbad is $941,517, reflecting a 1.6% drop over the past year.

📅⚡
Market Activity: Homes are averaging 19 days on the market before going pending, showing steady market conditions as of June 2025.

📊🏆
Sales Trends: Approximately 40.9% of homes sold in May 2025 were above their list price, while 45.1% were below, showcasing a balanced market with opportunities for both buyers and sellers.

🔮📈
Future Projections: Market forecasts predict a 1.5% decrease in home values by June 2026, driven by high mortgage rates, which have slowed down San Diego's housing market.

Why is the San Diego-Carlsbad Housing Market So Important?

First, let's acknowledge why the San Diego-Carlsbad housing market is so significant within California. San Diego isn't just another city; it's a major economic hub with a diverse population, beautiful weather, and a strong job market, particularly in tech and the military. This makes it a highly desirable place to live, which of course fuels demand for housing.

As a lifelong Californian, I've seen firsthand how the San Diego market can influence the real estate trends across the state. What happens here often sets a tone for other areas. This city’s attractiveness and economic stability mean that even small shifts in the market can have a ripple effect across the region.

What’s Driving the Growth of the San Diego Housing Market?

The San Diego housing market has several key drivers that facilitate its robust performance:

  1. Thriving Economy: San Diego's diverse economy, rooted in technology, defense, tourism, and healthcare, continues to draw new residents. The area boasts a low unemployment rate, which feeds directly into the demand for housing.
  2. Job Growth and Stability: Continuous job creation in sectors like biotechnology and telecommunications contributes to a strong labor market, where employees often seek permanent housing solutions close to employment hubs.
  3. Desirable Lifestyle: San Diego is renowned not just for its beautiful beaches but also for its natural parks, cultural attractions, and excellent schools. These factors enhance its appeal as a prime location, attracting families and professionals alike.
  4. Low Housing Inventory: The fundamental supply-demand imbalance persists, with many would-be sellers hesitant to list their homes due to current market volatility. This limited inventory in San Diego further exacerbates competition among buyers, pushing home prices upward.
  5. Population: Population growth and shifts in demographics can also impact the housing market. The San Diego area has been a desirable location for many years due to its weather, lifestyle, and job opportunities. A large population and new residents moving into the area can create a higher demand for homes, leading to an increase in housing prices.

Current State of the San Diego Housing Market

Before we jump into the future, let's take a quick snapshot of where we are right now. As of today, the average home value in San Diego-Carlsbad is approximately $941,517. That's a hefty price tag, no doubt! But here's something interesting: that figure is down about 1.6% over the past year. Also, homes are going to pending in about 19 days

What does this tell us? Well, it suggests that the market isn't as red-hot as it was a year or two ago. Buyers might have a little more breathing room!

The Forecast: A Closer Look

Now, let's get to the nitty-gritty. Zillow, a major player in the real estate data game, has released its forecasts for the San Diego area, and I've summarized the key points below. Keep in mind that forecasts are just educated guesses based on current trends, and the market can always surprise us.

Here's what Zillow is projecting for the San Diego housing market:

Timeframe Predicted Home Value Change
July 31, 2025 -0.7%
September 30, 2025 -2.1%
June 30, 2026 -1.5%

As you can see, Zillow anticipates a gradual decline in home values over the next year (until June 2026) The biggest drop is expected around September 2025. This doesn't mean the sky is falling, but it's something to be aware of.

How Does San Diego Stack Up Against Other California Cities?

It's always helpful to put things in context. So, let's see how San Diego's projected housing market compares to some other major metropolitan areas in California:

City Forecast Change by July 2025 Forecast Change by September 2025 Forecast Change by June 2026
San Diego, CA -0.7% -2.1% -1.5%
Los Angeles, CA -0.4% -0.9% -1.3%
San Francisco, CA -1.0% -3.2% -6.1%
Riverside, CA -0.5% -1.3% -0.9%
Sacramento, CA -0.7% -2.1% -3.7%
San Jose, CA -1.0% -2.6% -4.0%
Fresno, CA -0.3% -1.0% -1.2%
Bakersfield, CA -0.3% -0.8% -0.1%

A few things stand out here. San Francisco seems to be facing the steepest projected decline, while Bakersfield is holding up relatively well. San Diego falls somewhere in the middle, suggesting a more moderate correction.

National Trends and Expert Opinions

It's not just about San Diego; the national housing market plays a role too! Lawrence Yun, the Chief Economist for the National Association of Realtors (NAR), has some interesting insights. He believes “brighter days may be on the horizon” for the U.S. housing market.

Here are some key predictions from Yun:

  • Existing Home Sales: Expected to increase by 6% in 2025 and a further 11% in 2026.
  • New Home Sales: Projected to rise by 10% in 2025 and another 5% in 2026.
  • Median Home Prices: Forecasted to rise modestly, by 3% in 2025 and 4% in 2026.
  • Mortgage Rates: Anticipated to average 6.4% in the second half of 2025 and drop to 6.1% in 2026.

Yun emphasizes the impact of mortgage rates, calling them a “magic bullet” because they influence buyer affordability and demand. If mortgage rates do indeed come down, it could give the housing market a significant boost.

Although there are differences in opinion, the general agreement is that the housing market will not crash and that appreciation can still be expected.

Will Home Prices Drop in San Diego? Will it Crash?

Okay, let's address the elephant in the room: will San Diego home prices crash? Based on the data and expert opinions, a crash seems unlikely. A more realistic scenario is a period of price correction or stagnation. Zillow's forecast suggests a gradual decrease, but that doesn't mean prices will plummet overnight.

The factors that could influence this include:

  • Interest Rates: If mortgage rates stay high or rise further, it could dampen buyer demand and put downward pressure on prices.
  • Inventory: An increase in the number of homes for sale could give buyers more options and lead to more negotiation power.
  • Economic Conditions: A strong economy generally supports housing prices, while a recession could have the opposite effect.

My Thoughts and a Possible Forecast for 2026

Here's my take, based on my experience and insights into the San Diego market. While I see the potential for continued price declines throughout much of 2025, I also believe that the market will start to stabilize towards the end of 2025 and into 2026.

For 2026, I wouldn’t be surprised to see a slight rebound in home prices in San Diego. The NAR is optimistic that we are heading towards greener pastures by 2026. We could see, at the very least, a flattening out of the prices. The expected drop in mortgage rates could definitely help, as would increased home sales.

San Diego remains a desirable place to live, with a strong job market, beautiful weather, and plenty of attractions. These factors should help support housing values in the long run. The limited inventory is also going to continue playing a role. As long as there are not enough homes for the current number of buyers, home values will not crash.

So, my unofficial forecast for 2026 is a period of either stagnation or moderate growth in San Diego home prices.

What Does This Mean for Buyers and Sellers?

If you're a buyer, this could be good news. You might have more time to shop around, negotiate a better deal, and potentially find a home at a slightly lower price than you would have a year or two ago; however, do not wait too long as there is a good chance that home values will rebound.

If you're a seller, it's important to be realistic about your expectations. Don't overprice your home, be prepared to negotiate, and focus on highlighting the unique features and benefits of your property. Keep in mind the market is shifting, and it's no longer a guaranteed seller's market.

No matter which party you are, having up-to-date, relevant information about the San Diego housing market is critical. Be sure to speak with a local real estate professional.

Conclusion

The San Diego housing market forecast for the next 2 years points to a period of adjustment rather than a dramatic crash. Prices are expected to experience declines during the course of 2025, before rebounding in 2026. Factors like interest rates, inventory levels, and the overall economy will play a crucial role in shaping the market's trajectory.

Disclaimer: Housing market forecasts are never a guarantee. They are based on current data and trends, which can shift over time. Always do your own research and consult with qualified professionals before making any real estate decisions.

Recommended Read:

  • San Diego Housing Market: Prices, Trends, Forecast
  • Is San Diego’s Housing Getting Very Expensive: Experts Predict
  • San Diego Housing Market Booms With 9.4% Growth: Expert Predictions
  • San Diego Housing Market Predictions: Soaring and Expensive!
  • San Diego Housing Market Predictions: Prices Skyrocket 11.4%; What's Next?
  • Is San Diego Real Estate a Good Investment?

Filed Under: Growth Markets, Housing Market Tagged With: Housing Market, Housing Market Forecast, housing market predictions, san diego

Worst Florida Housing Markets Facing Steepest Price Declines in 2025

July 26, 2025 by Marco Santarelli

Worst Florida Housing Markets Facing Steepest Price Declines in 2025

Thinking about buying or selling a home in Florida? It's crucial to stay informed about the latest market trends. In May 2025, certain areas experienced noticeable dips in median sale prices. This article dives into the Florida housing markets facing the steepest drops in home prices, based on the latest data from Florida Realtors.

Based on year-over-year percentage change in median sale price as of May 2025, those markets were the Naples-Immokalee-Marco Island MSA, Punta Gorda MSA, The Villages MSA, Sebastian-Vero Beach MSA, North Port-Sarasota-Bradenton MSA, Cape Coral-Fort Myers MSA and Tallahassee MSA.

Let's face it, the real estate market is a constantly shifting tide. One day, your home's value might be up, the next, not so much. What was once a seller's dream can quickly become a buyer's paradise, and vice versa. Right now, Florida is somewhere in the middle, trying to find its balance.

According to Florida Realtors President Tim Weisheyer, “Florida’s housing market is finding its balance, and that’s good for buyers and sellers alike.”

However, some areas are feeling the pinch of price drops more than others. This doesn't necessarily mean these are bad places to live, but it's something to consider if you're looking to buy or sell in these regions. As an expert in the field, I will walk you through these markets and explain what these trends could mean for you.

The Big Picture: Florida's Housing Market in May 2025

Before we zoom in on the specific areas, let's take a look at the overall state of Florida's housing market in May 2025:

  • Closed Sales: Down 5.7% for single-family homes and 19.9% for condo-townhouses, year-over-year.
  • Median Sales Price: Single-family homes were at $415,000, a decrease of 2.7% from the previous year. Condo-townhouses showed at $310,000, a sharper decrease of 6.1%.
  • Inventory: Active listings increased significantly, up 28.8% for both property types.

As you can see, inventory went up from last year, closed sales were down and prices saw a small decline. This suggests a shift towards a more balanced market, where buyers have more choices and sellers might need to be more competitive. We are seeing a move away from the intense demand seen in the post-pandemic years. The good news? Prices are still considerably higher than they were in 2020.

Worst Florida Housing Markets Facing Steepest Price Declines in 2025

Now, let's explore the specific metropolitan areas experiencing the most significant price reductions. Below's a table summarizing these market's data.

Metropolitan Area Y/Y % Change in Median Sale Price (May 2025) Median Sale Price (May 2025) Y/Y % Change in Closed Sales (May 2025)
Naples-Immokalee-Marco Island MSA -19.2% $767,800 -15.3%
Punta Gorda MSA -14.5% $325,000 1.7%
The Villages MSA -11.3% $347,000 23.8%
Sebastian-Vero Beach MSA -10.2% $386,190 -6.8%
North Port-Sarasota-Bradenton MSA -9.9% $475,000 -4.7%
Cape Coral-Fort Myers MSA -9.6% $375,000 -1.6%
Tallahassee MSA -5.2% $340,000 -8.8%

Let's go through each one:

1. Naples-Immokalee-Marco Island MSA (Collier County)

  • Price Drop: A significant 19.2% decrease in median sale price.
  • Median Sales Price: $767,800 in May 2025.
  • Closed Sales: Down 15.3% year-over-year.

Naples, often associated with luxury real estate, is experiencing a considerable correction. This could be due to factors like overvaluation during the peak of the pandemic or a shift in buyer preferences. What does this mean? High-end buyers might find some deals here, while sellers may need to adjust their expectations.

Looking at this market, I think it's likely that the luxury segment, which saw unprecedented growth in recent years, is now normalizing. The drop in closed sales supports the idea that buyers are being more selective.

2. Punta Gorda MSA (Charlotte County)

  • Price Drop: A substantial 14.5% decrease in median sale price.
  • Median Sales Price: $325,000 in May 2025.
  • Closed Sales: Up 1.7% year-over-year.

Punta Gorda presents a mixed picture. While prices fell significantly, closed sales actually increased slightly. This could indicate that lower prices are attracting buyers, yet there is still some demand. As a homeowner, you may need to get ahead of other houses. By offering incentives to buyers can get their interst in your offer.

The disconnect between price declines and sales increases intrigues me. It suggests a market where affordability is becoming a key driver. Buyers who were previously priced out might now find opportunities in Punta Gorda.

3. The Villages MSA (Sumter County)

  • Price Drop: A notable 11.3% decrease in median sale price.
  • Median Sales Price: $347,000 in May 2025.
  • Closed Sales: Up a substantial 23.8% year-over-year.

The Villages, known as a popular retirement community, shows a similar pattern to Punta Gorda. Despite a significant price drop, closed sales are up dramatically. The increased sales activity might be due to increased marketing efforts to attract new seniors to the area from outside of Florida as well as lower costs enabling more purchases.

I believe The Villages' unique demographic could be influencing this trend. It's possible that retirees are still drawn to the area, and the price adjustments are making homes more accessible.

4. Sebastian-Vero Beach MSA (Indian River County)

  • Price Drop: A considerable 10.2% decrease in median sale price.
  • Median Sales Price: $386,190 in May 2025.
  • Closed Sales: Down 6.8% year-over-year.

Sebastian-Vero Beach is seeing a drop in both prices and closed sales. This could suggest a slowdown in demand and increased inventory affecting prices.

With both prices and sales declining, this market seems to be facing some headwinds. It may be that buyers are holding back, anticipating further price reductions.

5. North Port-Sarasota-Bradenton MSA (Manatee and Sarasota Counties)

  • Price Drop: A significant 9.9% decrease in median sale price.
  • Median Sales Price: $475,000 in May 2025.
  • Closed Sales: Down 4.7% year-over-year.

This region, with its beautiful beaches and growing population, is also experiencing price corrections and falling closed sales with no change in those trends.

I believe the higher median price point in this area might be a factor. It may be becoming less affordable for some buyers, leading to decreased demand and price adjustments.

6. Cape Coral-Fort Myers MSA (Lee County)

  • Price Drop: A noticeable 9.6% decrease in median sale price.
  • Median Sales Price: $375,000 in May 2025.
  • Closed Sales: Down 1.6% year-over-year.

Cape Coral and Fort Myers, still recovering from Hurricane Ian, may be seeing price adjustments due to the ongoing rebuilding efforts and insurance challenges.

The hurricane's impact likely plays a significant role in this market. The recovery process can be slow and complex, potentially affecting property values in the short term.

7. Tallahassee MSA (Gadsden, Jefferson, Leon, and Wakulla counties)

  • Price Drop: A more moderate 5.2% decrease in median sale price.
  • Median Sales Price: $340,000 in May 2025.
  • Closed Sales: Down 8.8% year-over-year.

Tallahassee, the state capital, is experiencing a gentler price decline compared to the coastal regions. This could be due to its more stable economy and less reliance on tourism-driven real estate.

Tallahassee's relative stability might be due to its employment base, which includes government, education, and healthcare sectors. These sectors tend to be less volatile than those heavily dependent on tourism or seasonal residents.

Key Takeaways and My Opinion

So, what does all this mean for you, the potential buyer or seller?

  • For Buyers: This could be the window if your buying. These areas are looking more affordable and you may find better deals. However, do your due diligence! Research market conditions and look forward instead of looking to the past.
  • For Sellers: Be realistic about pricing. The days of easy profits might be over, which could be why closed sales are down so much over the past year. Work with a real estate agent to give the consumer good reasons to buy your real estate. Make sure yours is better than the competition.

As an investor in the real estate field, I always caution against making broad generalizations. Real estate is hyperlocal. Just because one neighborhood is down doesn't mean another neighborhood next to it is in the same condition.

Looking at the overall market, I believe Florida is transitioning from a period of hyper-growth to a more sustainable pace. The increased inventory is a good sign, giving buyers more choices. It's a far cry from the frenzy that we saw a couple of years ago.

Keep in mind that these trends are based on a snapshot in time. The market can change quickly. Stay informed, work with qualified professionals, and make decisions that align with your personal financial goals.

“Invest in Real Estate in the “Hottest Florida Markets”

Discover high-quality, ready-to-rent properties designed to deliver consistent returns.

Contact Norada today to expand your real estate portfolio with confidence.

Contact our investment counselors (No Obligation):

(800) 611-3060

Get Started Now 

Read More:

  • Cape Coral Housing Market Crash: Boom, Bust, and Echoes in 2025
  • Why is Cape Coral Housing Market in Florida Doomed to Crash in 2025?
  • 5 Popular Florida Housing Markets Are at High Risk of Price Crash
  • 2 Florida Housing Markets Flagged for a Major Price Decline Risk
  • 24 Florida Housing Markets Could See Home Prices Drop by Early 2026
  • Is the Florida Housing Market Headed for Another Crash Like 2008?
  • Key Trends Shaping the Florida Housing Market in 2025
  • This Florida Housing Market Bucks National Trend With Declining Prices
  • Florida Housing Market Crash 2.0? Analyst Warns of 2008 Echoes
  • Tax Relief Proposed as Florida Housing Market Faces Deepening Crisis

Filed Under: Housing Market, Real Estate Market Tagged With: Florida, Housing Market, housing market crash, Housing Market Trends

Illinois Housing Market: Trends and Forecast 2025-2026

July 26, 2025 by Marco Santarelli

Illinois Housing Market

Are you thinking about buying or selling a home in Illinois? If so, it's crucial to understand the current Illinois housing market trends. Here's the scoop: The Illinois housing market is currently showing signs of stabilization with median prices rising. While sales are slightly down compared to last year, inventory is increasing, presenting both opportunities and challenges for buyers and sellers. Let’s dive deeper into what’s happening and what it means for you.

Illinois Housing Market Trends in 2025:

Home Sales

How are home sales doing in Illinois?

As reported by Illinois REALTORS®, in May 2025, closed sales in Illinois totaled 12,674, a 4.7% decrease compared to May 2024 when there were 13,300 closed sales.

Metric May 2024 May 2025 Percent Change
Closed Sales 13,300 12,674 -4.7%
Previous Month's Closed Sales 11,711 11,467 -2.1%

It's important to note that while sales have dipped slightly year-over-year, they are a key indicator of market activity. Remember that real estate market activity can vary across different locations in Illinois, so consider getting in touch with a local Realtor to get more information.

Comparison with National Home Sales in the U.S. in June 2025

Nationally, existing-home sales are also showing some fluctuation.

  • There was a 2.7% decrease in total existing-home sales month-over-month, reaching a seasonally adjusted annual rate of 3.93 million.
  • However, there's no change in sales year-over-year, according to the National Association of REALTORS® (NAR).

The Illinois market's dip in closed sales is relatively in line with some of the national trends, suggesting that broader economic factors are at play.

Home Prices

Are Home Prices Dropping?

No, home prices in Illinois are not dropping. In fact, they're going up! The median sales price in Illinois for May 2025 was $315,000, which is a 5.0% increase compared to $300,000 in May 2024.

Comparison with Current National Median Price in the U.S.

The national median home price tells another story. As of June 2025, the national median price is $435,300, reflecting a 2% year-over-year increase. This is also a record high for the month of June. So while Illinois prices are rising, they are still below the national median, making Illinois relatively affordable compared to some other states.

From my experience, I see that there is a lot of competition and bidding wars among home buyers, especially for properties that are priced right and in great locations.

Housing Supply

Is It a Buyer's or Seller's Housing Market?

The inventory of homes for sale in Illinois is increasing. In May 2025, there were 19,890 homes on the market, a 6.0% increase from the 18,758 homes available in May 2024. While an increase in inventory is a good sign for buyers, we still need to see how this trend plays out over the next few months.

Days on Market: Homes are staying on the market slightly longer. In May 2025, the average days on market until sale was 27 days, compared to 26 days in May 2024, a 3.8% increase. This could indicate that buyers have slightly more negotiating power.

Whether it's a buyer's or seller's market can depend on different conditions, so it's best to check with your local Realtor.

Market Trends

Impact of High Mortgage Rates

One of the biggest factors influencing the housing market is mortgage rates. As of July 17, 2025, the average 30-year fixed mortgage rate is around 6.75%, and the 15-year fixed-rate mortgage is about 5.92%, according to Freddie Mac's Primary Mortgage Market Survey®.

  • 30-Year Fixed Rate: Around 6.75%
  • 15-Year Fixed Rate: About 5.92%

These rates have a direct impact on affordability and buyer demand. High rates can deter potential buyers, leading to a cooling effect on the market. According to various forecasts, the 30-year FRM rate will likely end 2025 between 6.0% and 6.5%. The stability in mortgage rates may encourage some prospective buyers to enter the market.

Additional Factors Influencing the Illinois Housing Market

  • Economic Conditions: Illinois's overall economy, including job growth and unemployment rates, plays a significant role in housing market stability. Strong job markets tend to support housing demand.
  • Demographic Shifts: Changes in population, household formation, and migration patterns can influence housing needs and demand in different areas of Illinois.
  • Government Policies: Tax incentives, zoning regulations, and housing programs can either stimulate or hinder market activity.
  • Seasonal Variations: Real estate markets typically experience seasonal fluctuations, with spring and summer being the busiest times for buying and selling.

While it's impossible to predict the future with certainty, current forecasts suggest a gradual stabilization of the Illinois housing market. The expected moderation in mortgage rates by the end of 2025 could provide a boost to buyer confidence and activity.

My Thoughts

In my opinion, the Illinois housing market is currently in a state of transition. We're seeing a shift from the hyper-competitive seller's market of the past few years to a more balanced market. For buyers, this means more opportunities to find the right home and negotiate terms. For sellers, it means pricing your home strategically and preparing for a potentially longer selling process.

Summary: The current Illinois housing market trends present a mixed bag of opportunities and challenges. While sales are slightly down, prices are rising, and inventory is increasing.

Illinois Housing Market Forecast: What to Expect in 2025 & Beyond

I've been diving into the latest numbers, and the Illinois Housing Market Forecast paints a picture of mixed signals – while the state saw a slight overall increase in home values recently, future trends seem to vary quite a bit depending on where you are. According to Zillow, the average home value in Illinois is currently around $285,813, which is up 3.5% compared to last year. This gives us a starting point, but the real story is in the details.

Many people are asking if prices will keep going up, level off, or maybe even drop.  Let's break down what the experts are saying and what the data suggests for the rest of this year and into 2026.

First off, let's look at the current situation. As mentioned, the average home value across Illinois recently hit approximately $285,813. That’s a decent jump of 3.5% over the last year. This suggests that while the market has seen some activity and value growth, it hasn't been experiencing the wild swings you might have heard about elsewhere. It feels more stable, which is often a good sign.

Latest Forecast: A Look at Illinois Regions

Now, let's get into the future projections. Zillow has provided some interesting forecasts for different areas (known as MSAs or Metropolitan Statistical Areas) within Illinois. These predictions look at the likely percentage change in home values for a few key dates. It's important to remember these are predictions, and the real market can always surprise us, but they give us a valuable guide.

Here’s how things are playing out:

Metro Area June '25 Projection (%) Aug '25 Projection (%) May '26 Projection (%)
Rockford 0.2 0.3 2.1
Freeport 0.3 0 1.6
Pontiac 0.4 0.4 0.2
Bloomington 0.3 0 -0.1
Decatur 0.5 0.5 -0.1
Peoria 0.2 -0.1 -0.5
Rochelle 0.5 0.1 -0.6
Taylorville 0.9 0.4 -0.8
Chicago 0 -0.5 -1.1
Champaign 0 -0.4 -1.1
Kankakee -0.3 -1 -1.2
Dixon 0 -0.8 -1.4
Effingham 0.4 -0.2 -1.5
Springfield 0.2 -0.1 -2.1
Sterling -0.3 -1.4 -2.4
Charleston 0.4 -0.5 -2.5
Carbondale 0.1 -1.1 -2.6
Centralia -0.4 -1.2 -2.6
Danville -0.8 -1.6 -2.8
Davenport (IA)* -0.2 -1.2 -3.6
Quincy -0.1 -1.1 -4.2
Lincoln 0 -1.4 -4.5
Galesburg 0.2 -0.9 -4.6
Macomb -0.5 -1.9 -5.3
Jacksonville -0.3 -1.9 -5.5
Mount Vernon -0.6 -2.8 -5.9

What strikes me immediately is the general trend towards declining home values in many Illinois regions by the end of the forecast period (May 2026). While some areas like Rockford might see slight growth, many others, including major hubs like Chicago and Champaign, are projected to experience small decreases.

Even more concerning are the larger projected drops in cities like Springfield, Galesburg, Jacksonville, and Mount Vernon. This suggests that while the state average might seem okay, many local Illinois housing markets could face real challenges.

Nationwide Housing Market: What's Happening?

Now, how does this compare to the rest of the country? Lawrence Yun, the Chief Economist at the National Association of Realtors (NAR), offers a more upbeat national outlook. He thinks “brighter days may be on the horizon.” Here are his key predictions for the U.S. housing market:

  • Existing Home Sales: Expected to increase by 6% in 2025 and jump another 11% in 2026. This points to more people buying and selling homes.
  • New Home Sales: Predicted to rise by 10% in 2025 and an additional 5% in 2026. This is great news for boosting housing supply.
  • Median Home Prices: Forecasted to grow steadily, rising by 3% in 2025 and 4% in 2026. This suggests more sustainable price increases.
  • Mortgage Rates: Expected to cool down, averaging 6.4% in the latter half of 2025 and dropping further to 6.1% in 2026. Lower rates often make buying more affordable and can boost demand.

Overall, the national forecast is generally positive, pointing towards recovery and modest growth, largely thanks to expected lower mortgage rates.

Will Home Prices Drop in Illinois? Will it Crash?

So, back to the big question: Will Illinois home prices drop significantly, or will the market crash?

Based on the data I've seen, a widespread statewide crash seems unlikely, especially if the national trends predicted by NAR hold true. The modest growth expected nationally, combined with falling mortgage rates, should provide some support.

However, the specific regional forecasts for Illinois from Zillow are definitely a cause for caution. Many areas, particularly outside the major metro centers or even within Chicago itself, are projected to see prices fall between now and mid-2026. This isn't a crash, but it does suggest that sellers in certain parts of Illinois might need to be more realistic about pricing, and buyers could find more negotiating power in those specific markets. It seems like the Illinois housing market might not follow the national trend perfectly, with some local areas potentially experiencing downturns.

A Look Ahead: Potential Forecast for 2026

Looking towards 2026, the national picture suggests a market finding its footing. But for Illinois, the story looks more complex. While national factors like lower rates could help, the above projections indicate that many local Illinois markets might continue to face downward pressure on prices into early 2026.

It really comes down to local conditions – things like job growth, local inventory levels, and population changes matter hugely. What happens in Chicago might be very different from what happens in Springfield or Peoria.

My advice? If you're navigating the Illinois housing market, pay close attention to trends in your specific town or neighborhood. Talking to a local real estate agent who really knows your area is more important than ever right now. They can give you the most tailored advice based on the latest local data.

In conclusion, the Illinois Housing Market Forecast suggests a period of adjustment. While national optimism exists, Illinois faces regional challenges. Stay informed, be prepared, and focus on your specific local market!

Regional strategies may need to focus on attracting investment and incentivizing homeownership to stimulate more balanced developments in less accessible markets.

Illinois Housing Market Snapshot

Key Highlights

Average Home Value: $285,813 (increase of 3.5%)

Sales Trend: Sales down by 6.5% year-over-year

Top Regions on the Rise

Region Forecasted Growth by May 2026
Rockford 2.1%
Freeport 1.6%

Top Regions Facing Challenges

Region Forecasted Decline by May 2026
Mount Vernon -5.9%
Jacksonville -5.5%

Overall Market Sentiment

Sales Trends: Expected continued volatility with varying performance across regions.

Market Outlook: Mixed, but with opportunities for growth in select markets. 

Seize the Midwestern Momentum—Illinois Housing Market

The Illinois housing market is shifting: affordability is improving, mid‑sized metro areas are gaining traction, and investors are starting to notice strong rental demand across key regions.

Norada helps you take advantage of this evolving opportunity—with turnkey investment properties in Illinois markets poised for growth and positive cash flow.

HOT NEW LISTINGS JUST ADDED!

Talk to a Norada investment counselor today (No Obligation):

(800) 611-3060

Get Started Now

Recommended Read:

  • Top 10 Buyer-Friendly Housing Markets Where You Can Snag a Deal
  • Chicago Housing Market: Prices, Trends, Forecast
  • Naperville Housing Market: Prices, Trends, Forecast
  • Housing Market Trends 2025: Sales, Prices, and Supply Analysis
  • 20 Worst Housing Markets Facing Biggest Price Crash or Correction by 2026

Filed Under: Growth Markets, Housing Market Tagged With: Chicago, Housing Market, Illinois

4 Florida Housing Markets Facing Worse Potential Crash Than Cape Coral

July 25, 2025 by Marco Santarelli

4 Florida Housing Markets Currently Worse Than Cape Coral

The Florida sun might be shining, but beneath that warm glow, the housing market tells a complex story. If you've been watching the news, you might have heard whispers of a slowdown, a “balancing act,” or even some price drops. As someone deeply invested in understanding these market shifts, I've spent a lot of time poring over the latest data, looking for the real pulse of Florida's communities.

And when we talk about the housing markets in Florida, which are currently much worse than Cape Coral, let me tell you, it's not as simple as it seems, but yes, for single-family homes in May 2025, some specific metropolitan areas are indeed showing more significant signs of market cooling or price depreciation than Cape Coral.

What do I mean by “worse”? I'm looking at where median home prices are falling faster, or closed sales are declining more sharply, signaling a softer market for sellers and perhaps more opportunities for buyers. It's about spotting the areas where the market correction is hitting harder.

Florida Housing Markets Facing Worse Potential Crash Than Cape Coral

The Big Picture: Florida's Real Estate in Flow

Florida's real estate market is always buzzing, a hot spot for relocation, investment, and retirement. But even the Sunshine State isn't immune to national trends like higher interest rates and a general cooldown after years of dizzying growth. Tim Weisheyer, the 2025 Florida Realtors President, hit it right on the head when he said, “Florida's housing market is finding its balance, and that's good for buyers and sellers alike.” This isn't a crash, but a shift.

From what I've observed, and the data backs this up, we're seeing more homes for sale, which is great news for buyers who felt like they were in a fierce bidding war just a year or two ago. This increase in inventory, coupled with buyers adjusting to higher borrowing costs, means sellers need to be more strategic with their pricing.

Looking at the statewide figures for single-family homes in May 2025:

  • Closed Sales: Down 5.7% from last year, totaling 24,756.
  • Median Sale Price: $415,000, a 2.7% drop from a year ago.

Dr. Brad O'Connor, the Chief Economist for Florida Realtors, pointed out that this is the third month in a row of year-over-year price drops statewide for single-family homes. However, he's quick to remind us that prices are still a hefty 54% above where they were in 2020. This context is vital – it's a recalibration, not a collapse. It's a return to something more “normal” after a period that was anything but.

Understanding Cape Coral's Market – A Benchmark

Let's zoom in on Cape Coral-Fort Myers MSA, which serves as our benchmark for this discussion. This area, particularly Lee County, saw immense growth and certainly its share of challenges, especially after Hurricane Ian. When I look at the numbers for single-family homes in Cape Coral-Fort Myers MSA for May 2025, here's what stands out:

  • Closed Sales: 1,443, a slight 1.6% decrease from the previous year. This is a pretty moderate dip, suggesting demand is still present.
  • Median Sale Price: $375,000, a more notable 9.6% decline year-over-year.

From my perspective, this price correction in Cape Coral makes sense. It experienced a massive surge in prices post-pandemic and then dealt with the complexities of hurricane recovery. While recovery brings investment, it also brings unique challenges that can temporarily cool the market. A nearly 10% price drop sounds significant, but remember, this area's median price was likely inflated in recent years, making this more of a return to reality than a deep plunge. Buyers now have a bit more room to negotiate, and sellers are adapting.

So, the question remains: are there other areas in Florida where the single-family home market is feeling an even greater squeeze than Cape Coral's notable 9.6% price correction? The answer is yes, and let's explore which ones and why.

The 4 Housing Markets in Florida Currently Worse Than Cape Coral

When I analyzed the statewide data for May 2025, focusing on single-family homes, I looked for metropolitan areas that showed more aggressive year-over-year declines in median sale prices or a combination of significant price and sales drops compared to Cape Coral-Fort Myers MSA's -9.6% price change and -1.6% sales change.

Here's what I found, with four specific MSAs standing out:

1. Naples-Immokalee-Marco Island MSA

  • May 2025 Single-Family Home Data:
    • Closed Sales: Down 15.3% year-over-year.
    • Median Sale Price: $767,800, a sharp 19.2% decrease year-over-year.

In my view, Naples stands out as a prime example of a market currently experiencing a greater downturn than Cape Coral. Why is this median price drop so much more severe here? Naples is known for its luxury and high-end properties. These segments of the market can be more sensitive to economic shifts, particularly rising interest rates and stock market volatility, which impact wealthier buyers. When the cost of borrowing goes up, or investments dip, ultra-luxury buyers might pause, leading to fewer sales and more pressure on sellers to lower prices. The sheer value of these homes means even a percentage drop translates to a large dollar amount, which can feel more impactful.

2. Punta Gorda MSA

  • May 2025 Single-Family Home Data:
    • Closed Sales: Up 1.7% year-over-year.
    • Median Sale Price: $325,000, a significant 14.5% decrease year-over-year.

Punta Gorda's numbers present an interesting puzzle. While closed sales actually increased – suggesting continued buyer interest – the median sale price dropped by a substantial 14.5%. This is a larger price erosion than Cape Coral's. My take on this is twofold: First, like Cape Coral, Punta Gorda was heavily impacted by Hurricane Ian, and the post-hurricane market dynamics, including insurance costs and recovery efforts, are likely influencing buyer behavior and valuations. Second, it's possible that a higher proportion of sales at lower price points or properties needing more work are driving down the median, or sellers who held on to highly appreciated properties are now more motivated to adjust to current market conditions. It's a signal that while homes are selling, the perceived value of those homes has softened considerably.

3. Sebastian-Vero Beach MSA

  • May 2025 Single-Family Home Data:
    • Closed Sales: Down 6.8% year-over-year.
    • Median Sale Price: $386,190, a 10.2% decrease year-over-year.

Sebastian-Vero Beach, a coastal region, also shows a steeper decline in median price than Cape Coral, alongside a larger drop in sales. This combination suggests a more pervasive cooling. Areas along the coast often attract second-home buyers and retirees, who might be more discretionary in their purchases. Higher insurance premiums, a concern across all of Florida, could be particularly impactful in coastal areas like this, adding to the overall cost of homeownership and potentially dampening buyer enthusiasm, leading to price concessions. The 10.2% price drop indicates sellers are adapting to a clearer buyer's market here.

4. North Port-Sarasota-Bradenton MSA

  • May 2025 Single-Family Home Data:
    • Closed Sales: Down 4.7% year-over-year.
    • Median Sale Price: $475,000, a 9.9% decrease year-over-year.

While the price drop here is only slightly worse than Cape Coral's (-9.9% vs. -9.6%), the sales decline is significantly greater (-4.7% vs. -1.6%). The North Port-Sarasota-Bradenton area has been a magnet for new residents, especially during the pandemic boom. Such rapid growth often leads to prices that outpace fundamental value, creating conditions ripe for a correction when demand cools. This area saw massive appreciation, and now, with higher interest rates and increased inventory, the market is finding its new equilibrium. The combined effect of dropping sales and prices signifies a more challenging environment for sellers compared to Cape Coral.

Here’s a quick comparison highlighting the May 2025 single-family home performance:

MSA Median Sale Price (May 2025) Y/Y % Chg Price Closed Sales (May 2025) Y/Y % Chg Sales
Cape Coral-Fort Myers MSA (Benchmark) $375,000 -9.6% 1,443 -1.6%
Naples-Immokalee-Marco Island MSA $767,800 -19.2% 431 -15.3%
Punta Gorda MSA $325,000 -14.5% 536 +1.7%
Sebastian-Vero Beach MSA $386,190 -10.2% 273 -6.8%
North Port-Sarasota-Bradenton MSA $475,000 -9.9% 1,574 -4.7%

Data from Florida Realtors®, May 2025 Single-Family Home Market Activity.

Market Nuances: Why Some Areas Experience Sharper Shifts

Beyond the specific numbers, I think it's crucial to understand the underlying currents affecting these markets. Why are some areas seeing sharper adjustments than others?

  • Luxury Market Sensitivity: Areas with a higher concentration of luxury homes (like Naples) are often the first to feel the effects of economic shifts. When interest rates rise, even wealthy buyers feel it or choose to invest their capital elsewhere temporarily.
  • Post-Hurricane Recovery Paths: While all of Florida contends with hurricane season, areas hit directly by formidable storms can see diverse recovery patterns. Insurance costs rise, availability of skilled labor for repairs can be tight, and buyer perceptions can shift. The markets recovering from Hurricane Ian are still finding their footing. From my experience, some areas bounce back quicker due to strong local economies or higher investment, while others might lag.
  • Prior Price Appreciation: Markets that saw the most aggressive price increases during the peak of the boom are often facing a more significant correction. It's simply mathematics; the higher the run-up, the more room there is for prices to come down without necessarily reflecting a “crash” but rather a return to a more sustainable level.
  • Inventory Ratios: Dr. O'Connor mentioned that Florida's inventory levels for both single-family homes (5.6 months' supply) and condo-townhouses (10.3 months' supply) are back to pre-2020 levels. A higher supply, especially when combined with lower demand, puts downward pressure on prices. If an area has a particularly high number of homes for sale relative to buyer interest, that market will soften more quickly.

It's also worth noting that the condo and townhouse market statewide is experiencing even more pronounced price erosion, with average median prices for these units being down 6.1% year-over-year. This has been a longer trend, starting in July of last year. While my focus here is single-family homes, it's a good reminder that different property types react differently to market pressures.

“Worse” Doesn't Always Mean “Bad”

For current homeowners, seeing price declines can be concerning. But as a professional in this field, I always emphasize perspective. A market correction isn't a disaster, especially in Florida, which remains a highly desirable place to live. Today's market is nothing like the Great Financial Crisis; inventory levels are still well below 2008 figures.

For potential buyers, especially those who were priced out during the frenzied years, these shifts represent opportunity. More inventory means more choices, less competition, and hopefully, more reasonable prices. This “balancing act” is exactly what a healthy market needs to prevent unsustainable bubbles.

My advice to anyone navigating these markets is simple: local expertise matters more now than ever. A good Realtor isn't just about unlocking doors; they're about explaining the hyper-local nuances of your specific neighborhood, the current insurance climate, and effective pricing strategies. In these evolving times, preparation and expert guidance truly make all the difference.

The Road Ahead

Florida's housing market is resilient. It's adjusting, not collapsing. While some areas, like those we've discussed – Naples, Punta Gorda, Sebastian-Vero Beach, and North Port-Sarasota-Bradenton – are experiencing greater price and sales adjustments than Cape Coral, these are generally healthy corrections after a period of intense growth. They reflect a market maturing and finding a new, more sustainable pace. Whether you're buying or selling, understanding these localized trends is key to making informed decisions in Florida's dynamic real estate world.

“Invest in Real Estate in the “Hottest Florida Markets”

Discover high-quality, ready-to-rent properties designed to deliver consistent returns.

Contact Norada today to expand your real estate portfolio with confidence.

Contact our investment counselors (No Obligation):

(800) 611-3060

Get Started Now 

Read More:

  • Worst Florida Housing Markets Facing Steepest Price Declines in 2025
  • Cape Coral Housing Market Crash: Boom, Bust, and Echoes in 2025
  • Why is Cape Coral Housing Market in Florida Doomed to Crash in 2025?
  • 5 Popular Florida Housing Markets Are at High Risk of Price Crash
  • 2 Florida Housing Markets Flagged for a Major Price Decline Risk
  • 24 Florida Housing Markets Could See Home Prices Drop by Early 2026
  • Is the Florida Housing Market Headed for Another Crash Like 2008?
  • Key Trends Shaping the Florida Housing Market in 2025
  • This Florida Housing Market Bucks National Trend With Declining Prices
  • Florida Housing Market Crash 2.0? Analyst Warns of 2008 Echoes
  • Tax Relief Proposed as Florida Housing Market Faces Deepening Crisis

Filed Under: Housing Market, Real Estate Market Tagged With: Florida, Housing Market, housing market crash, Housing Market Trends

Will the Texas Housing Market Crash as Prices Drop Across the State?

July 24, 2025 by Marco Santarelli

Texas Housing Market Enters Correction Phase as Prices Drop Across the State

It wasn't that long ago that the Texas housing market felt unstoppable. Homes were selling in bidding wars, often in days, and prices seemed to climb forever. For anyone trying to buy, it was a frustrating, expensive time. But times change, and the latest data points suggest a significant shift is underway. Indeed, the Texas housing market enters a major correction phase as prices drop across the state, driven by a dramatic increase in the number of homes for sale.

I've been watching real estate markets for years, and what we're seeing in Texas right now is a clear signal that the wild boom times are over, at least for now. Let's dive into what the numbers are telling us and what it means if you're a buyer, a seller, or just curious about the Lone Star State's real estate future.

Will the Texas Housing Market Crash as Prices Drop Across the State?

The Unmistakable Sign: Skyrocketing Inventory

The first and perhaps most obvious sign of a changing market is the sheer number of homes sitting on the market. Think of it like this: when there are way more items on the store shelves than people wanting to buy them, the store eventually has to lower prices to move the goods. The same principle applies to housing.

According to data highlighted by real estate analyst Nick Gerli, the CEO of Reventure App, the number of active listings for sale across Texas has shot up dramatically. Looking at the historical data, the state's inventory levels were relatively stable before the pandemic madness.

  • In 2017, active listings were around 89,193.
  • They hovered in the 88,000s and 90,000s through 2018, 2019, and 2020.
  • The average during this pre-pandemic period was roughly 80,128 listings.

Is Texas Housing Crashing? Data Shows 53% Inventory Jump, Prices Falling
Source: Reventure App via X

Then came the pandemic boom. Fueled by low interest rates, remote work, and a rush of migration, demand exploded while supply tightened. Builders couldn't keep up, and homeowners with incredibly low mortgage rates weren't selling. This caused inventory to absolutely plummet to historic lows.

  • In 2021, listings dropped to a stunning low of around 35,997.
  • 2022 wasn't much better, staying incredibly tight at about 34,932.

These incredibly low numbers are a huge reason prices jumped so much. There just weren't enough houses for everyone who wanted one.

But the tide has turned. As interest rates climbed and the initial rush of pandemic buyers slowed, more homes started coming onto the market, and fewer buyers were able to jump in.

  • Inventory started climbing in 2023 to around 68,817.
  • It continued its ascent in 2024, hitting about 95,156.
  • And now, the data point that really catches my eye: in April 2025, active listings hit a whopping 123,237.

Let that sink in. 123,237 active listings. Compared to the roughly 80,128 average from 2017-2020, that's about a 53% increase in the number of homes available for sale. Compared to the pandemic lows of 2021-2022, it's literally more than triple the inventory.

From my perspective as someone who follows these markets, such a rapid and significant rise in inventory is a screaming signal. It tells me that the intense competition among buyers has faded. Sellers are finding their homes are sitting on the market longer, and they're facing much more competition from other homes for sale. This shifts the power dynamic firmly towards buyers.

Prices Are Following Suit: It's Not Just Inventory

High inventory is important because it's a leading indicator, but the real impact people feel is on prices. And Nick Gerli's analysis confirms what we'd expect: prices are now dropping across the state.

This isn't just a prediction based on inventory; it's a report on what's actually happening. We're seeing more price cuts, longer days on market before a home sells (if it sells), and ultimately, sale prices coming down from their peaks.

Why is this happening now? It's a mix of factors all coming together:

  1. The Inventory Surge: As discussed, more choices mean buyers don't have to overpay or waive contingencies like they did before.
  2. Higher Interest Rates: This is a massive factor. Even if a house price is slightly lower, the monthly payment on a mortgage is significantly higher now than it was a couple of years ago because interest rates have risen. This directly impacts how much house people can afford, reducing the pool of eligible buyers.
  3. Slowing Migration: The influx of new residents, particularly from more expensive states like California, was a major driver of demand and price growth in Texas during the boom. Nick Gerli notes that domestic migration into Texas slowed significantly in 2024, down 62%. While Texas is still growing, the pace of migration that fueled the recent frantic buying has cooled considerably. Fewer people arriving with potentially higher budgets means less competition for local buyers.

When you combine a flood of supply with cooling demand (due to affordability issues and slower migration), the result is predictable: prices have to come down to find the market clearing level.

How Much Could Prices Drop in Texas? Looking Ahead

This is the question on everyone's mind: just how far could this correction go? Predicting the exact bottom is impossible, but the data gives us some strong hints and potential scenarios.

One way to look at it is comparing current prices to long-term historical norms relative to incomes or rents. Nick Gerli's analysis suggests that Texas home values are still about 17.7% overvalued today compared to that historical relationship. This means, even with some recent small drops, prices haven't yet fully adjusted back to where they “should” be based on underlying economic fundamentals over the long run. He notes this overvaluation has improved a bit recently (meaning prices got even more overvalued at the peak), but it's still significant.

Based on current supply/demand conditions like the skyrocketing inventory, increased price cuts, and longer days on market, Reventure's short-term forecast (over the next 12 months) is for home prices in Texas to drop by -4.0% statewide. This seems like a reasonable near-term prediction given the clear shift in market dynamics we're witnessing.

However, Nick Gerli also talks about the potential for a larger correction, perhaps in the range of 15-20%. This more significant drop is a possibility, especially if certain economic conditions worsen. A key risk factor he points out is the oil industry. Texas's economy, while diverse, still has significant ties to energy. He mentions oil prices around $57/barrel as being problematic, potentially causing local operators to shut down production. A recession in the oil sector could lead to job losses and reduced economic activity in parts of Texas, further weakening housing demand and potentially accelerating price declines.

My own thoughts align with this analysis. Markets rarely correct in a perfectly smooth line. The 4% drop over the next year might be the initial phase, especially if economic conditions remain stable. But if there's an external shock, like a downturn in a key industry or a broader recession, the correction could easily deepen into that 15-20% range. The underlying overvaluation suggests there's still room for prices to fall before they hit historical norms.

The Silver Lining: A Step Towards Affordability

While headlines about price drops can sound alarming, it's important to remember why this correction is happening. The previous run-up in prices made Texas, a state long known for its relative affordability, increasingly out of reach for many of its residents. This was particularly true for first-time buyers or those earning local wages who weren't benefiting from the high salaries of coastal transplants.

Prices declining is actually a necessary step towards restoring some balance and improving affordability. As prices come down, more local Texans will be able to consider buying a home again. This can bring buyers back into the market, which in turn helps stabilize things eventually.

Even after a potential 4% drop, Nick Gerli's analysis suggests the market might still be about 10-12% overvalued. This indicates that the path to full affordability, based on historical metrics, might require further price adjustments down the line.

Understanding Reventure's Forecast Score

Reventure App uses a forecast score (0 to 100) to predict 12-month price movements based on supply and demand fundamentals. Texas currently has a score of 37/100. Scores closer to 0 indicate a market where prices are expected to decline, while scores closer to 100 suggest prices are likely to rise. A score of 37 is on the lower end, reinforcing the expectation of falling prices in the near future compared to other markets in the U.S. It signals weak fundamentals for price appreciation right now.

My Take on What This Means

Based on the data, the trends, and my understanding of how markets work, here's my personal view:

  • For Sellers: The party is over. Listing your home now means entering a market with much more competition. You'll likely need to price competitively, be prepared for negotiation, and accept that your home might take longer to sell than it would have a year or two ago. Overpricing is the quickest way to have your listing sit and eventually require larger price cuts.
  • For Buyers: This is potentially good news. You have more options, less pressure to make rushed decisions, and more leverage to negotiate on price and terms. However, higher interest rates still make the monthly cost of buying high, even if the price comes down. Don't just look at the list price; look at the full monthly payment with the current rates. Do your homework on local market conditions – while the state average is dropping, some specific neighborhoods might hold up better than others initially.
  • For Texas: A housing market correction, while painful for those who bought at the peak, is ultimately healthy if it improves affordability. Making it easier for residents who work in the state to afford homes is crucial for long-term economic stability and quality of life.

The dramatic increase in inventory, coupled with clear signs of prices dropping and underlying overvaluation, strongly indicates that the Texas housing market is undergoing a significant correction. It's a necessary adjustment after a period of unsustainable growth. While the exact magnitude and duration of the downturn remain to be seen and could be influenced by broader economic factors like the energy sector, the direction is clear: the Texas housing market is cooling down, and prices are finding a new level.

Work With Norada in Texas's Shifting Market

As Texas enters a housing correction phase, savvy investors are capitalizing on price adjustments and increased inventory across key markets.

Norada offers a curated selection of turnkey rental properties in resilient Texas cities, providing consistent income and long-term appreciation potential.

HOT NEW LISTINGS JUST ADDED!

Connect with a Norada investment counselor today (No Obligation):

(800) 611-3060

Get Started Now 

Read More:

  • Average Down Payment on a House in Texas in 2025
  • Texas Housing Market Predictions for Next 2 Years: 2025-2026
  • 10 Texas Cities Where Home Prices Are Predicted to Drop in 2025
  • This Texas Housing Market is the Best in the U.S. [2024 Rankings]
  • Texas Housing Market: Prices, Trends, Predictions
  • Are Texas Home Sales Dropping ?
  • How Much Do Real Estate Agents Make in Texas?
  • 10 Cheapest Places to Live in Texas
  • Is Texas a Good Place to Live: Explore the Cost, Jobs and Lifestyle

Filed Under: Financing, Housing Market, Mortgage Tagged With: Housing Market, Housing Market Correction, Real Estate Market, Texas

  • « Previous Page
  • 1
  • …
  • 13
  • 14
  • 15
  • 16
  • 17
  • …
  • 86
  • Next Page »

Real Estate

  • Birmingham
  • Cape Coral
  • Charlotte
  • Chicago

Quick Links

  • Markets
  • Membership
  • Notes
  • Contact Us

Blog Posts

  • Fed Interest Rate Forecast Signals High Probability of December 2025 Rate Cut
    December 7, 2025Marco Santarelli
  • Florida Housing Market Forecast for 2026 Indicates Price Declines Ahead
    December 7, 2025Marco Santarelli
  • Multiple Florida Housing Markets Are on the Brink of a Crash in 2026
    December 7, 2025Marco Santarelli

Contact

Norada Real Estate Investments 30251 Golden Lantern, Suite E-261 Laguna Niguel, CA 92677

(949) 218-6668
(800) 611-3060
BBB
  • Terms of Use
  • |
  • Privacy Policy
  • |
  • Testimonials
  • |
  • Suggestions?
  • |
  • Home

Copyright 2018 Norada Real Estate Investments

Loading...