Norada Real Estate Investments

  • Home
  • Markets
  • Properties
  • Membership
  • Podcast
  • Learn
  • About
  • Contact

24 Florida Housing Markets Could See Home Prices Drop by Mid 2026

August 27, 2025 by Marco Santarelli

24 Florida Housing Markets Could See Home Prices Drop by Mid 2026

According to recent data and forecasts, around 24 Florida housing markets may experience a drop in home prices by mid-2026. This isn't a cause for widespread panic, but it does signal a shift from the red-hot market we've seen in recent years towards a more balanced, and in some areas, a slightly cooler environment.

As someone who's been following Florida real estate for a while, this kind of adjustment is actually healthy for the long-term stability of the market. It means we're moving away from unsustainable price growth and towards a reality where affordability might become a bit more attainable for more people.

24 Florida Housing Markets Could See Home Prices Drop by Mid-2026

First, let's clear the air: “price drop” doesn't necessarily mean a crash. It means moderation, a cooling off after a period of intense appreciation. Think of it less as a nosedive and more as a gentle descent back to earth after a rocket launch. The data from Florida Realtors® for June and the second quarter of 2025 actually shows some interesting trends that support this, even as we look ahead to potential price moderation.

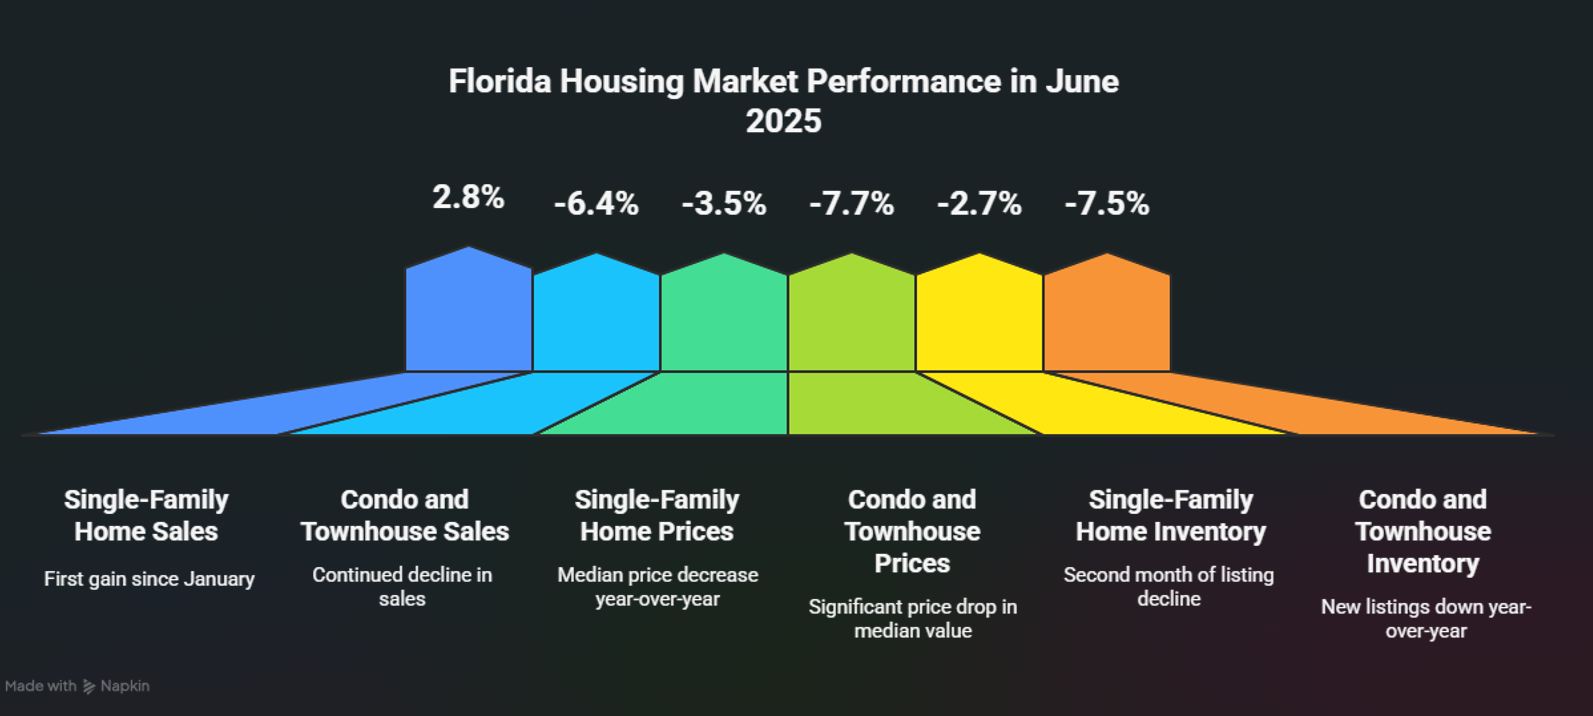
What's happening on the ground? In June, Florida saw its first year-over-year gain in closed single-family home sales since January, with a 2.8% increase. That's a positive sign, indicating more activity. However, when you dig into the second quarter numbers, sales were down 2.6%. It's a mixed bag, but the overall story is one of transition.

Dr. Brad O’Connor, the Chief Economist at Florida Realtors®, pointed out that this June rebound helped soften what would have been a tougher second quarter. For condos and townhouses, sales were down 6.4% in June, which, while still a decline, was significantly less severe than the 20% drop seen in May. This suggests that while the market is cooling, it's not collapsing.

The median sales price for single-family homes in June was $412,000, down 3.5% from June 2024. Condo prices saw a sharper drop of 7.7%, with the median price at $300,000. This is crucial information: prices are moderating. For the second quarter, the single-family median price was $414,900 (down 3.1%), and the condo median was $310,000 (down 6.1%). This moderation is a key indicator of the market shifting from a seller's advantage to a more balanced playing field.

What's Driving the Shift in Florida's Housing Market?

Several factors are contributing to this evolving market. One major player is inventory. Dr. O’Connor noted that active listings for single-family homes were down 2.7% in June compared to the previous year. This follows a period of growth in new listings earlier in the year. For condos and townhouses, new listings were down even more, 7.5% year-over-year in June.

What does this mean? While the number of homes for sale might be slightly down compared to last year, the months' supply is still healthy. We're looking at 5.6 months' supply for single-family homes and a robust 10 months' supply for condos and townhouses. A “months' supply” tells us how long it would take to sell all the homes currently on the market at the current sales pace. Anything over 4-6 months is generally considered a balanced market, and 10 months definitely favors buyers. This increased supply gives buyers more choices and more negotiating power, which naturally puts downward pressure on prices that were previously being bid up aggressively.

Another significant factor is interest rates. While not explicitly detailed in the provided data, we all know that higher mortgage rates make buying a home more expensive, even if the list price hasn't changed. For many potential buyers, this increased cost can price them out of the market or force them to look for more affordable options, thus slowing down demand and eventually impacting prices.

Tim Weisheyer, the 2025 Florida Realtors® President, hit the nail on the head when he said the market is “transitioning toward balance.” He also highlighted that “motivated sellers who understand today’s market dynamics are attracting qualified buyers.” This is the human element of the market. Sellers who overprice their homes or are unwilling to negotiate are going to be left waiting. Those who are realistic about current conditions and are working with skilled Realtors® are the ones who are seeing success.

Spotlight on the 24: Which Florida Markets Could See Price Declines?

Now, let's get to the specifics. Zillow's data offers a projection of potential price changes in various Florida metropolitan areas (MSAs) through mid-2026. It's important to remember that these are forecasts, not guarantees, and they are based on sophisticated modeling. However, they do give us a strong indication of where more significant price moderation might occur.

The table below outlines some of these markets, showing the projected percentage change in home prices from June 2025 through July 2025, September 2025, and finally, June 2026.

Florida Market Projected Price Change (July 2025) Projected Price Change (Sept 2025) Projected Price Change (June 2026)
Punta Gorda, FL -1.4% -3.3% -4.0%
North Port, FL -1.1% -3.2% -3.2%
Cape Coral, FL -1.2% -2.9% -2.9%
Crestview, FL -0.7% -2.0% -2.6%
The Villages, FL -0.4% -1.3% -2.4%
Tallahassee, FL -0.4% -1.4% -2.1%
Panama City, FL -0.6% -2.0% -2.1%
Deltona, FL -0.7% -1.9% -1.9%
Gainesville, FL -0.5% -1.7% -1.8%
Jacksonville, FL -0.6% -1.7% -1.7%
Palm Bay, FL -0.6% -1.7% -1.6%
Sebastian, FL -0.8% -1.9% -1.6%
Tampa, FL -0.7% -2.0% -1.5%
Orlando, FL -0.7% -1.8% -1.5%
Lakeland, FL -0.6% -1.6% -1.3%
Pensacola, FL -0.4% -1.3% -1.3%
Palatka, FL -0.3% -1.4% -1.3%
Naples, FL -0.9% -2.4% -1.2%
Homosassa Springs, FL -0.7% -1.9% -0.9%
Miami, FL -0.7% -1.8% -0.7%
Port St. Lucie, FL -0.7% -1.7% -0.7%
Arcadia, FL -0.5% -1.6% -0.7%
Key West, FL -0.7% -1.7% -0.5%
Ocala, FL -0.5% -1.3% -0.2%

Looking at this table, you can see that markets like Punta Gorda, North Port, and Cape Coral are projected to see the most significant price moderation by mid-2026, with percentages in the negative territory. These are areas that, like much of Florida, experienced substantial price growth over the past few years. As the market normalizes, it's natural that some of the more rapid appreciation will be reined in.

Why These Specific Markets? Insights and Nuances

It's not a coincidence that many of the markets showing potential price moderation are in Southwest Florida and along the Gulf Coast. These regions, including Punta Gorda, North Port, Venice (part of the North Port-Sarasota-Bradenton MSA), Fort Myers, and Cape Coral, saw some of the most dramatic price increases during the boom years. This was fueled by a combination of factors, including robust demand from out-of-state buyers, limited inventory, and relatively lower price points compared to some other popular coastal areas which made them attractive.

As the market cools, these areas are likely to experience a more pronounced correction because the feverish demand that drove prices sky-high may also be the first to temper. When inventory levels rise, as they have been, and demand softens slightly due to economic conditions and higher interest rates, prices can begin to adjust downwards.

The Villages, known for its unique demographic and active adult community, also appears on this list. While it has its own distinct market dynamics, it's not immune to broader economic trends. The projected slight dip here might reflect a normalization of demand after a period of intense interest.

Other areas like Crestview, Tallahassee, and Panama City in the Panhandle are also showing projected declines. These markets might be more sensitive to shifts in local economic drivers, perhaps related to military presence or specific industry employment.

Jacksonville, Tampa, and Orlando – the major metropolitan hubs – are also included, though with more modest projected declines. These are larger, more diverse economies, which can sometimes buffer the impact of market shifts compared to smaller, more specialized areas. However, even in these larger markets, the overall trend of softening prices is evident in the data.

I’ve lived and worked in various parts of Florida, and in my experience, these markets often lead the way in price adjustments, both up and down. When growth was rapid, these were the places seeing the biggest jumps. Now, as things settle, they are showing the most significant moderation.

What Does This Mean for Buyers and Sellers?

For buyers, this is potentially good news. If you've been priced out of the market or struggling to compete, softer prices and increased inventory could mean more opportunities to find a home that fits your budget. It might be the time to be patient, get pre-approved for a mortgage, and work with a local expert to understand the nuances of specific neighborhoods. Don't rush into a purchase, but be ready to act when the right opportunity arises. This period of moderation can help you avoid overpaying, which is a smart long-term strategy.

For sellers, it means adjusting expectations. The days of multiple offers significantly over asking price might be fewer and farther between. It's crucial to price your home accurately based on current market conditions and be prepared to negotiate. Working with a Realtor® who has their finger on the pulse of your local market is more important than ever. They can help you stage your home effectively, market it strategically, and guide you through negotiations to ensure the best possible outcome.

The Bigger Picture: A Healthy Market Adjustment?

From my perspective, this isn't a sign of impending doom for Florida real estate. Instead, it looks like a natural correction after an unsustainable period of growth. The rapid price increases we saw were driven by a confluence of factors: low interest rates, a surge in demand from people relocating, and a lack of available housing. As interest rates have climbed and inventory has started to improve (even with some recent dips in new listings), the market is recalibrating.

The fact that closed sales are starting to tick up is encouraging. It suggests that demand hasn't disappeared; it's just becoming more selective and price-sensitive. A market with steady demand and more balanced prices is often healthier and more sustainable in the long run than one that experiences wild, unpredictable swings.

The expert consensus, as echoed by Tim Weisheyer, points to a market that's moving toward “balance.” This means that we'll likely see more predictable price trends, more reasonable negotiation periods, and a more stable environment for both buyers and sellers. It's about restoring a sense of normalcy after an unusual period.

Looking Ahead: Key Takeaways

  • Price Moderation is Expected: Approximately 24 Florida housing markets are projected to see home prices decline by mid-2026.
  • Southwest Florida Impact: Areas like Punta Gorda, North Port, and Cape Coral may experience more notable price adjustments.
  • Data Supports a Shift: Recent Florida Realtors® data shows moderating prices and a mixed bag for sales, indicating a market in transition.
  • Inventory and Interest Rates are Key: Increased supply and higher borrowing costs are influencing demand and price trends.
  • Opportunity for Buyers: Potential buyers may find more favorable conditions and greater affordability.
  • Sellers Need Realistic Expectations: Pricing and negotiation strategies are critical for sellers in this evolving market.

It's an exciting time in Florida real estate, not because of sky-high price appreciation, but because we're moving towards a more stable and predictable market. For anyone involved in buying or selling a home in Florida, staying informed and working with experienced professionals are your best tools. The market is always changing, and understanding these shifts is key to making smart decisions.

Stay Ahead of the Florida Housing Market Shifts

With reports suggesting that multiple Florida housing markets could face price declines by mid-2026, smart investors are preparing now.

Norada helps you identify stable, cash-flowing rental properties in resilient markets—so you can protect your portfolio and grow long-term wealth.

STRATEGIC OPPORTUNITIES AVAILABLE NOW!

Talk to a Norada investment counselor today (No Obligation):

(800) 611-3060

Get Started Now

Read More:

  • Key Trends Shaping the Florida Housing Market in 2025
  • This Florida Housing Market Bucks National Trend With Declining Prices
  • Florida Housing Market Crash 2.0? Analyst Warns of 2008 Echoes
  • Tax Relief Proposed as Florida Housing Market Faces Deepening Crisis
  • Is the Florida Housing Market on the Verge of Collapse or a Crash?
  • 3 Florida Cities at High Risk of a Housing Market Crash or Decline
  • Florida Housing Market: Record Supply Expected to Favor Buyers in 2025
  • Florida Housing Market Forecast for Next 2 Years: 2025-2026
  • Florida Housing Market: Predictions for Next 5 Years (2025-2030)
  • Hottest Florida Housing Markets in 2025: Miami and Orlando
  • Florida Real Estate: 9 Housing Markets Predicted to Rise in 2025
  • 3 Florida Housing Markets Are Again on the Brink of a Crash
  • Florida Housing Market Predictions 2025: Insights Across All Cities
  • When Will the Housing Market Crash in Florida?
  • South Florida Housing Market: Will it Crash?

Filed Under: Housing Market, Real Estate Market Tagged With: Florida, Housing Market, housing market crash, Housing Market Trends

Florida Housing Market Graph 50 Years

August 27, 2025 by Marco Santarelli

Florida Housing Market Graph 50 Years

Want to know what the Florida housing market graph 50 years looks like? Buckle up, because we're about to take a whirlwind tour through five decades of home price fluctuations in the Sunshine State. Understanding this history is crucial whether you're a seasoned investor, a first-time homebuyer, or just plain curious about Florida real estate.

This isn't your average, dry statistical report. We'll look at the raw data, sure, but we'll also dig into the why behind the numbers. We'll explore major events, economic shifts, and even speculate on what the future might hold for Florida's dynamic housing market. I've been following the Florida real estate market for years, and trust me, it's been one heck of a ride.

Florida Housing Market Graph 50 Years: A Deep Dive

Florida Housing Market Graph 50 Years: A Deep Dive
Source: FRED

The Data: A 50-Year Picture of Florida Housing Prices

Our journey starts with the All-Transactions House Price Index for Florida (FLSTHPI), sourced directly from the Federal Reserve Bank of St. Louis's FRED database. This index provides a quarterly snapshot of average home prices, adjusted for inflation. This data, available since 1975, gives us a powerful glimpse into the long-term trends of the Florida housing market graph 50 years.

Remember, this is an index, meaning the starting point (1980:Q1) is set at 100. So, a value of 200 would signify that home prices have doubled since that baseline. While not every individual home's price will match the index precisely, it gives us an excellent overall picture.

I've personally found this data invaluable in my own real estate analyses. Its consistent methodology makes it a reliable tool for understanding long-term price changes in the state.

Here's a condensed table highlighting key periods, but we will dive into specifics later:

Period Notable Trends
1975-1980 Relatively slow growth
1980-2000 Gradual, steady increase
2000-2006 Boom years, rapid price appreciation
2007-2011 The Great Recession: sharp decline
2012-2020 Recovery and moderate growth
2020-Present Exponential growth, driven by various factors

Early Years (1975-1980): A Foundation Is Laid

The early years of the Florida housing market graph 50 years reveal relatively modest growth. Looking at the data, the index increased from around 65 in 1975 to 100 by 1980. This period was one of gradual development, with population growth and economic expansion setting the stage for more significant changes later on. Many factors contributed, including slower population growth compared to what we’d see in later decades. Think of it as the quiet before the storm.

The Steady Climb (1980-2000): Gradual Growth and Regional Variations

From the 1980s to the turn of the millennium, the Florida housing market graph 50 years shows a consistent upward trend. The increase was not uniform across the state, though. Coastal areas and popular retirement destinations experienced comparatively faster growth, while other regions moved at a slower pace. This reflects the beginning of the diversification of Florida's housing market. Different regions experienced fluctuations based on economic influences specific to those areas.

The Boom and the Bust (2000-2011): The Housing Bubble and Its Aftermath

The first decade of the 21st century presented one of the most dramatic periods in the history of the Florida housing market graph 50 years. The early 2000s saw rapid appreciation in home prices – a period often referred to as a housing bubble. Low-interest rates, easy credit, and speculation drove prices to unprecedented levels. However, this boom was unsustainable. The 2008 financial crisis, stemming from the subprime mortgage crisis, burst the bubble. This period witnessed a severe decline in home prices, with many homeowners facing foreclosure. I’ve personally witnessed the struggles of families during this time and the lasting impact on the market remains very real.

Recovery and Resurgence (2012-2020): A Slow but Steady Climb

The period after the Great Recession saw a slow but steady recovery. While home prices didn’t return to their pre-crash highs immediately, the Florida housing market graph 50 years illustrates a gradual upward trajectory. Cautious lending practices and government interventions aimed to stabilize the market and prevent further collapse. While growth was slower than during the boom, the recovery showed resilience. Florida's economic diversification played a role as well.

The Pandemic Surge (2020-Present): Unprecedented Growth

The Florida housing market graph 50 years reaches a remarkable inflection point starting in 2020. The COVID-19 pandemic triggered an unexpected surge in home prices. Several factors contributed to this unprecedented boom: low-interest rates, increased remote work opportunities (leading to a migration to Florida), and a shortage of available housing. These factors caused an exceptionally rapid increase in home values, creating both opportunities and challenges for buyers and sellers.

This period underlines just how unpredictable the market can be. I’ve watched many forecasts fall short in this era of unexpected change.

Analyzing the Florida Housing Market Graph 50 Years: Key Observations

Looking at the complete Florida housing market graph 50 years, some overarching trends stand out:

  • Long-term Appreciation: Despite periodic downturns, the long-term trend is one of steady price appreciation.
  • Cycles of Boom and Bust: The market has exhibited distinct periods of rapid growth (boom) followed by correction or decline (bust).
  • Regional Variations: Price changes aren't uniform across the state. Coastal regions and major urban centers generally experience faster growth.
  • External Factors: Economic conditions, interest rates, and population shifts significantly influence home prices.
  • Supply and Demand: The balance of supply and demand plays a crucial role, with shortages often leading to rapid price appreciation.

Future Predictions: What Lies Ahead for Florida Real Estate?

Predicting the future of the Florida housing market graph 50 years is always a risky proposition. However, considering past patterns and current market dynamics, we can speculate on some potential scenarios.

  • Continued Growth, but Perhaps at a Slower Pace: While it is unlikely to maintain the explosive growth of the last few years, we can expect prices to likely continue increasing over the long term.
  • Increased Volatility: Market cycles are likely to persist, meaning periods of faster and slower growth.
  • Rising Interest Rates: Interest rates will likely exert a moderating influence on prices.
  • Infrastructure Development: Investments in Florida's infrastructure could lead to regional variations in home price growth.
  • Climate Change Concerns: The impact of climate change, including sea-level rise, might affect the desirability and value of properties in certain areas.

This is simply educated speculation, of course. A lot can change in the coming years. In my experience, adaptability and a keen eye on market changes are crucial for success in Florida real estate.

Florida Housing Market Graph 50 Years: A Conclusion

The Florida housing market graph 50 years tells a fascinating story of growth, resilience, and unexpected shifts. Understanding the past helps us navigate the present and prepare for the future. From periods of quiet growth to explosive booms and challenging corrections, the market has proven its dynamism.

I hope this deeper dive provides you with a better understanding and appreciation of the complex world of Florida real estate. It is a market brimming with opportunities, but also one that demands careful planning, smart decisions, and an understanding of the forces that shape it. Remember to always consult with professionals and conduct thorough research before making any real estate decisions.

Related Articles:

  • 24 Florida Housing Markets Could See Home Prices Drop by Mid 2026
  • Florida Housing Market Forecast: 5 Cities at High Risk of Price Crash
  • Is a Major Florida Housing Market Crash Coming in 2026?
  • House Price Graph Last 20 Years USA
  • Housing Market Graph 50 Years: Showing Price Growth
  • San Diego Housing Market Graph 50 Years: Analysis and Trends
  • California Housing Market Graph 50 Years
  • Average Housing Prices by Year in the United States
  • Average Home Value Increase Per Year, 5 Years, 10 Years
  • How Much Did Housing Prices Drop in 2008?
  • Housing Market Crash 2008 Explained: Causes and Effects

Filed Under: Housing Market Tagged With: Florida Housing Market Graph 50 Years, Housing Market, Housing Market Graph

Housing Market Graph 50 Years: Showing Price Growth

August 27, 2025 by Marco Santarelli

Housing Market Graph 50 Years

The housing market graph for 50 years is more than just a chart; it's a fascinating story about the American dream, economic booms and busts, and the ever-changing forces that shape where we live. From the humble beginnings of around $20,000 in the 1960s to the head-spinning figures exceeding half a million today, the journey of U.S. home prices has been anything but boring.

Think of it like this: your grandparents probably tell you stories about how cheap things were “back in their day.” Well, they weren't kidding, especially when it comes to houses! But before we dive into the hows and whys of this incredible journey, let's break down the data and see just how much things have changed.

Chart: U.S. Home Price Growth Over 50 Years: A Rollercoaster Ride

Housing Market Graph 50 Years
Souce: FRED

The Numbers Don't Lie: A Look at the Housing Market Graph (50 Years)

Thanks to the diligent data collection of the U.S. Census Bureau and the U.S. Department of Housing and Urban Development, we have a clear picture of how average house prices have evolved over the past five decades. This information, compiled by the Federal Reserve Bank of St. Louis, forms the backbone of our housing market graph (50 years) analysis:

  • 1960s: The Era of Affordability – The average house price hovered around $20,000. Imagine buying a house with what some people spend on a new car today!
  • 1970s: Inflation Hits Hard – Prices started to climb, reaching around $50,000 by the decade's end. This period saw high inflation, which affected the price of everything, including homes.
  • 1980s: Steady Growth – The average price reached $100,000, a significant milestone. This was a time of relative economic stability and a growing middle class.
  • 1990s: A Bit of a Lull – The housing market graph 50 years shows a slight plateau, with prices hovering around $150,000. The early '90s recession played a role in this.
  • 2000s: The Boom and Bust – The early 2000s saw a dramatic surge in prices, peaking at an average of over $300,000 before the housing bubble burst in 2008, leading to a sharp decline.
  • 2010s-Present: The Road to Recovery and Beyond – Prices have steadily recovered, exceeding pre-2008 peaks and recently reaching over $500,000.

What Drives the Housing Market: Unpacking the “Why” Behind the Graph

Looking at the housing market graph for 50 years, it's clear that home prices haven't just gone up in a straight line. There have been periods of rapid growth, stagnation, and even decline. So, what are the key factors that have shaped these trends?

1. Interest Rates: The Price of Money

Interest rates are like the volume knob for the housing market. When rates are low, borrowing money is cheaper, leading to increased demand for homes and, you guessed it, higher prices. Conversely, high-interest rates make mortgages more expensive, cooling down the market and potentially causing prices to drop or stabilize.

2. Economic Growth: Jobs, Wages, and Confidence

When the economy is booming, people feel more secure in their jobs and have more disposable income. This often translates to increased home buying, further fueling demand and pushing prices up. On the flip side, economic downturns can lead to job losses and financial uncertainty, making people hesitant to buy homes and potentially causing a decline in prices.

3. Supply and Demand: The Never-Ending Tug-of-War

The fundamental principle of economics—supply and demand—plays a crucial role in the housing market. When there are more buyers than sellers (high demand, low supply), prices tend to rise. Conversely, when there are more sellers than buyers (low demand, high supply), prices may fall or stagnate.

4. Demographics: The People Factor

Population growth, migration patterns, and even the age distribution of a population can impact the housing market. For example, a surge in young adults entering the housing market can lead to increased demand, while an aging population might result in more homes being put up for sale.

5. Government Policies: A Helping Hand or a Heavy Hand?

Government policies, such as tax incentives for homebuyers or regulations on lending practices, can have a significant impact on the housing market. These policies can be implemented to encourage homeownership, stabilize prices, or address other economic concerns.

Lessons from the Past, Insights for the Future

The housing market graph (50 years) provides valuable lessons about the cyclical nature of real estate.

  • What goes up doesn't always go up forever. The housing bubble of the 2000s is a stark reminder that unsustainable growth can lead to painful corrections.
  • Multiple factors are always at play. Understanding the interplay of interest rates, economic conditions, and other factors is crucial for making informed decisions about buying or selling a home.
  • The market is always evolving. New trends, technologies, and societal shifts will continue to shape the housing market in unpredictable ways.

The Future of Housing: What Lies Ahead?

Predicting the future of the housing market is no easy task. However, by analyzing current trends and considering potential economic and societal shifts, we can make some educated guesses:

  • Affordability Concerns: As prices continue to rise faster than wages in many areas, affordability will likely remain a major concern. This could lead to increased demand for smaller homes, more people renting for longer periods, and a greater focus on affordable housing solutions.
  • The Rise of Technology: Technology is transforming how we buy, sell, and even experience homes. From virtual tours to online real estate platforms, technology is likely to play an even more prominent role in the future of the housing market.
  • Changing Demographics: The aging of the Baby Boomer generation, coupled with shifting migration patterns, could impact housing demand in different regions.

In Conclusion

The housing market graph (50 years) is a testament to the dynamic nature of real estate. Understanding the factors that have shaped the market over the past five decades can provide valuable insights for both homebuyers and sellers as they navigate the ever-evolving world of real estate. While predicting the future of housing is an impossible task, one thing is certain: the journey will continue to be full of twists, turns, and perhaps even a few surprises along the way.

Related Articles:

  • San Diego Housing Market Graph 50 Years: Analysis and Trends
  • Average Housing Prices by Year in the United States
  • Average Home Value Increase Per Year, 5 Years, 10 Years
  • How Much Did Housing Prices Drop in 2008?
  • Housing Market Crash 2008 Explained: Causes and Effects
  • Housing Market Predictions for Next 5 Years: 2025 to 2029
  • Housing Market Predictions for Next Year: Prices to Rise by 4.4%
  • Housing Market Predictions for the Next 4 Years: 2024 to 2028

Filed Under: Housing Market Tagged With: Housing Market, Housing Market Graph

Housing Market Shifts With Pandemic Boomtowns Leading in Price Drops

August 27, 2025 by Marco Santarelli

Housing Market Shift 2025: Pandemic Boomtowns Lead in Price Drops

Tired of hearing about sky-high housing prices? Well, there's good news! Pandemic boomtowns are leading the way in housing price cuts in 2025. According to Zillow, a whopping 26.6% of for-sale listings saw a price reduction this June, signaling a shift in the real estate market and potentially giving buyers a much-needed advantage.

Housing Market Shifts With Pandemic Boomtowns Leading in Price Drops

Why Are We Seeing Price Cuts Now?

Remember the frenzy of the pandemic? Everyone seemed to be moving. Remote work became the norm, and people flocked to cities offering more space, sunshine, and a lower cost of living. These “boomtowns” experienced rapid growth, driving up housing prices to dizzying heights.

However, as things normalize, the tide is turning. Several factors are contributing to this change:

  • Slowing Population Growth: The initial surge of people moving to these boomtowns is slowing down. The demand isn't as intense as it once was.
  • Affordability Ceilings: Let's face it, even with more space and sunshine, there's a limit to what people can afford. Rising mortgage rates and overall inflation are forcing many potential buyers to stay on the sidelines.
  • Increasing Inventory: The number of homes for sale is finally starting to rise. Suddenly, sellers are faced with competition, and they need to make their properties more attractive to buyers.

Where Are Prices Being Cut the Most?

According to recent data from Zillow, here's where you're most likely to find sellers slashing their prices:

  • Denver (38.3%)
  • Raleigh (36.4%)
  • Dallas (35.5%)
  • Nashville (35.5%)
  • Phoenix (35.5%)

Notice a pattern? These are all cities that experienced explosive growth during the pandemic. Now, they're adjusting to a more balanced market.

Are All Cities Seeing Declining Prices?

Not at all. Some markets are still relatively insulated from these price cuts. Cities with limited inventory and strong local economies are holding up better. These include:

  • Milwaukee (13.9%)
  • New York (15.6%)
  • Hartford (16.0%)
  • Buffalo (18.3%)
  • San Jose (22.1%)

In these areas, competition remains fierce because the supply of homes can't keep up with demand.

Which Cities Saw the Biggest Jump in Price Cuts?

Keep an eye on these metros, as they may be cooling down quickly:

  • Kansas City (+5 percentage points)
  • Buffalo (+3.9 percentage points)
  • Indianapolis (+3.8 percentage points)
  • Columbus (+3.3 percentage points)
  • Minneapolis (+3.2 percentage points)

What Does This Mean for Buyers?

If you're a home buyer, this is potentially great. After years of battling other buyers, you might finally have some leverage. Here's what to expect:

  • Fewer Bidding Wars: Say goodbye to the days of offering way over the asking price.
  • More Options: With more homes on the market, you'll have more to choose from.
  • More Time to Decide: You won't feel as rushed to make an offer. You can actually think through this decision.
  • Seller Concessions: Sellers might be willing to offer incentives like paying for some of your closing costs or even buying down your mortgage rate. Remember, these concessions might be back on the table due to an increase of inventory.

What Does This Mean for Sellers?

If you're a seller, it's time to get realistic. The days of easy sales are over. Now, you need to:

  • Price Competitively: Do your research and set a price that reflects current market conditions.
  • Market Your Home Well: High Quality photography is a must — Highlight the best features of your property and make it stand out.
  • Be Prepared to Negotiate: Don't be afraid to compromise to close the deal. Consult with your agent. As a homebuyer, a real estate agent is a must and the small commission fee is worth the headache.

My Thoughts as a Real Estate Enthusiast

I remember back in 2020 and 2021, you couldn't list a house without having multiple offers within hours. People were waiving inspections and paying cash just to get a foot in the door. It was exciting but also felt unsustainable.

Now, we're seeing a more rational market. While I don't expect prices to crash, I do think this rebalancing is healthy. It gives more people a chance to achieve the dream of homeownership.

The data from Zillow is a clear indicator that the housing market is shifting throughout the nation. The rate hikes by the Federal Reverse are also playing a vital role in a declining housing market. I believe that for people looking to enter the housing market, now may be the perfect time while mortgage rates are still at reasonable numbers. Although difficult to do, many will decide whether to purchase a home now or to wait until an anticipated “Crash” into the market.

All the data shows that the market is currently in favor of those looking to purchase something and it is likely that this trend will continue further. While some cities are still doing well, it is important to acknowledge that the times are changing. If you're planning to buy or sell, do your research and work with a knowledgeable real estate professional who can guide you through this new environment. In my opinion, patience and strategic planning will be key to success in the housing market of 2025.

Looking Ahead: While it's hard to predict the future, I expect to see more price cuts in the coming months. Affordability will continue to be a major challenge for many buyers, so sellers will need to adjust their expectations.

Invest in Real Estate in the Top U.S. Markets

Discover high-quality, ready-to-rent properties designed to deliver consistent returns.

Contact Norada today to expand your real estate portfolio with confidence.

Contact our investment counselors (No Obligation):

(800) 611-3060

Get Started Now 

Also Read:

  • Housing Market Predictions 2025 by Norada Real Estate
  • Housing Market Predictions 2025 by Warren Buffett's Berkshire Hathaway
  • Will the Housing Market Crash in 2025: What Experts Predict?
  • Housing Market Predictions 2026: Will it Crash or Boom?
  • Housing Market Predictions for the Next 4 Years: 2025 to 2029
  • 12 Housing Markets Set for Double-Digit Price Decline by Early 2026
  • Real Estate Forecast: Will Home Prices Bottom Out in 2025?
  • Real Estate Forecast Next 5 Years: Top 5 Predictions for Future
  • 5 Hottest Real Estate Markets for Buyers & Investors in 2025
  • Will Real Estate Rebound in 2025: Top Predictions by Experts
  • Will the Housing Market Crash Due to Looming Recession in 2025?
  • 4 States Facing the Major Housing Market Crash or Correction
  • New Tariffs Could Trigger Housing Market Slowdown in 2025
  • Real Estate Forecast Next 10 Years: Will Prices Skyrocket?

Filed Under: Housing Market, Real Estate Market Tagged With: Housing Market, Housing Market Trends, Housing Prices

Trump’s Section 8 Housing Cuts: Will Millions Face Homelessness?

August 26, 2025 by Marco Santarelli

Are you worried about losing your home? Many people are, especially those who rely on Section 8 housing. Trump's Section 8 Cuts proposed in his FY 2026 budget are causing serious concern. President Trump's proposal includes a 43% cut to HUD's rental assistance programs, and it introduces a two-year limit for able-bodied adults.

This is likely to impact over 4.4 million households, potentially increasing homelessness, and experts are worried. Let's dive into what these changes mean for you and your community.

The anxiety I'm seeing amongst families relying on rental assistance isn't just abstract fear; it represents the very real possibility of being pushed into the streets. We need to examine this proposal critically to understand its potential ramifications.

Trump’s Section 8 Housing Cuts: Will Millions Face Homelessness?

Why is Section 8 Housing in the News?

It's all thanks to Trump's FY 2026 budget proposal, which suggests big changes to the program officially known as the Housing Choice Voucher Program. This program helps low-income families, the elderly, and people with disabilities afford rent by subsidizing a portion of their rent payments.

It's a crucial safety net, preventing homelessness and providing stability. With Trump's proposal facing scrutiny, people are naturally searching for answers to know about its impacts, leading it to become a trending topic on news and social media platforms.

Proposed Changes: What's on the Table?

Chart showing Trump's proposed 43% cut to section 8 housing funding

Okay, so what exactly is being proposed? The core of the issue lies in the massive budget cuts outlined by Trump. Let’s break it down:

  • 43% Cut to HUD’s Rental Assistance: The budget proposes slashing funding from $58.5 billion to $31.8 billion. This affects not just Section 8, but also public housing, project-based assistance, and programs for retirees and individuals with disabilities. That's almost $27 billion in rental assistance alone going away.
  • Two-Year Limit for Able-Bodied Adults: This is a big one. If you are considered an “able-bodied” adult – meaning no disability preventing work – you will only receive assistance for two years. After that, it’s assumed you can be self-sufficient. Personally, I find this assumption incredibly problematic. The job market isn't always forgiving, and two years might not be enough to gain stable employment in today's economy.
  • State Rental Assistance Block Grant System: The proposal wants to hand over the reins to the states through something called the SRABG. The idea is for states to manage the aid based on their “unique needs”. While in theory, empowering states might sound good, I've seen firsthand discrepancies in how different states handle social programs. The end result could be inequalities in access to, and quality of, assistance, depending on what state you live in. I wonder what kind of accountability and oversight would exist under this system.

The following tables summarize the proposed changes and potential effects:

Aspect Details
Proposed Cut to HUD Funding 43%, reducing from $58.5 billion to $31.8 billion
Programs Affected Section 8, public housing, project-based assistance, programs for disabled
New Policy Two-year limit on aid for able-bodied adults
Funding Mechanism Shift to State Rental Assistance Block Grant (SRABG)
Current Beneficiaries Over 4.4 million households


Potential Impact Details
At Risk Nationwide Over 3.8 million people, including families, veterans, elderly, disabled
New York City Impact Could affect 300,000 Section 8 or public housing residents, potential evictions
Advocate Concerns States may not fill gaps, risk of increased homelessness

The Ripple Effect: Who Gets Hurt?

These changes aren’t just numbers; they’re about real people’s lives. It's important to step back and understand the real-world consequences of these policies. I would say millions of people are at risk.

  • Potentially Affecting Over 4.4 Million Households: This is a staggering number. That's nearly half the cities and towns across America at risk of losing the aid. A substantial cut in rental assistance on top of these households that rely on the aid translates to potential loss of housing for millions of people.
  • Increased Homelessness: The biggest fear is obviously increased homelessness. The National Low Income Housing Coalition warns that if these cuts go through, we could see a drastic rise in the number of people living on the streets.
  • High-Cost Areas Will Suffer More: In cities like New York, where housing costs are already sky-high, 300,000 residents could face eviction. This isn't just about individuals or families; it affects entire communities. A surge in homelessness could overload social services, strain local economies, and lead to increased crime.

Focusing on Veterans and the Disabled

It sounds nice in theory, but is it really beneficial? There’s a lot of debate about the 43% cuts to Section 8 to prioritize veterans, the disabled amongst others. The administration is keen on ensuring the welfare of veterans and disabled individuals. I won't lie, I do appreciate that.

  • National Center for Warrior Independence: An executive order established this center with the aim of housing 6,000 homeless veterans by 2028. The idea is to use Section 8 vouchers to support them. I think that's a great thing.
  • Prioritizing Deserving Cases: The argument is that Section 8 should be a “lifeline” for those who truly need it.

The Great Debate: Self-Sufficiency vs. Safety Net

This is where things get really heated. There’s a huge divide in opinions on this. It's not just about politics but also about different philosophies about how we should care for one another.

Those in favor of the cuts often say things like:

  • “Section 8 shouldn’t be a lifestyle, it should be a lifeline.”
  • “People need to get up, grind, and earn it.”

The opposing side is equally vocal:

  • “We would see homelessness escalate in a way that has been really unprecedented.”
  • “This is not fixing anything; this is making everything so much worse.”

My Two Cents

Well, I believe these proposed cuts are not only misguided but are downright harmful. While I agree that promoting self-sufficiency is important, abruptly cutting off assistance to vulnerable populations is not the answer.

Two years is simply not enough time for many people to get back on their feet. A more sensible approach would be to invest in job training programs and support services that help people transition to independence gradually. We must ensure their security.

Moreover, shifting the burden to the states is risky. States have varying resources and priorities. A federal safety net ensures a basic level of protection for everyone, regardless of where they live.

Let's keep a close eye on this situation. We all have a voice. Contact your representatives, support organizations that advocate for affordable housing, and most importantly, remain engaged.

“Invest in Turnkey Real Estate in 2025”

With proposed Section 8 housing cuts potentially putting millions at risk, stable rental markets with strong demand are more critical than ever.

Norada offers turnkey, professionally managed properties in high-demand areas—helping you support communities while building reliable income.

HOT NEW LISTINGS JUST ADDED!

Speak with a Norada investment counselor today (No Obligation):

(800) 611-3060

Get Started Now

Read More:

  • Top Reasons Behind the End of the Trump-Musk Alliance in 2025
  • What is Trump's Plan for Privatizing Fannie Mae and Freddie Mac?
  • Elon Musk's $10,000 Homes: A Game Changer for the Housing Market?
  • Elon Musk Calls for Major Reforms at the U.S. Federal Reserve
  • Can Elon Musk Revolutionize Affordable Housing for Americans?
  • Emergency Price Relief on Housing: What Does Trump's Order Mean?
  • Trump's Inaugural Speech: Bold Plans on Border, Economy, and More
  • What Happens to Kamala Harris' Proposal of $25,000 Homebuyer Assistance Now?
  • Housing Market Predictions for 2025 if “Trump” Wins Election
  • 10 Housing Market Predictions Under Trump for the Next 4 Years
  • Will Donald Trump's Victory Reshape the Housing Market in 2025?
  • Trump vs Harris: Housing Market Predictions Post-Election
  • 10 Housing Market Predictions Under Trump for the Next 4 Years
  • Will Donald Trump's Victory Reshape the Housing Market in 2025?

Filed Under: Housing Market Tagged With: Housing Choice Voucher Program, Housing Market, HUD, Section 8 Housing

Housing Market Trends 2025: Buyers Need $200K More Than 10 Years Ago

August 25, 2025 by Marco Santarelli

Housing Market Trends 2025: Buyers Need $200K More Than 10 Years Ago

Are you thinking about buying a home? You've probably heard whispers about a shift in the market. So, are we really heading towards a buyer's market? The short answer is yes, but it's complicated. Data from Cotality shows we're in a weird spot where the conditions should favor buyers, but high costs are keeping many on the sidelines. It's like a sale where everything is 50% off, but you still can't afford it.

In other words, we're seeing a transition from a seller's market to a buyer's market, but high prices and interest rates are keeping many potential buyers on the sidelines.

Okay, that's the headline. Now, let's dive into the nitty-gritty and figure out what's really going on and what it means for you, whether you're looking to buy, sell, or just understand the market.

Housing Market Trends 2025: Buyers Need $200K More Than 10 Years Ago

Home Sales: A Market in Transition

For the past few years, sellers have been sitting pretty. Homes were flying off the market, often with multiple offers above the asking price. But things are changing. We're starting to see signals that the tide is turning, and buyers are gaining more power. The key thing to watch is the relationship between the number of homes available (inventory) and whether home prices are falling. More choices for buyers usually mean they have more room to negotiate.

It is a tricky thing to navigate, though. A lot of people are hesitant and don't know what to do with that shift. It's important to be as informed as possible and to speak with people who are experts.

Housing Supply: More Homes, Fewer Buyers?

One of the biggest shifts we're seeing is in the housing supply. The number of homes for sale is going up in many areas. Check out these eye-popping increases in some cities:

  • Toledo, Ohio: Up a whopping 128%
  • Savannah, Georgia: A significant 108% increase
  • Florida: Many areas are seeing inventories rise by over 50%

Here's a table summarizing these changes in the top markets:

Metro Area Active Inventory Sales Days on Market Median Price Change Sold Above Asking Median Price
Toledo, OH 128% -18% 5% 8% -32% $210,000
Savannah, GA 108% -15% 31% 4% -42% $364,000
Washington-Arlington-Alexandria, DC-VA-MD-WV 58% -14% 29% 5% -35% $630,000
Naples-Immokalee-Marco Island, FL 58% -29% 19% -15% -55% $615,000
Cape Coral-Fort Myers, FL 55% -18% 15% -7% -39% $380,000
Las Vegas-Henderson-Paradise, NV 50% -22% 14% 2% -45% $450,000
Asheville, NC 44% -24% 46% -2% -52% $440,000
Stockton-Lodi, CA 40% -17% 32% 2% -39% $540,000
Silver Spring-Frederick-Rockville, MD 36% -16% 33% -3% -38% $602,000
Charlotte-Concord-Gastonia, NC-SC 31% -11% 54% 3% -35% $421,050
Daphne-Fairhope-Foley, AL 31% -1% 15% -3% -8% $385,000
Sacramento–Roseville–Arden-Arcade, CA 31% -20% 11% 2% -41% $587,500
Fort Smith, AR-OK 31% -24% 8% 11% -18% $224,000
Albany-Schenectady-Troy, NY 30% -25% 0% 3% -21% $325,000
Houston-The Woodlands-Sugar Land, TX 28% -10% 8% 0% -26% $348,300
Virginia Beach-Norfolk-Newport News, VA-NC 27% -19% 7% 6% -30% $367,000
Boise City, ID 26% 4% 4% 2% -15% $507,500
Los Angeles-Long Beach-Glendale, CA 26% 13% 37% 1% -14% $925,000
Salisbury, MD-DE 25% -24% 70% -2% -60% $415,000
Portland-Vancouver-Hillsboro, OR-WA 24% -14% 30% 1% -22% $565,000
Claremont-Lebanon, NH-VT 23% -1% 4% 5% -13% $400,000
Killeen-Temple, TX 22% -14% -3% -4% -27% $267,500
Miami-Miami Beach-Kendall, FL 21% -37% 13% 7% -65% $580,000
Lancaster, PA 20% 4% 0% 6% 11% $339,500
Richmond, VA 20% -12% 2% 2% -22% $408,000

Source: Cotality, 2025

But here's the catch: even with more homes available, they're sitting on the market longer. The number of days a home stays on the market has risen by double digits compared to last year. While this gives buyers more time to consider their options, it also means deals aren't closing as quickly.

Are Home Prices Dropping? The Price Pinch

Now, let's talk about the big question: Are home prices dropping? The answer is a bit complicated. Some sellers are reducing their prices to attract buyers. In May, around 56% of homes sold for below the asking price. This is a much higher percentage than we've seen in the past five years.

However, homebuyers need an extra $200,000 to purchase a median-priced home compared to ten years ago. Ouch! This makes it tough, especially for first-time buyers who are already struggling with rising rents.

Impact of High Mortgage Rates

High mortgage rates have been a major factor in slowing down the market. With rates hovering around 6.58% for a 30-year fixed mortgage (as of 08/21/2025 – Freddie Mac), it's simply more expensive to borrow money. This has a direct impact on affordability and keeps many potential buyers out of the market.

  • 30-year fixed mortgage rate: ~6.58%
  • 15-year fixed mortgage rate: ~5.69%

While rates have come down slightly over the summer, many buyers are still waiting for them to drop further before making a move. Experts predict that the 30-year fixed-rate mortgage will likely end 2025 somewhere between 6.0% and 6.5%.

Is It a Buyer's or Seller's Housing Market?

So, is it a buyer's or seller's housing market? Technically, we're leaning towards a buyer's market, but with an asterisk.

  • Buyer's Market (kind of): More inventory gives buyers more choices and negotiating power. They can ask for price reductions, help with closing costs, or even mortgage rate buydowns.
  • But…: High prices and interest rates are still a significant hurdle. Many people simply can't afford to buy, even with the slight advantage buyers have right now.

Market Trends: A Closer Look at Specific Areas

The market isn't the same everywhere. Some areas are seeing bigger shifts than others. According to Cotality:

  • Texas and Florida: These states have seen the largest year-over-year increases in inventory. Cities like Naples and Cape Coral in Florida have seen active inventories jump by over 50%.
  • Los Angeles and Washington D.C.: More homes in these cities are selling below the asking price, offering a rare opportunity for buyers, even though prices remain high.

Unsticking the Future: What's Next?

For years, the housing market has been stuck in a stalemate. Owners have stayed put thanks to low interest rates, and rising prices have made it difficult for new buyers to enter the market. But things are starting to change.

People are moving for various reasons: new jobs, growing families, retirement, and other life changes. While buyers have a better chance of finding deals, challenges remain.

Cotality experts predict that home prices will increase by 4.2% by June 2026, even if interest rates stay steady. This means that while buyers have some negotiating power now, external factors might continue to limit both buyers and sellers, potentially weakening the market in the future.

Daniel Boswell, Senior Economist at Cotality, points out that this market primarily benefits those with available cash. He notes that, despite the presence of affordable pockets across the country, significant obstacles persist for most families. These include elevated mortgage rates and increasing insurance premiums.

My Take: Patience and Preparedness are Key

In my opinion, the current market requires a lot of patience and preparation. If you're a buyer, don't rush into anything. Take your time to find the right home and negotiate the best possible deal. If you're a seller, be realistic about pricing and be prepared to make concessions.

Ultimately, the housing market is always changing. The key is to stay informed, work with a trusted real estate professional, and make decisions that are right for your individual circumstances. Don't get caught up in the hype or the fear. Do your homework, and you'll be in a much better position to navigate this complex market.

Invest in Real Estate in the Top U.S. Markets

Discover high-quality, ready-to-rent properties designed to deliver consistent returns.

Contact Norada today to expand your real estate portfolio with confidence.

Contact our investment counselors (No Obligation):

(800) 611-3060

Get Started Now 

Also Read:

  • Housing Market Rebounds: Home Sales Tick Up in July 2025
  • Housing Market Shift 2025: Pandemic Boomtowns Lead in Price Drops
  • Housing Market Predictions 2025 by Norada Real Estate
  • Housing Market Predictions 2025 by Warren Buffett's Berkshire Hathaway
  • Will the Housing Market Crash in 2025: What Experts Predict?
  • Housing Market Predictions 2026: Will it Crash or Boom?
  • Housing Market Predictions for the Next 4 Years: 2025 to 2029
  • 12 Housing Markets Set for Double-Digit Price Decline by Early 2026
  • Real Estate Forecast: Will Home Prices Bottom Out in 2025?
  • Real Estate Forecast Next 5 Years: Top 5 Predictions for Future
  • 5 Hottest Real Estate Markets for Buyers & Investors in 2025
  • Will Real Estate Rebound in 2025: Top Predictions by Experts
  • Will the Housing Market Crash Due to Looming Recession in 2025?
  • 4 States Facing the Major Housing Market Crash or Correction
  • New Tariffs Could Trigger Housing Market Slowdown in 2025
  • Real Estate Forecast Next 10 Years: Will Prices Skyrocket?

Filed Under: Housing Market, Real Estate Market Tagged With: Housing Market, Housing Market Trends, Housing Prices

SF Bay Area Housing Market Cools: Sales Plunge, Prices Stay Stagnant

August 23, 2025 by Marco Santarelli

SF Bay Area Housing Market Cools: Sales Plunge, Prices Stay Stagnant

Yes, you read that right. The San Francisco Bay Area experienced the largest regional decline in sales in California, with a 4.1 percent drop compared to last year. This news might have you wondering what's happening with the real estate market in one of the most desirable places to live. Let's break down the latest data and what it means for buyers and sellers.

SF Bay Area Housing Market Cools: Sales Plunge, Prices Stay Stagnant

Home Sales

Across California, home sales are down, but the Bay Area is feeling the pinch more than other regions. According to the California Association of Realtors (C.A.R.), existing, single-family home sales in California totaled 261,820 in July 2025, a 4.1% decrease from July 2024. While other regions like Southern California (-1.7%) and the Central Valley (-1.5%) saw declines, the San Francisco Bay Area's 4.1% dip was the most significant.

Here's a quick look at how different regions in California fared in July 2025:

Region Sales YTY% Chg
Far North 4.8%
Central Coast 1.7%
San Francisco Bay Area -4.1%
Southern California -1.7%
Central Valley -1.5%

Within the Bay Area, several counties experienced sales declines: Alameda (-7.4%), Marin (-13.2%) and Santa Clara (-8.7%). However, San Mateo bucked the trend, with a 12.2% increase in sales. Napa and Sonoma counties also saw positive YOY growth.

Home Prices

Are Home Prices Dropping?

While the San Francisco Bay Area’s median home price remained unchanged year-over-year, at $1,300,000, the price actually dipped from June 2025’s median of $1,400,000. This 7.1% decrease month-over-month suggests that the market is cooling off a bit in response to lower demand.

Across California, the median home price in July 2025 was $884,050, which is down 0.3% from July 2024. Prices have been trending slightly downward for the last 3 months. While a small decrease, it's a sign that the previously relentless rise in home prices might be slowing down.

Housing Supply

One factor influencing the market is the increasing housing supply. The Unsold Inventory Index (UII), which measures how long it would take to sell all homes on the market at the current sales rate, was 3.7 months in July 2025, up from 2.9 months in July 2024. This means there are more homes available for sale, giving buyers more options and potentially reducing competition.

Total active listings were up a whopping 37.7% from a year ago, reaching a 69-month high. That said, the pace of growth in total active listings decelerated for the third straight month, hitting its lowest rate in seven months.

In the San Francisco Bay Area, the UII stands at 2.7 months, up from 2.0 months last year.

Is It a Buyer's or Seller's Housing Market?

With increasing inventory and slightly declining prices, the market is starting to shift away from being a strong seller's market. It's not quite a buyer's market yet, but buyers are gaining a bit more leverage. Homes are staying on the market longer, and there's more room for negotiation.

The median number of days it took to sell a California single-family home was 28 days in July, up from 20 days in July 2024. The statewide sales-price-to-list-price ratio was 98.5 percent in July 2025 and 100 percent in July 2024, indicating that homes are more often selling for slightly below the asking price.

Market Trends

Several factors are contributing to these trends:

  • High mortgage rates: Although rates have slightly decreased since last year, they are still high enough to deter many potential buyers, especially first-time homebuyers.
  • Economic uncertainty: Concerns about the overall economy can make people hesitant to make big financial decisions like buying a home.
  • Seasonal slowdown: The summer months often see a slight dip in real estate activity.

Impact of High Mortgage Rates

Currently, U.S. weekly averages as of 08/21/2025, the average 30-year fixed mortgage rate is around 6.58% and 15-Yr FRM is about 5.69%, according to Primary Mortgage Market Survey® by Freddie Mac. This is higher than what we saw in previous years, significantly impacting affordability. Even slight fluctuations in mortgage rates can significantly affect a buyer's monthly payment and overall purchasing power.

According to various forecasts, the 30-year FRM rate will end 2025 between 6.0 to 6.5 percent.

The following table will show you how it affects a buyer.

Loan Amount Interest Rate Monthly Payment (Principal & Interest)
$800,000 6.0% $4,797.19
$800,000 6.58% $5,066.64
$800,000 7.0% $5,321.17

As you can see, a one-percent increase in interest rate can cost you hundreds of dollars a month!

My Thoughts

Having watched the Bay Area real estate market for years, I've seen its incredible resilience. It's a desirable place, and demand will likely bounce back eventually. However, the current situation presents both challenges and opportunities.

For sellers, it's crucial to be realistic about pricing. Overpricing can lead to your home sitting on the market for longer than expected. Work with a knowledgeable real estate agent who understands the local market dynamics to determine the right price. Buyers, on the other hand, have a bit more breathing room. Take your time, explore different neighborhoods, and don't be afraid to negotiate. The combination of increased inventory and slightly lower prices means you might just find the right home at a better price than you would have a year ago.

Don't rush the process! Take advantage of this time to secure good financing by speaking to multiple lenders. The market can shift again, and it is best to be prepared.

Ultimately, real estate is a long-term investment. Whether you're buying or selling, it's important to do your research, understand the market conditions, and make decisions that align with your individual financial goals and circumstances.

Invest in Turnkey Rental Properties

Discover high-quality, ready-to-rent properties designed to deliver consistent returns.

Contact us today to expand your real estate portfolio with confidence.

Contact our investment counselors (No Obligation):

(800) 611-3060

Get Started Now 

Also Read:

  • Bay Area Housing Market Sees a Big Decline in Home Sales
  • Bay Area Housing Market: Prices, Trends, Forecast 2025
  • Bay Area Housing Market Predictions 2030
  • Is the San Francisco Housing Market Heating Up in 2025?
  • San Francisco Housing Market Crash 2025: Will it Happen?
  • Bay Area Housing Market Soars With Largest Gain in Home Sales
  • Bay Area Housing Market Forecast for the Next 2 Years: 2025-2026
  • Bay Area Housing Market: What Can You Buy for Half a Million?
  • Bay Area Home Prices Skyrocket: Wealthy Buyers Fuel Market
  • Bay Area Housing Market Booming! Median Prices Hit Record Highs
  • Most Expensive Housing Markets in California
  • SF Bay Area Housing Market Records 19% Sales Growth in July 2024
  • Bay Area Housing Market Heats Up: Home Prices Soar 11.9%

Filed Under: Housing Market, Real Estate Market Tagged With: Bay Area, california, Housing Market

Will the Housing Market Crash in 2025: Expert Forecast

August 22, 2025 by Marco Santarelli

Will the Housing Market Crash in 2025: What Experts Predict?

I constantly hear the question that weighs heavily on the minds of so many: Will the housing market crash in 2025? It’s a valid concern, especially after the roller-coaster ride we've all been on. My definitive answer is no, I do not believe the housing market will crash in 2025.

Instead, I see a market rebalancing, becoming more accessible for certain buyers, but ultimately not succumbing to a dramatic collapse. We're looking at a continued, slow shift rather than a sudden plunge. Let me explain why I feel this way, pulling back the curtain on what the pros are predicting and adding my own two cents from years of observation and practical experience.

Will the Housing Market Crash in 2025: Expert Forecast

For many years now, the idea of a housing market “crash” has become almost mythical, often conjuring images of the 2008 financial crisis. I understand why people are so sensitive to this term. That period left deep scars, altering how an entire generation views homeownership and financial stability.

But what I've learned, and what I constantly remind people, is that this isn't 2008. Today's market is built on different foundations, with stronger lending standards, significant homeowner equity, and a persistent supply shortage that acts as a fundamental floor for prices. When I look at the data and consider the real people I work with every day, I see resilience, not fragility.

So, while the headlines might still try to sensationalize every dip, I encourage you to look deeper with me. Let's break down what the major players in the real estate world are expecting for 2025 and why their nuanced predictions paint a picture far removed from a “crash.”

The Forecasters Weigh In: A Look at the Leading Predictions

Different organizations approach market forecasting with slightly different lenses, but when you put their insights together, a clearer picture emerges. I always find it fascinating to see where they converge and where they diverge, because those differences often highlight the specific factors they prioritize.

NAR's Optimistic View: Brighter Days Ahead, Says Lawrence Yun

Lawrence Yun, the Chief Economist for the National Association of REALTORS® (NAR), has a consistently optimistic outlook, and his recent comments at the 2025 REALTORS Legislative Meetings echoed this sentiment. He talks about “brighter days on the horizon,” and from my perspective, this optimism stems largely from the anticipated movement in mortgage rates. He views lower rates as a “magic bullet,” and I can absolutely see why. Even small dips in rates can unlock affordability for many, bringing dormant buyers back into the fold.

Here’s a snapshot of what NAR is predicting for 2025 and beyond:

  • Existing Home Sales: Yun expects a 6% rise in 2025, which he sees accelerating to an 11% climb in 2026. This is a significant recovery in activity after quieter years, and it suggests people will start feeling more comfortable making moves.
  • New Home Sales: He projects a 10% increase in 2025, followed by another 5% in 2026. New construction is so important right now, as it’s the primary way to chip away at our long-standing housing shortage. I truly believe we need more homes built, plain and simple.
  • Median Home Prices: NAR forecasts continued modest growth, with prices rising 3% in 2025 and 4% in 2026. This isn't the double-digit appreciation we saw during the pandemic boom, but it's growth, indicating a healthy market, not a crashing one.
  • Mortgage Rates: This is the big one for NAR. Yun anticipates rates averaging around 6.4% in the second half of 2025, dipping further to 6.1% in 2026. If this holds true, it would be a huge sigh of relief for many first-time buyers I talk to.

Zillow's Cautious Outlook: A Gentle Drift Downward

Zillow, with its deep dive into home values and rental data, offers a slightly more subdued, almost lukewarm forecast. While they don't predict a crash, their outlook suggests a small downward adjustment in home values and a continued, but slow, recovery in inventory. I see Zillow's perspective as one that truly highlights the continued affordability challenges and the ongoing shifts within the market.

Key points from Zillow’s latest forecast:

  • Home Values: Zillow expects typical home values to drift down slightly, ending 2025 about 2% below where they started the year. This is a larger decline than their previous forecast, which tells me they’re seeing some continued market softening.
  • Inventory Recovery: This is a big theme for Zillow. They predict inventory will continue to grow significantly, potentially approaching pre-pandemic levels by the end of 2025. This is fueled by new listings outpacing sales. I’ve seen this personally in some areas; more homes on the market means more choices for buyers.
  • Existing Home Sales: They anticipate 4.16 million existing home sales by the end of 2025, a modest 2.5% improvement over the previous year. This suggests a very slow uptick in transaction volume.
  • Rent Growth: Zillow notes a softening in rent growth for both single-family and multifamily units. This is interesting because rising for-sale inventory gives more options, which takes pressure off rents. They project single-family rents to rise 2.75% in 2025 (down from 4.5% in 2024) and multifamily rents to increase by just 1.3% in 2025 (down from 2.4% in 2024). This tells me that people are finding more negotiating power on the rental front.

Realtor.com's Rebalancing Act: A Shift Towards Buyers

Realtor.com’s 2025 forecast focuses heavily on the idea of the market “rebalancing,” with market power shifting towards buyers. This aligns with what I'm seeing on the ground as well: an easing of the frantic competition that characterized the last few years. While their numbers might seem a bit conservative compared to NAR, I think their emphasis on the buyer's increasing leverage is spot on.

Here’s a detailed look at Realtor.com’s projections for 2025:

Key Housing Indicators (Realtor.com) 2025 Forecast REVISED 2024 Historical Data 2013-2019 Historical Average
Mortgage Rates (avg) 6.7% 6.7% 4.0%
Mortgage Rates (year-end) 6.4% 6.7% N/A
Existing Home Median Price App. (Y/Y) +2.5% +4.5% +6.5%
Existing Home Sales (Y/Y) -1.5% -0.6% +2.1%
Annual Total Existing Home Sales 4.00 million 4.06 million 5.28 million
Existing Home For-Sale Inventory (Y/Y) +16.9% +15.2% -3.6%
Single-Family Housing Starts (Y/Y) -3.7% +6.9% N/A
Single-Family Housing Starts (Annual) 0.98 million 1.0 million 0.8 million
Homeownership Rate 65.2% 65.6% 64.2%
Rent Growth -0.1% -0.2% +5.2%

Realtor.com highlights several key trends for 2025:

  • Home Sales Steady: They expect sales to land at 4 million in 2025, just slightly behind 2024. This suggests a continued slow pace, not a sudden drop.
  • Price Growth Softens: Home prices will still climb, but their report forecasts a softer growth of +2.5%. This is a noticeable slowdown from previous years, and what I see as a healthy correction in many areas.
  • Mortgage Rates Ease Slowly: While the annual average for mortgage rates is expected to match 2024 at 6.7%, they anticipate a dip to 6.4% by year-end. This slow, gradual dip is crucial. As Realtor.com points out, even a quarter-percentage point drop on a $350,000 loan can mean nearly $70 in monthly savings – that's real money for a family.
  • Rental Market Attractiveness: Renting continues to be an attractive option, with rent growth softening and easing for 23 straight months. This creates a fascinating dynamic where, in many markets, renting is significantly more affordable than buying a starter home. I’ve heard countless stories from potential buyers who are simply opting to rent longer to stay on budget.

Synthesizing the Data: What I See on the Ground

When I look at these forecasts together, a common thread emerges, despite some numerical differences: none of them predict a crash. What they do predict is something far more nuanced and, in my opinion, healthier: a market that is slowly but surely finding its balance.

Here’s my take:

  • No Crash, Just a Rebalancing: The consensus is clear: we won't see a collapse in home values like in 2008. Instead, what NAR calls “brighter days,” Zillow calls a “drift down,” and Realtor.com calls a “rebalancing” all point to a market where the frantic bidding wars are less common, and buyers have a bit more breathing room. From what I’m observing, this means offers with contingencies are more accepted, and sellers are more open to negotiation.
  • Mortgage Rates are the Linchpin: All three outlooks emphasize how critical mortgage rates are. NAR sees them as the “magic bullet,” while Zillow and Realtor.com anticipate a slow easing. I agree with Yun: if rates move sustainably lower, it will significantly boost sales. The psychological impact of rates, coupled with the actual financial burden, cannot be overstated. I've seen so many hopeful buyers on the sidelines, just waiting for that affordability threshold to be met by a lower rate.
  • Inventory is Key, but Regional Differences Persist: Zillow and Realtor.com both stress the continued recovery of inventory. More homes for sale means less competition and more buyer choice, which helps put downward pressure on prices or at least slows their growth. However, based on my local market observations, this inventory rebound isn't happening uniformly across the country. Markets in the Northeast and Midwest, for instance, still feel incredibly tight, making them consistently “hotter” than some areas in the South and West where supply has recovered more robustly. This is why it’s critical to remember that “the national market” is really a mosaic of hundreds of local markets. What applies in Dallas might not apply in Boston.
  • Affordability Remains a Challenge: Even with softening prices or slower growth, the underlying issue of affordability is still a huge hurdle for many. Realtor.com’s data showing renting still overwhelmingly cheaper than buying a starter home in almost every metro area (except Pittsburgh, interestingly!) speaks volumes. I worry about the long-term implications for younger generations and first-time buyers who are finding it harder and harder to break into homeownership. This isn't a market on the verge of collapse, but it is one that's struggling with access for a significant portion of the population.

Deep Dive into Key Market Influencers

Understanding the big picture means digging into the details that shape it. The housing market isn't a single switch; it's a complex machine with many moving parts.

Mortgage Rates: The “Magic Bullet” or Persistent Hurdle?

I truly believe mortgage rates are the most impactful factor in today's housing market. During the pandemic, ultralow rates fueled a frenzy. When rates shot up, the market effectively froze for many. The idea that rates could be a “magic bullet,” as NAR's Yun suggests, rings true because even small dips can create significant monthly savings. For example, Realtor.com illustrated that a quarter-percentage point drop can save roughly $70 a month on a $350,000 loan. That $830 a year might not sound like a fortune, but for a family on a tight budget, it can mean the difference between qualifying for a mortgage and staying on the sidelines.

The Federal Reserve plays a huge role here. Their policy decisions on interest rates, while not directly controlling mortgage rates, heavily influence them. Realtor.com notes that the Fed has kept its policy rate steady after dropping it in late 2024, providing some stability. My take is that while the economy's resilience helps, concerns about potential inflation (like from tariffs) and a growing national debt create a floor under how low mortgage rates can really go in the short term. We're looking at slow, gradual declines, not a sudden plummet to 3%.

Inventory: The Supply Shortage Saga

For years, I’ve been talking about the chronic undersupply of homes in the U.S. It’s a structural issue that has plagued our market for over a decade. Zillow and Realtor.com both predict continued inventory recovery, with listing activity outpacing sales. This increased supply is good news for buyers, as it means more options and less intense competition. We saw too many buyers chasing too few homes for too long, leading to stretched prices.

However, there's an interesting counter-trend highlighted by Realtor.com: “delistings.” These are homes taken off the market without a sale. Some sellers are choosing to wait rather than lower their prices to meet the current market reality. This is a fascinating human element – the emotional attachment to a home's perceived value. If this trend of delistings continues or accelerates, it could slow down the inventory recovery, dampening the buyer-friendly momentum we're starting to see. It's a reminder that market dynamics are also driven by individual choices.

Affordability: The Real Pain Point

This is where the rubber meets the road for most people. High prices combined with high interest rates have made homeownership feel out of reach for a significant portion of potential buyers. While price growth is expected to slow, affordability metrics remain stubbornly high.

Consider the data from Realtor.com:

  • In June 2025, Pittsburgh, PA, was the only metro where buying a starter home was more affordable than renting. That statistic alone speaks volumes about the challenge.
  • Rent growth is expected to stay muted or even decline slightly, making renting an increasingly attractive and budget-friendly option in the short term. This makes sense: if you can save $50 a month by renting compared to buying, and interest rates are still intimidating, why jump in?

This ongoing affordability crisis, for me, is the true challenge of the current housing market. It's not about a crash, but about access. If homeownership rates continue to slip, especially among younger households, it has profound long-term implications for financial well-being and wealth building.

The Job Market and Economy: A Resilient Foundation

One fundamental difference between today and 2008 is the strength of the job market. Both Zillow and Realtor.com acknowledge that a relatively plentiful job market and steady inflation have created a solid foundation for housing activity. The unemployment rate has remained low (even dipping to 4.1% in June data, according to Realtor.com), and inflation has largely stayed within the Fed's target range. This economic stability, while not exciting, is crucial. People need steady jobs and predictable costs to feel secure enough to consider a major purchase like a home. If people are employed, they can pay their mortgages. It’s a simple but powerful truth.

Policy Changes: Navigating the “One Big Beautiful Bill Act”

Policy can absolutely influence the housing market, sometimes in unexpected ways. Realtor.com touched on the “One Big Beautiful Bill Act” and its impact on the State and Local Tax (SALT) deduction. This change, allowing homeowners in high-tax states to deduct up to $40,000 from their income (up from $10,000), is a welcome relief for some.

I've worked with clients who've been directly impacted by the previous SALT cap, so I know this will make a difference for them, easing some of the tax burden that adds to housing costs.

However, it's not a silver bullet for the entire housing market's challenges. As Realtor.com aptly notes, it doesn't address everything, like the outdated capital gains tax exclusion for housing. In my opinion, real legislative focus needs to be on incentivizing more home building, simplifying regulations, and addressing the core affordability crisis.

Industry Distractions: Maintaining Focus on Core Issues

The real estate industry has seen its share of internal shifts lately, from the NAR settlement discussions to ongoing debates about multiple listing options and clear cooperation rules. While these are important for the industry itself, Realtor.com points out that these “distractions” can pull focus away from the more fundamental goal: building more homes.

And I wholeheartedly agree. As an agent, navigating these changes is part of my job. But as someone looking at the market's health, I believe the industry and policymakers need to keep their eyes on the prize: increasing supply and making homeownership more attainable for everyone. Without that, we’re just rearranging the deck chairs while the underlying challenges persist.

Regional Differences: It's Not One Market

I cannot stress this enough: the housing market is not a monolithic entity. What you read in a national forecast is an average, and averages can hide vastly different local realities.

  • Hotter Markets: As Realtor.com highlights, areas in the Northeast and Midwest, where inventory recovery has lagged, continue to see homes sell quickly and remain “hotter.” If you're buying there, you might still face competition.
  • Cooler Markets: Conversely, some areas in the South and West that saw massive population booms and rapid new construction are now seeing larger inventory increases and more significant price adjustments. Zillow's prediction of a 2% national value decline is likely driven by these more rebalancing markets.

My advice? Don’t let a national headline dictate your local strategy. Work with a knowledgeable local agent who lives and breathes your specific market. They'll tell you what’s really happening on your block, not just across the country.

Final Thoughts:

So, will the housing market crash in 2025? Based on all the data, my personal experience, and how I read the tea leaves, the answer is a resounding no. What we're witnessing is a market undergoing a necessary and, frankly, healthy correction. The unsustainable boom years are behind us, and we're moving towards a more balanced, albeit still challenging, environment.

I acknowledge the lingering frustrations – high prices, high rates, and the feeling that the dream of homeownership is slipping away for some. But I also see a glimmer of hope: more inventory, stabilizing prices, and the very slow, almost imperceptible softening of mortgage rates. These small shifts add up.

For potential buyers, it means that while the market won't suddenly become easy, opportunities are slowly emerging. For sellers, it means being realistic and strategic in a market that demands a little more thought and effort.

Ultimately, the housing market in 2025 will be defined by its resilience and adaptation. It’s not about a dramatic crash, but about a gradual calibration. And in my view, that's a far better outcome for everyone involved. I remain optimistic about the long-term health of housing in America, even as we navigate these choppy but manageable waters.

Invest in Real Estate in the Top U.S. Markets

Discover high-quality, ready-to-rent properties designed to deliver consistent returns.

Contact Norada today to expand your real estate portfolio with confidence.

Contact our investment counselors (No Obligation):

(800) 611-3060

Get Started Now 

Also Read:

  • Housing Market Predictions 2026: Will it Crash or Boom?
  • Housing Market Predictions for the Next 4 Years: 2025 to 2029
  • 12 Housing Markets Set for Double-Digit Price Decline by Early 2026
  • Real Estate Forecast: Will Home Prices Bottom Out in 2025?
  • Real Estate Forecast Next 5 Years: Top 5 Predictions for Future
  • 5 Hottest Real Estate Markets for Buyers & Investors in 2025
  • Will Real Estate Rebound in 2025: Top Predictions by Experts
  • Will the Housing Market Crash Due to Looming Recession in 2025?
  • 4 States Facing the Major Housing Market Crash or Correction
  • New Tariffs Could Trigger Housing Market Slowdown in 2025
  • Real Estate Forecast Next 10 Years: Will Prices Skyrocket?

Filed Under: Housing Market, Real Estate Market Tagged With: Housing Market, housing market crash, Housing Price Forecast, Housing Prices, Real Estate Market

Housing Market Rebounds: Home Sales Tick Up in July 2025

August 22, 2025 by Marco Santarelli

Housing Market Rebounds: Home Sales Tick Up in July 2025

The housing market bounces back, with home sales ticking up in July 2025, offering a much-needed breath of fresh air for buyers and sellers alike. This positive trend, detailed in the National Association of REALTORS® (NAR) Existing-Home Sales Report, indicates a market that’s slowly but surely finding its footing. After a period of adjustment, it seems the market is signaling a return to more favorable conditions.

As a long-time observer of the real estate world, I’ve seen my share of market shifts, and this July report feels significant. It’s not a runaway boom, but a steady, encouraging climb. For those of you who’ve been waiting on the sidelines, feeling a bit discouraged by past conditions, this data offers a reason to pay attention. It suggests that the hesitations of the recent past are beginning to recede, and more people are feeling confident enough to make that big move.

Housing Market Bounces Back: Home Sales Tick Up in July 2025

What the Numbers Tell Us: A Closer Look at July 2025

The NAR report paints a picture of modest but meaningful growth. Let’s break down what those figures really mean for the average person trying to navigate the housing market.

  • A 2.0% Increase in Sales: This month-over-month jump to a seasonally adjusted annual rate of 4.01 million existing-home sales is a solid indicator of renewed activity. It means more homes are changing hands, which generally leads to a more dynamic market.
  • Inventory Grows, Giving Buyers More Choices: We saw a 0.6% increase in unsold inventory, reaching 1.55 million units. This translates to a 4.6-month supply. For buyers, this is fantastic news. More homes on the market means less frantic competition and a better chance of finding the perfect place without feeling rushed. Think of it like walking into a store with a wider selection – you're more likely to find what you're looking for.
  • Prices Stabilize with Modest Growth: The median existing-home price saw a 0.2% increase year-over-year to $422,400. This is important. While we’re not seeing massive price jumps that scare buyers away, we’re also not seeing prices plummet. This stability is a healthy sign, especially when you consider it alongside wage growth.

Why This Uptick Matters: Beyond the Statistics

It’s easy to get lost in the numbers, but what’s really driving this change? I believe it’s a confluence of factors, most notably the subtle improvements in housing affordability.

According to NAR Chief Economist Lawrence Yun, “Wage growth is now comfortably outpacing home price growth, and buyers have more choices.” This is the crucial piece of the puzzle. When your paycheck stretches a little further relative to home prices, and you have a better selection of homes to choose from, the entire process becomes less daunting. It’s about regaining that sense of possibility.

Yun also highlighted something I find particularly reassuring: “Homebuyers are in the best position in more than five years to find the right home and negotiate for a better price.” This shift in buyer leverage is a significant development. It means that the frantic bidding wars and waived contingencies that characterized some recent periods are becoming less common. Buyers can take a breath, do their due diligence, and make more informed decisions.

Regional Variations: A Mixed Bag, But Mostly Bright

It’s always important to remember that the national picture is made up of many local stories. Here’s a quick look at how different regions performed:

Region Month-over-Month Sales Change Year-over-Year Sales Change Median Price Change (YoY)
Northeast +8.7% +2.0% +0.8%
Midwest -1.1% +1.1% +3.9%
South +2.2% +2.2% -0.6%
West +1.4% -4.0% -1.4%

As you can see, not every region experienced the same level of growth. The South and Northeast saw solid gains, both month-over-month and year-over-year. The Midwest also showed year-over-year improvement despite a slight dip month-over-month. The West experienced a year-over-year decline in sales, though it did see an increase month-over-month.

I’m particularly interested in the South. Yun mentioned that “Condominium sales increased in the South region, where prices had been falling for the past year.” This suggests that some markets are correcting themselves, creating opportunities. Meanwhile, the West’s slight dip might be due to higher price points in some areas making affordability a bigger hurdle.

Key Trends Shaping the Market

Beyond the headline sales figures, several other trends are worth noting:

  • Time on Market: Homes are staying on the market a bit longer, averaging 28 days. This is up from 27 days last month and 24 days in July 2024. This isn’t necessarily a bad thing; it allows for more thorough inspections and smoother transactions.
  • First-Time Homebuyers: The percentage of sales to first-time homebuyers dipped slightly to 28%. While this number is down from previous months, it's still a significant portion of the market. The goal is to see this number climb as affordability improves further.
  • Cash Sales and Investors: We’re seeing an increase in cash sales (31%) and transactions by individual investors or second-home buyers (20%). This often indicates confidence in the market, but it also means more competition for traditional buyers who rely on mortgages.
  • Distressed Sales Remain Low: A crucial positive is the continued low rate of distressed sales (foreclosures and short sales) at just 2%. This is a testament to the overall financial health of homeowners and a stark contrast to markets in distress. The fact that only 2% of sales were foreclosures or short sales is a sign of a remarkably healthy market.

What This Means for You

If you're a buyer, this July report is encouraging. The increased inventory and stabilizing prices mean you have a better chance of finding a home that fits your needs and budget. The longer time on market also gives you more room to negotiate.

For sellers, while bidding wars might be less common, a well-priced and well-presented home will still attract serious buyers. The overall increase in sales suggests demand is present.

Looking Ahead

The housing market bounces back with these July numbers, offering a hopeful glimpse into the future. While challenges remain, particularly for those in pricier markets, the underlying trends – wage growth outpacing home prices and increasing inventory – are strong positives. It’s a market that’s maturing, becoming more balanced, and, dare I say, more accessible for many. I’ll be watching closely to see if this momentum continues into the fall.

Invest in Real Estate in the Top U.S. Markets

Discover high-quality, ready-to-rent properties designed to deliver consistent returns.

Contact Norada today to expand your real estate portfolio with confidence.

Contact our investment counselors (No Obligation):

(800) 611-3060

Get Started Now 

Also Read:

  • Housing Market Shift 2025: Pandemic Boomtowns Lead in Price Drops
  • Housing Market Predictions 2025 by Norada Real Estate
  • Housing Market Predictions 2025 by Warren Buffett's Berkshire Hathaway
  • Will the Housing Market Crash in 2025: What Experts Predict?
  • Housing Market Predictions 2026: Will it Crash or Boom?
  • Housing Market Predictions for the Next 4 Years: 2025 to 2029
  • 12 Housing Markets Set for Double-Digit Price Decline by Early 2026
  • Real Estate Forecast: Will Home Prices Bottom Out in 2025?
  • Real Estate Forecast Next 5 Years: Top 5 Predictions for Future
  • 5 Hottest Real Estate Markets for Buyers & Investors in 2025
  • Will Real Estate Rebound in 2025: Top Predictions by Experts
  • Will the Housing Market Crash Due to Looming Recession in 2025?
  • 4 States Facing the Major Housing Market Crash or Correction
  • New Tariffs Could Trigger Housing Market Slowdown in 2025
  • Real Estate Forecast Next 10 Years: Will Prices Skyrocket?

Filed Under: Housing Market, Real Estate Market Tagged With: Housing Market, Housing Market Trends, Housing Prices

California Housing Market Decline: Sales Drop for 4th Straight Month

August 20, 2025 by Marco Santarelli

California Housing Market Decline: Sales Drop for 4th Straight Month

The California housing market is showing signs of cooling, with home sales dipping below last year's figures for the fourth month in a row. This trend, primarily driven by persistently high mortgage rates and economic uncertainty, means fewer homes are changing hands compared to the same period last year.

I can tell you this slowdown isn't entirely surprising. We've been in a bit of a holding pattern, and the latest report from the California Association of REALTORS® (C.A.R.) confirms what many in the industry have been feeling. Existing, single-family home sales in July dropped by 4.1 percent compared to July of last year, settling at a seasonally adjusted annualized rate of 261,820 homes.

That's a noticeable dip from the 272,990 homes sold during the same month in 2024. It's the fourth consecutive month of year-over-year sales declines, which has pushed the year-to-date sales into negative territory.

California Housing Market Decline: Sales Drop for 4th Straight Month

Why the Slowdown? The Usual Suspects and Some New Twists

It's easy to point fingers at one single cause, but in real estate, it's almost always a mix of factors. The big one, and the one everyone’s talking about, is mortgage rates. Even though they've dipped to their lowest point since last October – averaging 6.72 percent in July – they still remain a significant hurdle for many potential buyers. When you compare this to the much lower rates we saw a couple of years ago, the monthly payment difference is substantial. This effectively prices some buyers out of the market or forces them to look at smaller, less expensive homes.

Beyond mortgage rates, I've seen firsthand how economic uncertainty plays a huge role. When people are worried about their jobs, inflation, or the general direction of the economy, they tend to be more cautious with big financial decisions, like buying a house. This caution translates into fewer people actively searching for homes and making offers.

C.A.R. President Heather Ozur echoed this sentiment, noting that “some buyers stepped back, waiting for more certainty in the market and broader economy.” It’s a rational move for many, and it directly impacts sales numbers.

Home Prices: A Slight Dip, But What Does It Really Mean?

While sales volume is down, home prices haven't taken a nosedive. The statewide median home price in July was $884,050. This is a slight decrease of 0.3 percent from July 2024, when the median price was $886,420. It's also down 1.7 percent from June, marking the third consecutive monthly decline.

This might sound counterintuitive—lower sales but only a small price drop? From my perspective, this is often a sign of a market that's rebalancing rather than crashing. When demand cools, sellers might need to adjust their expectations. However, California’s housing market is notoriously resilient due to supply constraints and consistent demand in many areas. So, a small dip in the median price doesn't mean a fire sale; it suggests a more moderate market.

Jordan Levine, C.A.R.’s Senior Vice President and Chief Economist, pointed out that with inventory reaching a plateau, the market is indeed cooling. He also offered a hopeful note: “Even with recent price declines, California’s median home price could still see a modest annual increase in 2025, provided the market stabilizes in the coming months.” That's the key phrase: stabilizes.

Regional Pockets of Activity: Not All of California is Moving at the Same Pace

It's crucial to remember that California is a huge and diverse state, and its housing market is equally varied. What's happening in one region might be completely different in another.

Let’s break down some of the regional highlights from the C.A.R. report:

  • Regions Showing Growth:
    • The Far North saw a modest 4.8 percent increase in sales compared to last year.
    • The Central Coast also experienced a bump, with sales up 1.7 percent year-over-year.
  • Regions Experiencing Declines:
    • The San Francisco Bay Area faced the largest regional decline, with sales falling by 4.1 percent. This is an area that often sets the pace, so its slowdown is significant.
    • Southern California and the Central Valley both saw more moderate pullbacks of 1.7 percent and 1.5 percent, respectively.

When we look at median home prices by region for July:

  • Regions with Price Increases:
    • The Central Coast led the way with a 4.9 percent gain compared to last year.
    • The Far North saw a 3.1 percent rise.
  • Regions with Stable or Declining Prices:
    • The Central Valley and San Francisco Bay Area median prices held steady.
    • Southern California experienced a slight 0.7 percent dip.

It's fascinating to see how different economic factors and local supply-and-demand dynamics play out across the state. For instance, areas in the Far North that might be more affordable or have different job markets could be less affected by national economic headwinds.

County-Level Snapshot: Where the Action (or Lack Thereof) Is

Drilling down further, the county-level data paints an even more detailed picture:

  • Counties with Strong Sales Growth:
    • Imperial County was a standout, with an astonishing 116.1 percent jump in sales year-over-year. This often happens in more affordable areas as buyers are priced out of more expensive regions.
    • Mariposa County saw a 91.7 percent increase, followed by Butte County with a 41.6 percent rise. It’s interesting to note that half of the counties with sales gains achieved double-digit growth.
  • Counties with Significant Sales Declines:
    • Mendocino County experienced a sharp 26.7 percent drop in sales.
    • Lake County saw a 22.6 percent decline.
    • Madera County was down 21.3 percent.

On the price front:

  • Counties with Notable Price Increases:
    • Mono County had the biggest surge at 56.5 percent.
    • Santa Barbara County jumped 32.4 percent.
    • Tehama County saw a 27.6 percent increase.
  • Counties with Price Decreases:
    • Trinity County saw the largest drop at 19.2 percent.
    • Mendocino County was down 15.0 percent.
    • Plumas County fell 14.6 percent.

This high-level view shows that while the statewide trend is downward in terms of sales volume, there are specific areas performing very differently. This highlights the importance for buyers and sellers to focus on local market conditions rather than broad generalizations.

Inventory and Time on Market: The Balance of Supply and Demand

One of the key indicators I always look at is the unsold inventory index (UII), which tells us how long it would take to sell the current supply of homes at the current pace. In July, the UII was 3.7 months, up from 2.9 months in July 2024. This is a clear sign that there’s more inventory available relative to the number of sales, which tends to give buyers more negotiating power.

We also saw that total active listings were up a significant 37.7 percent from a year ago, reaching a 69-month high. This is a big deal. More homes on the market mean less competition for buyers and can put downward pressure on prices. However, the report also notes that the pace of growth in active listings has slowed down, which might indicate that new listings aren't coming onto the market as rapidly as they were a few months ago.

And what about how quickly homes are selling? The median number of days it took to sell a California single-family home was 28 days in July. This is up from just 20 days in July 2024. Homes are staying on the market longer, which aligns with the idea of a cooling market and more choices for buyers.

The sales-to-list-price ratio also confirms this shift. It was 98.5 percent in July 2025, down from a perfect 100 percent in July 2024. This means that, on average, homes are selling slightly below their asking price, a departure from the bidding wars we saw previously.

What's Next? Navigating Uncertainty

So, where does this leave us heading into the latter part of the year? The sentiment from C.A.R. is cautiously optimistic. The recent dip in mortgage rates is a positive sign, potentially bringing some buyers back into the game. However, the persistent inflation and economic concerns mean that the market could remain soft through August.

As a professional in this field, I believe the key will be stability – stability in mortgage rates and stability in the broader economy. When people feel more confident about their financial futures, they are more likely to make the significant commitment of buying a home.

For buyers, this period could present opportunities. With homes staying on the market longer and less intense competition, buyers might find more room for negotiation. However, it's still essential to be well-prepared and understand the local market dynamics.

For sellers, patience and realistic pricing are key. While the market isn't as frenzied as it once was, a well-priced and well-presented home can still attract strong interest. Understanding the current market value based on recent comparable sales is more critical than ever.

The California housing market is always evolving. While sales may be trailing last year's levels for now, it’s a complex picture with regional variations and subtle shifts that point towards a market that's finding a new equilibrium. Keeping an eye on mortgage rates, economic indicators, and local inventory levels will be crucial for anyone involved in buying or selling property in the Golden State.

“Invest in Real Estate in the Growing Markets”

Discover high-quality, ready-to-rent properties designed to deliver consistent returns.

Contact us today to expand your real estate portfolio with confidence.

HOT NEW LISTINGS JUST ADDED IN MULTIPLE MARKETS!

Contact our investment counselors (No Obligation):

(800) 611-3060

Get Started Now

Related Articles:

  • California Housing Affordability Drops in Q2 2025 Amid High Mortgage Rates
  • California Housing Market Rebounds After a Three-Month Slump in Sales
  • Is the California Housing Market Heading for a Crash or Correction?
  • California Housing Market: Forecast and Trends 2025-2026
  • California Housing Market Graph 50 Years
  • The Great Recession and California's Housing Market Crash: A Retrospective
  • California Dominates Housing With 7 of Top 10 Priciest Markets
  • Real Estate Forecast Next 5 Years California: Boom or Crash?
  • Anaheim, California Joins Trillion-Dollar Club of Housing Markets
  • California Housing Market: Nearly $174,000 Needed to Buy a Home
  • Most Expensive Housing Markets in California
  • Abandoned Houses for Free California: Can You Own Them?
  • California Housing in High Demand: 19 Golden State Cities Sizzle
  • Homes Under 50k in California: Where to Find Them?
  • Will the California Housing Market Crash?
  • California Housing Market Crash: Is a Correction Coming Up?

Filed Under: Growth Markets, Housing Market, Real Estate Market Tagged With: california, Housing Market

  • « Previous Page
  • 1
  • …
  • 18
  • 19
  • 20
  • 21
  • 22
  • …
  • 93
  • Next Page »

Real Estate

  • Birmingham
  • Cape Coral
  • Charlotte
  • Chicago

Quick Links

  • Markets
  • Membership
  • Notes
  • Contact Us

Blog Posts

  • Today’s Mortgage Rates, May 13, 2026: Buyers Face Rising Rates Across the Board
    May 13, 2026Marco Santarelli
  • How to Get a 5% Mortgage Rate in 2026?
    May 13, 2026Marco Santarelli
  • Mortgage Rate Predictions This Week: May 11th – 17th
    May 13, 2026Marco Santarelli

Contact

Norada Real Estate Investments 30251 Golden Lantern, Suite E-261 Laguna Niguel, CA 92677

(949) 218-6668
(800) 611-3060
BBB
  • Terms of Use
  • |
  • Privacy Policy
  • |
  • Testimonials
  • |
  • Suggestions?
  • |
  • Home

Copyright 2018 Norada Real Estate Investments

Loading...